Asian vs Immigrants from St. Vincent and the Grenadines Disability Age 5 to 17
COMPARE
Asian
Immigrants from St. Vincent and the Grenadines
Disability Age 5 to 17
Disability Age 5 to 17 Comparison
Asians
Immigrants from St. Vincent and the Grenadines
4.8%
DISABILITY AGE 5 TO 17
100.0/ 100
METRIC RATING
22nd/ 347
METRIC RANK
5.2%
DISABILITY AGE 5 TO 17
99.4/ 100
METRIC RATING
86th/ 347
METRIC RANK
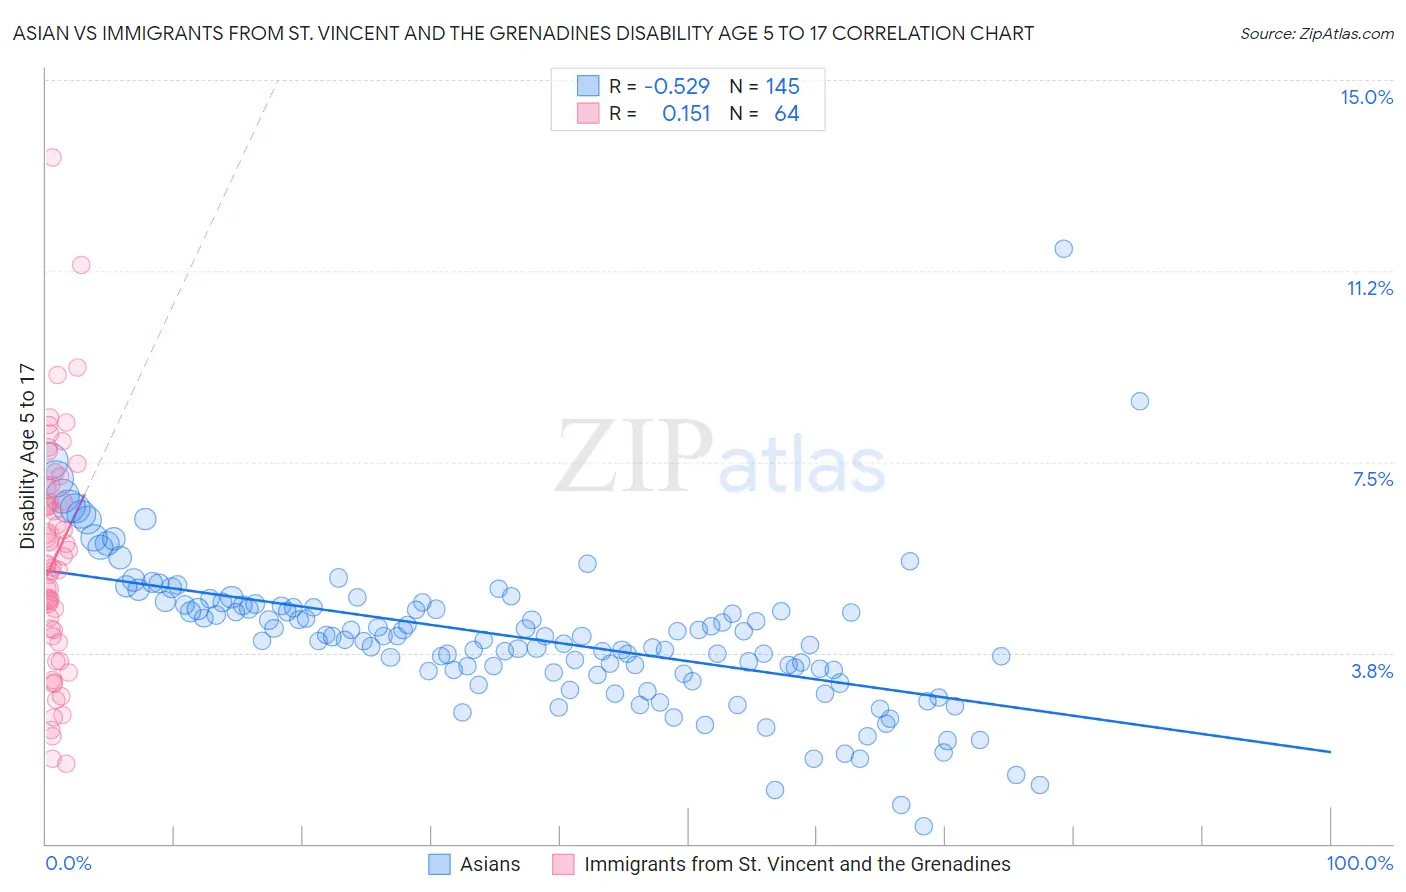
Asian vs Immigrants from St. Vincent and the Grenadines Disability Age 5 to 17 Correlation Chart
The statistical analysis conducted on geographies consisting of 540,712,205 people shows a substantial negative correlation between the proportion of Asians and percentage of population with a disability between the ages 5 and 17 in the United States with a correlation coefficient (R) of -0.529 and weighted average of 4.8%. Similarly, the statistical analysis conducted on geographies consisting of 56,117,818 people shows a poor positive correlation between the proportion of Immigrants from St. Vincent and the Grenadines and percentage of population with a disability between the ages 5 and 17 in the United States with a correlation coefficient (R) of 0.151 and weighted average of 5.2%, a difference of 9.1%.
Disability Age 5 to 17 Correlation Summary
| Measurement | Asian | Immigrants from St. Vincent and the Grenadines |
| Minimum | 0.35% | 1.6% |
| Maximum | 11.7% | 13.5% |
| Range | 11.3% | 11.9% |
| Mean | 4.1% | 5.6% |
| Median | 4.1% | 5.5% |
| Interquartile 25% (IQ1) | 3.4% | 4.1% |
| Interquartile 75% (IQ3) | 4.7% | 6.8% |
| Interquartile Range (IQR) | 1.3% | 2.7% |
| Standard Deviation (Sample) | 1.5% | 2.3% |
| Standard Deviation (Population) | 1.5% | 2.2% |
Similar Demographics by Disability Age 5 to 17
Demographics Similar to Asians by Disability Age 5 to 17
In terms of disability age 5 to 17, the demographic groups most similar to Asians are Yup'ik (4.8%, a difference of 0.34%), Burmese (4.8%, a difference of 0.56%), Immigrants from Bolivia (4.8%, a difference of 0.66%), Immigrants from Lebanon (4.8%, a difference of 0.81%), and Immigrants from Asia (4.8%, a difference of 0.92%).
| Demographics | Rating | Rank | Disability Age 5 to 17 |
| Chinese | 100.0 /100 | #15 | Exceptional 4.7% |
| Immigrants | Singapore | 100.0 /100 | #16 | Exceptional 4.7% |
| Arapaho | 100.0 /100 | #17 | Exceptional 4.7% |
| Immigrants | South Central Asia | 100.0 /100 | #18 | Exceptional 4.7% |
| Immigrants | Uzbekistan | 100.0 /100 | #19 | Exceptional 4.8% |
| Burmese | 100.0 /100 | #20 | Exceptional 4.8% |
| Yup'ik | 100.0 /100 | #21 | Exceptional 4.8% |
| Asians | 100.0 /100 | #22 | Exceptional 4.8% |
| Immigrants | Bolivia | 100.0 /100 | #23 | Exceptional 4.8% |
| Immigrants | Lebanon | 100.0 /100 | #24 | Exceptional 4.8% |
| Immigrants | Asia | 100.0 /100 | #25 | Exceptional 4.8% |
| Bhutanese | 100.0 /100 | #26 | Exceptional 4.9% |
| Taiwanese | 100.0 /100 | #27 | Exceptional 4.9% |
| Immigrants | Japan | 100.0 /100 | #28 | Exceptional 4.9% |
| Immigrants | Serbia | 100.0 /100 | #29 | Exceptional 4.9% |
Demographics Similar to Immigrants from St. Vincent and the Grenadines by Disability Age 5 to 17
In terms of disability age 5 to 17, the demographic groups most similar to Immigrants from St. Vincent and the Grenadines are Bulgarian (5.2%, a difference of 0.040%), Eastern European (5.2%, a difference of 0.040%), Immigrants from Croatia (5.2%, a difference of 0.070%), Immigrants from Spain (5.2%, a difference of 0.080%), and Immigrants from Nicaragua (5.2%, a difference of 0.11%).
| Demographics | Rating | Rank | Disability Age 5 to 17 |
| Afghans | 99.6 /100 | #79 | Exceptional 5.2% |
| Sri Lankans | 99.6 /100 | #80 | Exceptional 5.2% |
| Native Hawaiians | 99.6 /100 | #81 | Exceptional 5.2% |
| Immigrants | Sweden | 99.5 /100 | #82 | Exceptional 5.2% |
| Immigrants | France | 99.5 /100 | #83 | Exceptional 5.2% |
| Immigrants | Nicaragua | 99.5 /100 | #84 | Exceptional 5.2% |
| Bulgarians | 99.4 /100 | #85 | Exceptional 5.2% |
| Immigrants | St. Vincent and the Grenadines | 99.4 /100 | #86 | Exceptional 5.2% |
| Eastern Europeans | 99.4 /100 | #87 | Exceptional 5.2% |
| Immigrants | Croatia | 99.4 /100 | #88 | Exceptional 5.2% |
| Immigrants | Spain | 99.4 /100 | #89 | Exceptional 5.2% |
| Immigrants | Kuwait | 99.4 /100 | #90 | Exceptional 5.3% |
| Mongolians | 99.2 /100 | #91 | Exceptional 5.3% |
| Luxembourgers | 99.2 /100 | #92 | Exceptional 5.3% |
| Immigrants | Peru | 99.1 /100 | #93 | Exceptional 5.3% |