Asian vs Immigrants from St. Vincent and the Grenadines In Labor Force | Age 25-29
COMPARE
Asian
Immigrants from St. Vincent and the Grenadines
In Labor Force | Age 25-29
In Labor Force | Age 25-29 Comparison
Asians
Immigrants from St. Vincent and the Grenadines
84.8%
IN LABOR FORCE | AGE 25-29
77.7/ 100
METRIC RATING
133rd/ 347
METRIC RANK
82.7%
IN LABOR FORCE | AGE 25-29
0.0/ 100
METRIC RATING
304th/ 347
METRIC RANK
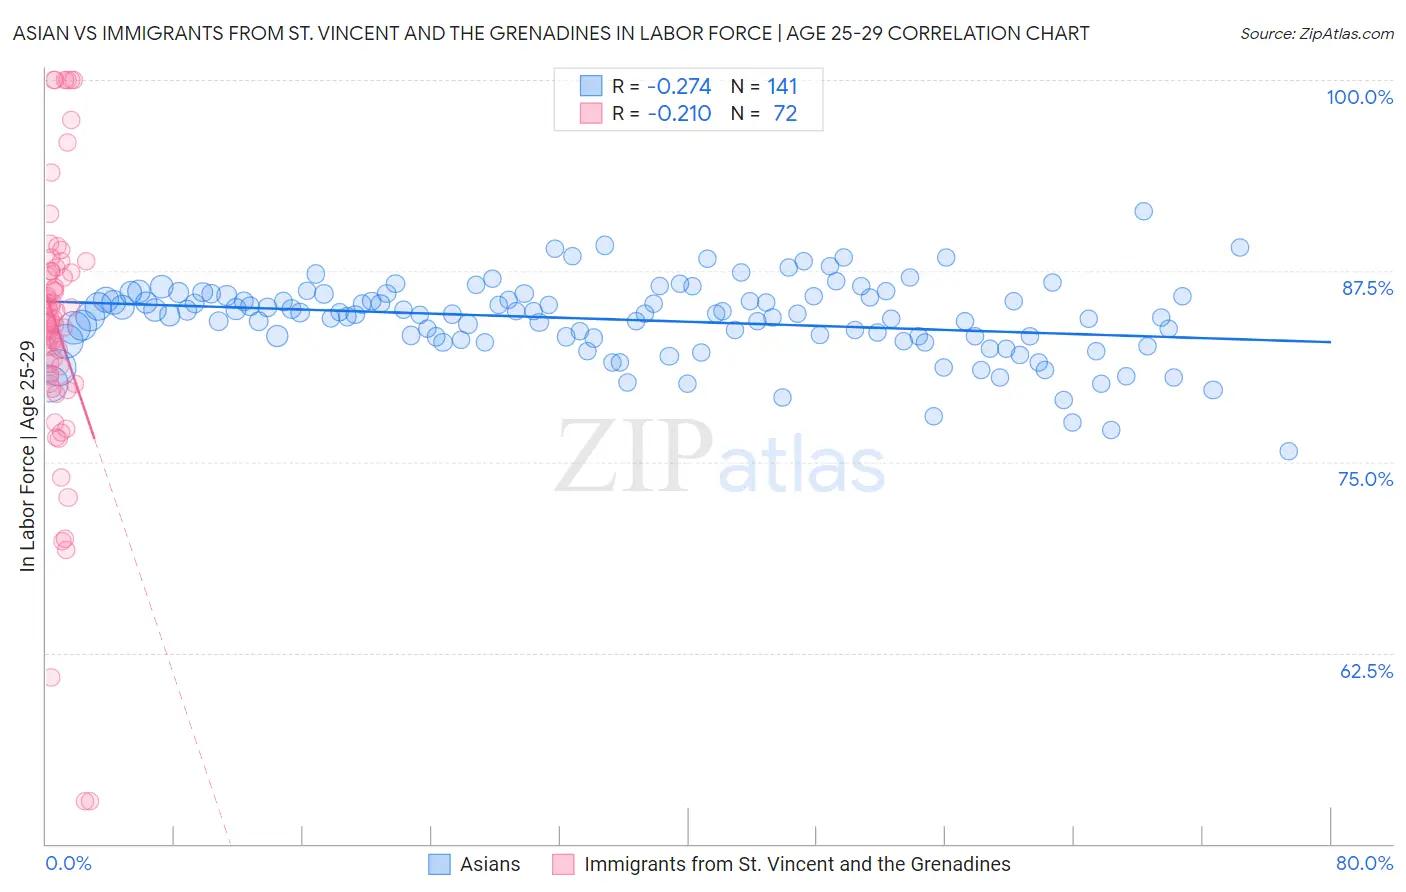
Asian vs Immigrants from St. Vincent and the Grenadines In Labor Force | Age 25-29 Correlation Chart
The statistical analysis conducted on geographies consisting of 550,144,058 people shows a weak negative correlation between the proportion of Asians and labor force participation rate among population between the ages 25 and 29 in the United States with a correlation coefficient (R) of -0.274 and weighted average of 84.8%. Similarly, the statistical analysis conducted on geographies consisting of 56,189,778 people shows a weak negative correlation between the proportion of Immigrants from St. Vincent and the Grenadines and labor force participation rate among population between the ages 25 and 29 in the United States with a correlation coefficient (R) of -0.210 and weighted average of 82.7%, a difference of 2.6%.
In Labor Force | Age 25-29 Correlation Summary
| Measurement | Asian | Immigrants from St. Vincent and the Grenadines |
| Minimum | 75.7% | 52.8% |
| Maximum | 91.4% | 100.0% |
| Range | 15.7% | 47.2% |
| Mean | 84.3% | 83.7% |
| Median | 84.7% | 84.1% |
| Interquartile 25% (IQ1) | 83.0% | 80.3% |
| Interquartile 75% (IQ3) | 85.9% | 87.5% |
| Interquartile Range (IQR) | 2.8% | 7.1% |
| Standard Deviation (Sample) | 2.5% | 9.1% |
| Standard Deviation (Population) | 2.5% | 9.1% |
Similar Demographics by In Labor Force | Age 25-29
Demographics Similar to Asians by In Labor Force | Age 25-29
In terms of in labor force | age 25-29, the demographic groups most similar to Asians are Iranian (84.8%, a difference of 0.0%), Romanian (84.8%, a difference of 0.0%), Syrian (84.8%, a difference of 0.010%), Immigrants from Hungary (84.8%, a difference of 0.010%), and Bhutanese (84.8%, a difference of 0.020%).
| Demographics | Rating | Rank | In Labor Force | Age 25-29 |
| Immigrants | Singapore | 84.4 /100 | #126 | Excellent 84.9% |
| Immigrants | Uruguay | 84.0 /100 | #127 | Excellent 84.9% |
| Australians | 83.6 /100 | #128 | Excellent 84.9% |
| Immigrants | Russia | 81.6 /100 | #129 | Excellent 84.9% |
| Northern Europeans | 81.3 /100 | #130 | Excellent 84.9% |
| Iranians | 78.1 /100 | #131 | Good 84.8% |
| Romanians | 77.7 /100 | #132 | Good 84.8% |
| Asians | 77.7 /100 | #133 | Good 84.8% |
| Syrians | 76.5 /100 | #134 | Good 84.8% |
| Immigrants | Hungary | 76.4 /100 | #135 | Good 84.8% |
| Bhutanese | 76.0 /100 | #136 | Good 84.8% |
| Immigrants | Canada | 73.5 /100 | #137 | Good 84.8% |
| Armenians | 72.7 /100 | #138 | Good 84.8% |
| Immigrants | Eastern Asia | 72.6 /100 | #139 | Good 84.8% |
| Immigrants | North America | 72.1 /100 | #140 | Good 84.8% |
Demographics Similar to Immigrants from St. Vincent and the Grenadines by In Labor Force | Age 25-29
In terms of in labor force | age 25-29, the demographic groups most similar to Immigrants from St. Vincent and the Grenadines are Immigrants from Grenada (82.8%, a difference of 0.12%), Black/African American (82.6%, a difference of 0.12%), Blackfeet (82.6%, a difference of 0.13%), Immigrants from Belize (82.8%, a difference of 0.14%), and Vietnamese (82.8%, a difference of 0.17%).
| Demographics | Rating | Rank | In Labor Force | Age 25-29 |
| Potawatomi | 0.0 /100 | #297 | Tragic 82.9% |
| Native Hawaiians | 0.0 /100 | #298 | Tragic 82.9% |
| Fijians | 0.0 /100 | #299 | Tragic 82.9% |
| Spanish American Indians | 0.0 /100 | #300 | Tragic 82.9% |
| Vietnamese | 0.0 /100 | #301 | Tragic 82.8% |
| Immigrants | Belize | 0.0 /100 | #302 | Tragic 82.8% |
| Immigrants | Grenada | 0.0 /100 | #303 | Tragic 82.8% |
| Immigrants | St. Vincent and the Grenadines | 0.0 /100 | #304 | Tragic 82.7% |
| Blacks/African Americans | 0.0 /100 | #305 | Tragic 82.6% |
| Blackfeet | 0.0 /100 | #306 | Tragic 82.6% |
| Cajuns | 0.0 /100 | #307 | Tragic 82.5% |
| Central American Indians | 0.0 /100 | #308 | Tragic 82.4% |
| Immigrants | Central America | 0.0 /100 | #309 | Tragic 82.4% |
| Osage | 0.0 /100 | #310 | Tragic 82.3% |
| Alaskan Athabascans | 0.0 /100 | #311 | Tragic 82.3% |