Asian vs Paraguayan Disability Age 35 to 64
COMPARE
Asian
Paraguayan
Disability Age 35 to 64
Disability Age 35 to 64 Comparison
Asians
Paraguayans
9.4%
DISABILITY AGE 35 TO 64
100.0/ 100
METRIC RATING
24th/ 347
METRIC RANK
9.8%
DISABILITY AGE 35 TO 64
99.8/ 100
METRIC RATING
50th/ 347
METRIC RANK
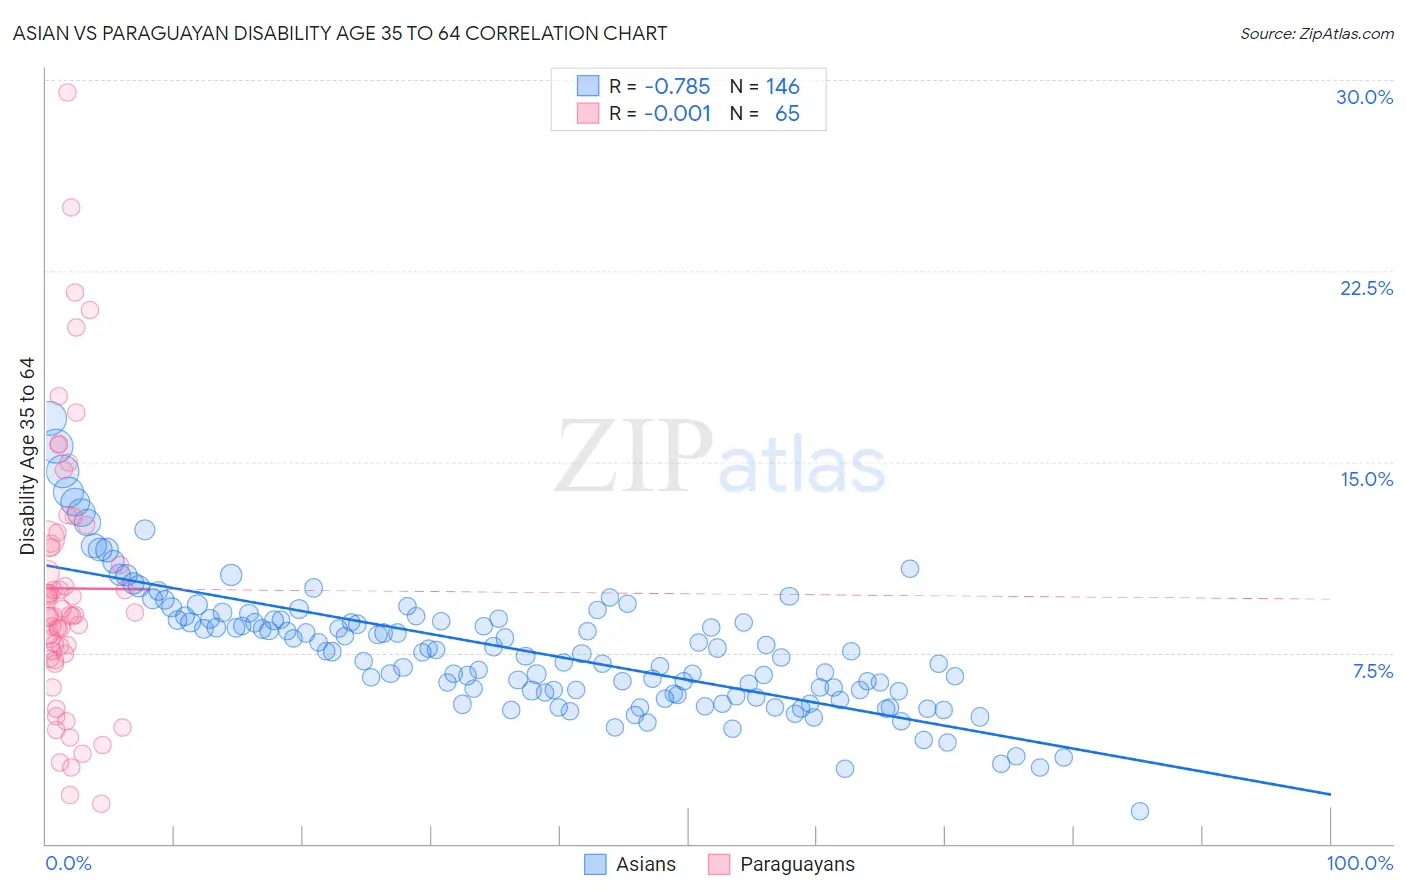
Asian vs Paraguayan Disability Age 35 to 64 Correlation Chart
The statistical analysis conducted on geographies consisting of 549,994,664 people shows a strong negative correlation between the proportion of Asians and percentage of population with a disability between the ages 34 and 64 in the United States with a correlation coefficient (R) of -0.785 and weighted average of 9.4%. Similarly, the statistical analysis conducted on geographies consisting of 95,099,439 people shows no correlation between the proportion of Paraguayans and percentage of population with a disability between the ages 34 and 64 in the United States with a correlation coefficient (R) of -0.001 and weighted average of 9.8%, a difference of 4.8%.
Disability Age 35 to 64 Correlation Summary
| Measurement | Asian | Paraguayan |
| Minimum | 1.3% | 1.6% |
| Maximum | 16.7% | 29.5% |
| Range | 15.4% | 28.0% |
| Mean | 7.6% | 10.0% |
| Median | 7.5% | 9.0% |
| Interquartile 25% (IQ1) | 5.9% | 7.4% |
| Interquartile 75% (IQ3) | 8.8% | 11.9% |
| Interquartile Range (IQR) | 2.9% | 4.5% |
| Standard Deviation (Sample) | 2.5% | 5.3% |
| Standard Deviation (Population) | 2.5% | 5.3% |
Similar Demographics by Disability Age 35 to 64
Demographics Similar to Asians by Disability Age 35 to 64
In terms of disability age 35 to 64, the demographic groups most similar to Asians are Argentinean (9.4%, a difference of 0.010%), Cypriot (9.4%, a difference of 0.23%), Okinawan (9.4%, a difference of 0.26%), Venezuelan (9.4%, a difference of 0.29%), and Immigrants from Argentina (9.3%, a difference of 0.69%).
| Demographics | Rating | Rank | Disability Age 35 to 64 |
| Burmese | 100.0 /100 | #17 | Exceptional 9.2% |
| Soviet Union | 100.0 /100 | #18 | Exceptional 9.2% |
| Immigrants | Venezuela | 100.0 /100 | #19 | Exceptional 9.3% |
| Immigrants | Argentina | 100.0 /100 | #20 | Exceptional 9.3% |
| Okinawans | 100.0 /100 | #21 | Exceptional 9.4% |
| Cypriots | 100.0 /100 | #22 | Exceptional 9.4% |
| Argentineans | 100.0 /100 | #23 | Exceptional 9.4% |
| Asians | 100.0 /100 | #24 | Exceptional 9.4% |
| Venezuelans | 100.0 /100 | #25 | Exceptional 9.4% |
| Immigrants | Sri Lanka | 100.0 /100 | #26 | Exceptional 9.5% |
| Immigrants | Asia | 100.0 /100 | #27 | Exceptional 9.5% |
| Immigrants | Pakistan | 100.0 /100 | #28 | Exceptional 9.5% |
| Immigrants | Ireland | 100.0 /100 | #29 | Exceptional 9.5% |
| Immigrants | Japan | 100.0 /100 | #30 | Exceptional 9.5% |
| Immigrants | Lithuania | 99.9 /100 | #31 | Exceptional 9.6% |
Demographics Similar to Paraguayans by Disability Age 35 to 64
In terms of disability age 35 to 64, the demographic groups most similar to Paraguayans are Immigrants from Greece (9.8%, a difference of 0.070%), Bhutanese (9.8%, a difference of 0.080%), Immigrants from Bulgaria (9.8%, a difference of 0.10%), Immigrants from Serbia (9.8%, a difference of 0.11%), and Immigrants from Belgium (9.8%, a difference of 0.12%).
| Demographics | Rating | Rank | Disability Age 35 to 64 |
| Immigrants | Colombia | 99.9 /100 | #43 | Exceptional 9.8% |
| Immigrants | Egypt | 99.9 /100 | #44 | Exceptional 9.8% |
| Immigrants | Peru | 99.9 /100 | #45 | Exceptional 9.8% |
| Cambodians | 99.8 /100 | #46 | Exceptional 9.8% |
| Immigrants | Belgium | 99.8 /100 | #47 | Exceptional 9.8% |
| Immigrants | Serbia | 99.8 /100 | #48 | Exceptional 9.8% |
| Immigrants | Greece | 99.8 /100 | #49 | Exceptional 9.8% |
| Paraguayans | 99.8 /100 | #50 | Exceptional 9.8% |
| Bhutanese | 99.8 /100 | #51 | Exceptional 9.8% |
| Immigrants | Bulgaria | 99.8 /100 | #52 | Exceptional 9.8% |
| Taiwanese | 99.8 /100 | #53 | Exceptional 9.8% |
| Immigrants | Russia | 99.8 /100 | #54 | Exceptional 9.8% |
| Peruvians | 99.8 /100 | #55 | Exceptional 9.9% |
| South Americans | 99.8 /100 | #56 | Exceptional 9.9% |
| Colombians | 99.8 /100 | #57 | Exceptional 9.9% |