Asian vs Burmese In Labor Force | Age 45-54

COMPARE

Asian
Race
Ancestry
AfghanAfricanAlaska NativeAlaskan AthabascanAlbanianAleutAlsatianAmericanApacheArabArapahoArgentineanArmenianAssyrian/Chaldean/SyriacAustralianAustrianBahamianBangladeshiBarbadianBasqueBelgianBelizeanBermudanBhutaneseBlackfeetBolivianBrazilianBritishBritish West IndianBulgarianCajunCambodianCanadianCape VerdeanCarpatho RusynCelticCentral AmericanCentral American IndianCherokeeCheyenneChickasawChileanChineseChippewaChoctawColombianColvilleComancheCosta RicanCreeCreekCroatianCrowCubanCypriotCzechCzechoslovakianDanishDelawareDominicanDutchDutch West IndianEastern EuropeanEcuadorianEgyptianEnglishEstonianEthiopianEuropeanFijianFilipinoFinnishFrenchFrench American IndianFrench CanadianGermanGerman RussianGhanaianGreekGuamanian/ChamorroGuatemalanGuyaneseHaitianHmongHonduranHopiHoumaHungarianIcelanderIndian (Asian)IndonesianInupiatIranianIraqiIrishIroquoisIsraeliItalianJamaicanJapaneseJordanianKenyanKiowaKoreanLaotianLatvianLebaneseLiberianLithuanianLumbeeLuxembourgerMacedonianMalaysianMalteseMarshalleseMenomineeMexicanMexican American IndianMongolianMoroccanNative HawaiianNavajoNepaleseNew ZealanderNicaraguanNigerianNorthern EuropeanNorwegianOkinawanOsageOttawaPaiutePakistaniPalestinianPanamanianParaguayanPennsylvania GermanPeruvianPimaPolishPortuguesePotawatomiPuebloPuerto RicanPuget Sound SalishRomanianRussianSalvadoranSamoanScandinavianScotch-IrishScottishSeminoleSenegaleseSerbianShoshoneSierra LeoneanSiouxSlavicSlovakSloveneSomaliSouth AfricanSouth AmericanSouth American IndianSoviet UnionSpaniardSpanishSpanish AmericanSpanish American IndianSri LankanSubsaharan AfricanSudaneseSwedishSwissSyrianTaiwaneseThaiTlingit-HaidaTohono O'OdhamTonganTrinidadian and TobagonianTsimshianTurkishU.S. Virgin IslanderUgandanUkrainianUruguayanUteVenezuelanVietnameseWelshWest IndianYakamaYaquiYugoslavianYumanYup'ikZimbabwean
Immigration
NonimmigrantsImmigrantsAfghanistanAfricaAlbaniaArgentinaArmeniaAsiaAustraliaAustriaBahamasBangladeshBarbadosBelarusBelgiumBelizeBoliviaBosnia and HerzegovinaBrazilBulgariaBurma/MyanmarCabo VerdeCambodiaCameroonCanadaCaribbeanCentral AmericaChileChinaColombiaCongoCosta RicaCroatiaCubaCzechoslovakiaDenmarkDominicaDominican RepublicEastern AfricaEastern AsiaEastern EuropeEcuadorEgyptEl SalvadorEnglandEritreaEthiopiaEuropeFijiFranceGermanyGhanaGreeceGrenadaGuatemalaGuyanaHaitiHondurasHong KongHungaryIndiaIndonesiaIranIraqIrelandIsraelItalyJamaicaJapanJordanKazakhstanKenyaKoreaKuwaitLaosLatin AmericaLatviaLebanonLiberiaLithuaniaMalaysiaMexicoMicronesiaMiddle AfricaMoldovaMoroccoNepalNetherlandsNicaraguaNigeriaNorth AmericaNorth MacedoniaNorthern AfricaNorthern EuropeNorwayOceaniaPakistanPanamaPeruPhilippinesPolandPortugalRomaniaRussiaSaudi ArabiaScotlandSenegalSerbiaSierra LeoneSingaporeSomaliaSouth AfricaSouth AmericaSouth Central AsiaSouth Eastern AsiaSouthern EuropeSpainSri LankaSt. Vincent and the GrenadinesSudanSwedenSwitzerlandSyriaTaiwanThailandTrinidad and TobagoTurkeyUgandaUkraineUruguayUzbekistanVenezuelaVietnamWest IndiesWestern AfricaWestern AsiaWestern EuropeYemenZaireZimbabweAzores
Burmese
Race
Ancestry
AfghanAfricanAlaska NativeAlaskan AthabascanAlbanianAleutAlsatianAmericanApacheArabArapahoArgentineanArmenianAssyrian/Chaldean/SyriacAustralianAustrianBahamianBangladeshiBarbadianBasqueBelgianBelizeanBermudanBhutaneseBlackfeetBolivianBrazilianBritishBritish West IndianBulgarianBurmeseCajunCambodianCanadianCape VerdeanCarpatho RusynCelticCentral AmericanCentral American IndianCherokeeCheyenneChickasawChileanChineseChippewaChoctawColombianColvilleComancheCosta RicanCreeCreekCroatianCrowCubanCypriotCzechCzechoslovakianDanishDelawareDominicanDutchDutch West IndianEastern EuropeanEcuadorianEgyptianEnglishEstonianEthiopianEuropeanFijianFilipinoFinnishFrenchFrench American IndianFrench CanadianGermanGerman RussianGhanaianGreekGuamanian/ChamorroGuatemalanGuyaneseHaitianHmongHonduranHopiHoumaHungarianIcelanderIndian (Asian)IndonesianInupiatIranianIraqiIrishIroquoisIsraeliItalianJamaicanJapaneseJordanianKenyanKiowaKoreanLaotianLatvianLebaneseLiberianLithuanianLumbeeLuxembourgerMacedonianMalaysianMalteseMarshalleseMenomineeMexicanMexican American IndianMongolianMoroccanNative HawaiianNavajoNepaleseNew ZealanderNicaraguanNigerianNorthern EuropeanNorwegianOkinawanOsageOttawaPaiutePakistaniPalestinianPanamanianParaguayanPennsylvania GermanPeruvianPimaPolishPortuguesePotawatomiPuebloPuerto RicanPuget Sound SalishRomanianRussianSalvadoranSamoanScandinavianScotch-IrishScottishSeminoleSenegaleseSerbianShoshoneSierra LeoneanSiouxSlavicSlovakSloveneSomaliSouth AfricanSouth AmericanSouth American IndianSoviet UnionSpaniardSpanishSpanish AmericanSpanish American IndianSri LankanSubsaharan AfricanSudaneseSwedishSwissSyrianTaiwaneseThaiTlingit-HaidaTohono O'OdhamTonganTrinidadian and TobagonianTsimshianTurkishU.S. Virgin IslanderUgandanUkrainianUruguayanUteVenezuelanVietnameseWelshWest IndianYakamaYaquiYugoslavianYumanYup'ikZimbabwean
Immigration
NonimmigrantsImmigrantsAfghanistanAfricaAlbaniaArgentinaArmeniaAsiaAustraliaAustriaBahamasBangladeshBarbadosBelarusBelgiumBelizeBoliviaBosnia and HerzegovinaBrazilBulgariaBurma/MyanmarCabo VerdeCambodiaCameroonCanadaCaribbeanCentral AmericaChileChinaColombiaCongoCosta RicaCroatiaCubaCzechoslovakiaDenmarkDominicaDominican RepublicEastern AfricaEastern AsiaEastern EuropeEcuadorEgyptEl SalvadorEnglandEritreaEthiopiaEuropeFijiFranceGermanyGhanaGreeceGrenadaGuatemalaGuyanaHaitiHondurasHong KongHungaryIndiaIndonesiaIranIraqIrelandIsraelItalyJamaicaJapanJordanKazakhstanKenyaKoreaKuwaitLaosLatin AmericaLatviaLebanonLiberiaLithuaniaMalaysiaMexicoMicronesiaMiddle AfricaMoldovaMoroccoNepalNetherlandsNicaraguaNigeriaNorth AmericaNorth MacedoniaNorthern AfricaNorthern EuropeNorwayOceaniaPakistanPanamaPeruPhilippinesPolandPortugalRomaniaRussiaSaudi ArabiaScotlandSenegalSerbiaSierra LeoneSingaporeSomaliaSouth AfricaSouth AmericaSouth Central AsiaSouth Eastern AsiaSouthern EuropeSpainSri LankaSt. Vincent and the GrenadinesSudanSwedenSwitzerlandSyriaTaiwanThailandTrinidad and TobagoTurkeyUgandaUkraineUruguayUzbekistanVenezuelaVietnamWest IndiesWestern AfricaWestern AsiaWestern EuropeYemenZaireZimbabweAzores
In Labor Force | Age 45-54
Income
Poverty
Unemployment
Labor Participation
Family Structure
Vehicle Availability
Education Level
Disability

In Labor Force | Age 45-54 Comparison

Asians

Burmese

Exceptional
Exceptional
83.4%
IN LABOR FORCE | AGE 45-54
97.7/ 100
METRIC RATING
66th/ 347
METRIC RANK
83.6%
IN LABOR FORCE | AGE 45-54
99.1/ 100
METRIC RATING
44th/ 347
METRIC RANK

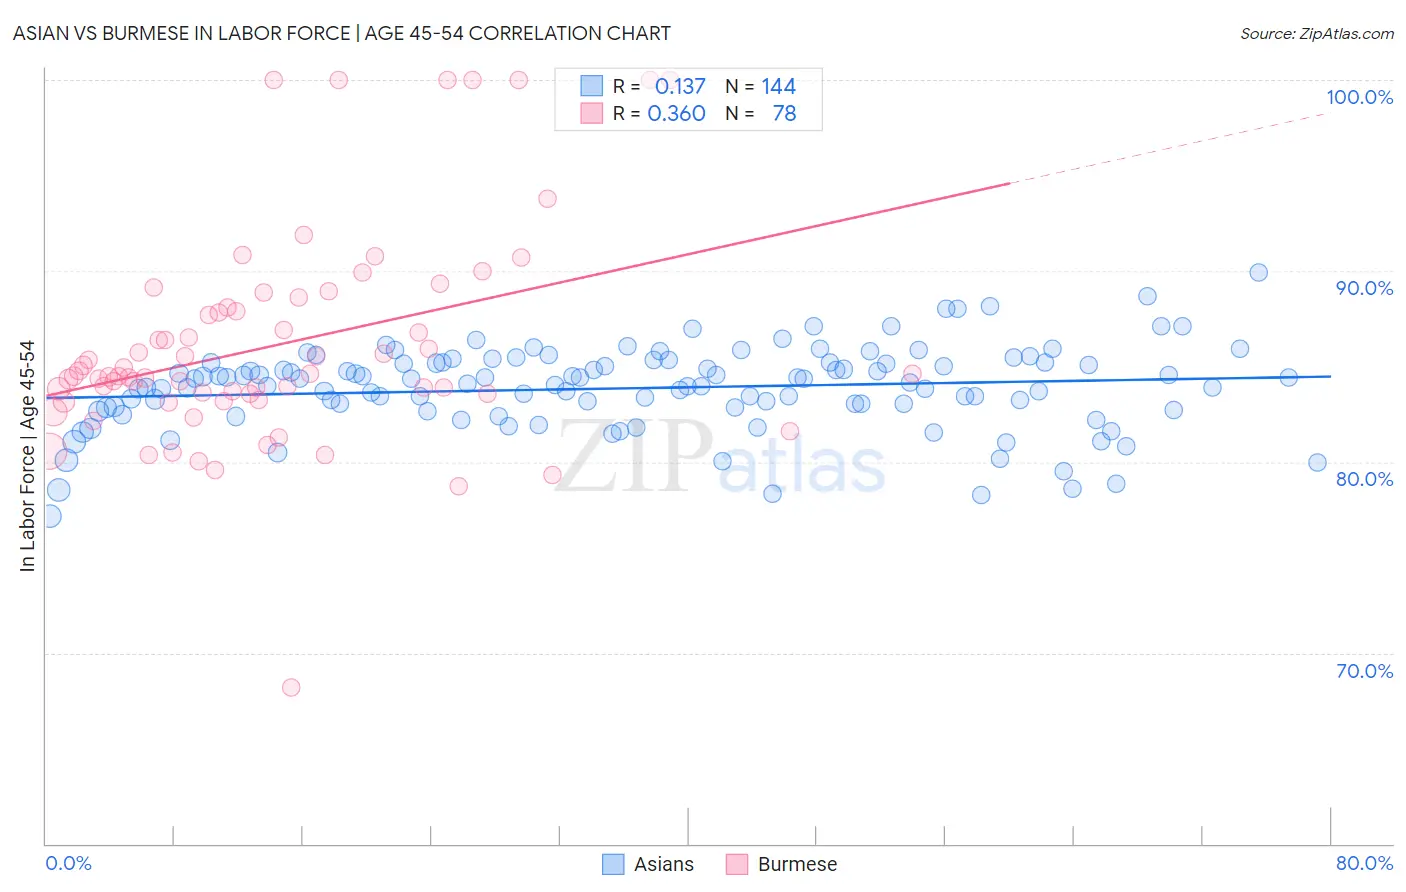
Asian vs Burmese In Labor Force | Age 45-54 Correlation Chart

The statistical analysis conducted on geographies consisting of 550,172,667 people shows a poor positive correlation between the proportion of Asians and labor force participation rate among population between the ages 45 and 54 in the United States with a correlation coefficient (R) of 0.137 and weighted average of 83.4%. Similarly, the statistical analysis conducted on geographies consisting of 464,867,064 people shows a mild positive correlation between the proportion of Burmese and labor force participation rate among population between the ages 45 and 54 in the United States with a correlation coefficient (R) of 0.360 and weighted average of 83.6%, a difference of 0.21%.
Asian vs Burmese In Labor Force | Age 45-54

In Labor Force | Age 45-54 Correlation Summary

MeasurementAsianBurmese
Minimum77.1%68.2%
Maximum89.9%100.0%
Range12.8%31.8%
Mean83.9%86.1%
Median84.1%84.5%
Interquartile 25% (IQ1)82.8%83.6%
Interquartile 75% (IQ3)85.2%88.1%
Interquartile Range (IQR)2.3%4.5%
Standard Deviation (Sample)2.2%5.7%
Standard Deviation (Population)2.2%5.6%

Similar Demographics by In Labor Force | Age 45-54

Demographics Similar to Asians by In Labor Force | Age 45-54

In terms of in labor force | age 45-54, the demographic groups most similar to Asians are Chilean (83.4%, a difference of 0.0%), Egyptian (83.5%, a difference of 0.010%), Afghan (83.5%, a difference of 0.020%), Immigrants from Kenya (83.5%, a difference of 0.020%), and Immigrants from Colombia (83.4%, a difference of 0.020%).
DemographicsRating | RankIn Labor Force | Age 45-54
Bhutanese
98.3
/100
|
#59
Exceptional
83.5%
Carpatho Rusyns
98.3
/100
|
#60
Exceptional
83.5%
Filipinos
98.3
/100
|
#61
Exceptional
83.5%
Immigrants | Taiwan
98.0
/100
|
#62
Exceptional
83.5%
Afghans
97.9
/100
|
#63
Exceptional
83.5%
Immigrants | Kenya
97.9
/100
|
#64
Exceptional
83.5%
Egyptians
97.9
/100
|
#65
Exceptional
83.5%
Asians
97.7
/100
|
#66
Exceptional
83.4%
Chileans
97.7
/100
|
#67
Exceptional
83.4%
Immigrants | Colombia
97.6
/100
|
#68
Exceptional
83.4%
Taiwanese
97.5
/100
|
#69
Exceptional
83.4%
Immigrants | Latvia
97.4
/100
|
#70
Exceptional
83.4%
Colombians
97.3
/100
|
#71
Exceptional
83.4%
Serbians
97.2
/100
|
#72
Exceptional
83.4%
Immigrants | Czechoslovakia
97.1
/100
|
#73
Exceptional
83.4%

Demographics Similar to Burmese by In Labor Force | Age 45-54

In terms of in labor force | age 45-54, the demographic groups most similar to Burmese are Immigrants from Hong Kong (83.6%, a difference of 0.0%), Lithuanian (83.6%, a difference of 0.010%), Venezuelan (83.6%, a difference of 0.020%), Croatian (83.6%, a difference of 0.030%), and Immigrants from Poland (83.6%, a difference of 0.030%).
DemographicsRating | RankIn Labor Force | Age 45-54
Swedes
99.4
/100
|
#37
Exceptional
83.7%
Immigrants | Venezuela
99.4
/100
|
#38
Exceptional
83.7%
Immigrants | Cuba
99.4
/100
|
#39
Exceptional
83.7%
Immigrants | Uganda
99.4
/100
|
#40
Exceptional
83.7%
Immigrants | Korea
99.3
/100
|
#41
Exceptional
83.7%
Immigrants | Moldova
99.3
/100
|
#42
Exceptional
83.7%
Venezuelans
99.2
/100
|
#43
Exceptional
83.6%
Burmese
99.1
/100
|
#44
Exceptional
83.6%
Immigrants | Hong Kong
99.1
/100
|
#45
Exceptional
83.6%
Lithuanians
99.1
/100
|
#46
Exceptional
83.6%
Croatians
99.0
/100
|
#47
Exceptional
83.6%
Immigrants | Poland
99.0
/100
|
#48
Exceptional
83.6%
Immigrants | Morocco
99.0
/100
|
#49
Exceptional
83.6%
Immigrants | Greece
98.8
/100
|
#50
Exceptional
83.6%
Immigrants | Turkey
98.8
/100
|
#51
Exceptional
83.6%