Armenian vs Immigrants from Congo Vision Disability
COMPARE
Armenian
Immigrants from Congo
Vision Disability
Vision Disability Comparison
Armenians
Immigrants from Congo
2.0%
VISION DISABILITY
99.0/ 100
METRIC RATING
63rd/ 347
METRIC RANK
2.3%
VISION DISABILITY
1.4/ 100
METRIC RATING
236th/ 347
METRIC RANK
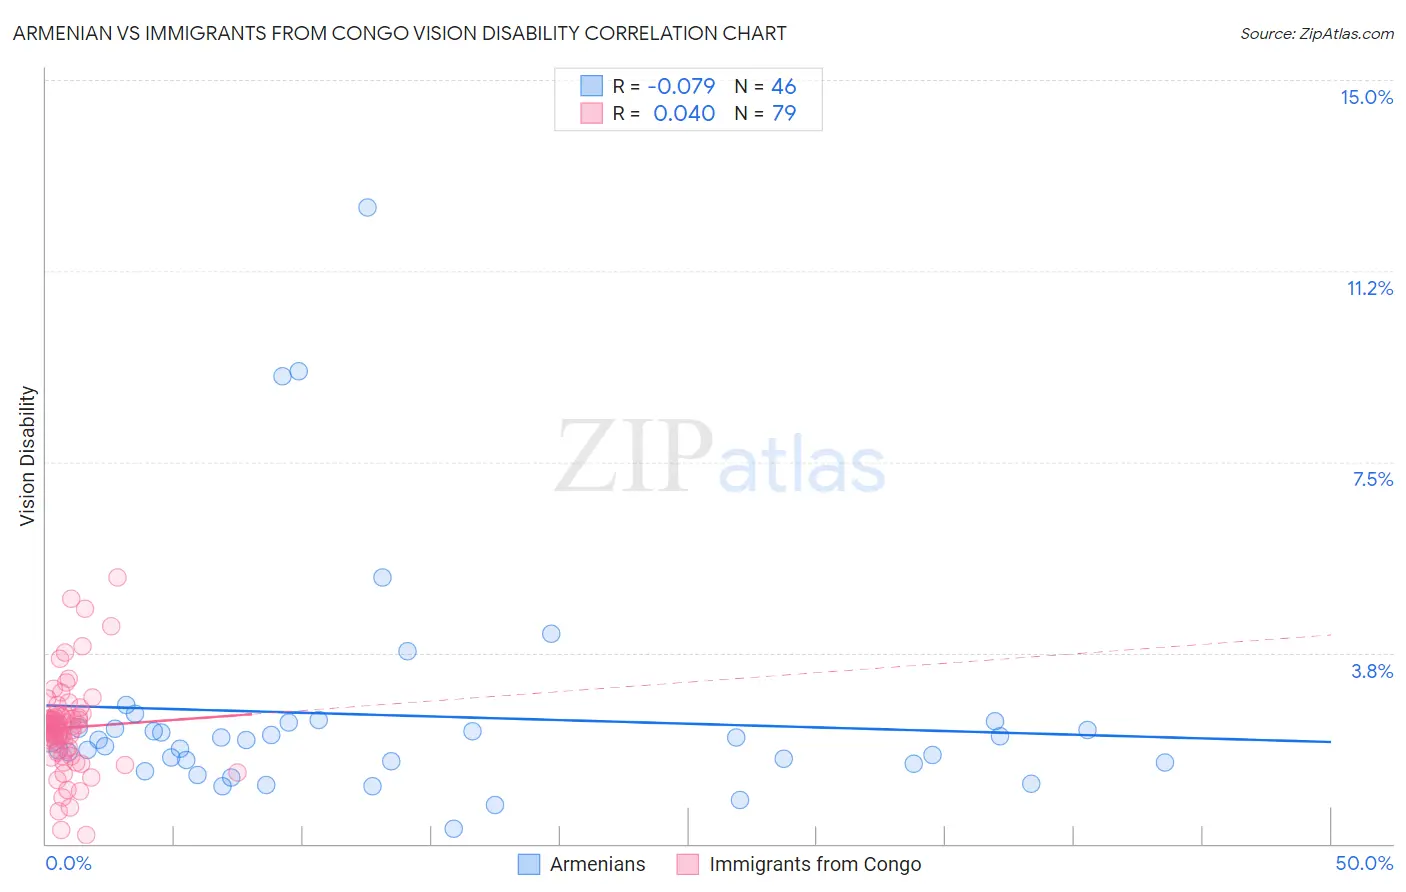
Armenian vs Immigrants from Congo Vision Disability Correlation Chart
The statistical analysis conducted on geographies consisting of 310,763,377 people shows a slight negative correlation between the proportion of Armenians and percentage of population with vision disability in the United States with a correlation coefficient (R) of -0.079 and weighted average of 2.0%. Similarly, the statistical analysis conducted on geographies consisting of 92,098,538 people shows no correlation between the proportion of Immigrants from Congo and percentage of population with vision disability in the United States with a correlation coefficient (R) of 0.040 and weighted average of 2.3%, a difference of 15.1%.
Vision Disability Correlation Summary
| Measurement | Armenian | Immigrants from Congo |
| Minimum | 0.29% | 0.17% |
| Maximum | 12.5% | 5.2% |
| Range | 12.2% | 5.1% |
| Mean | 2.5% | 2.3% |
| Median | 2.0% | 2.3% |
| Interquartile 25% (IQ1) | 1.6% | 1.8% |
| Interquartile 75% (IQ3) | 2.3% | 2.5% |
| Interquartile Range (IQR) | 0.68% | 0.67% |
| Standard Deviation (Sample) | 2.3% | 0.89% |
| Standard Deviation (Population) | 2.3% | 0.89% |
Similar Demographics by Vision Disability
Demographics Similar to Armenians by Vision Disability
In terms of vision disability, the demographic groups most similar to Armenians are Immigrants from Russia (2.0%, a difference of 0.11%), Immigrants from Belgium (2.0%, a difference of 0.13%), Immigrants from Greece (2.0%, a difference of 0.13%), Immigrants from Romania (2.0%, a difference of 0.15%), and Argentinean (2.0%, a difference of 0.17%).
| Demographics | Rating | Rank | Vision Disability |
| Jordanians | 99.2 /100 | #56 | Exceptional 2.0% |
| Somalis | 99.2 /100 | #57 | Exceptional 2.0% |
| Immigrants | Saudi Arabia | 99.2 /100 | #58 | Exceptional 2.0% |
| Argentineans | 99.1 /100 | #59 | Exceptional 2.0% |
| Immigrants | Romania | 99.1 /100 | #60 | Exceptional 2.0% |
| Immigrants | Belgium | 99.1 /100 | #61 | Exceptional 2.0% |
| Immigrants | Russia | 99.1 /100 | #62 | Exceptional 2.0% |
| Armenians | 99.0 /100 | #63 | Exceptional 2.0% |
| Immigrants | Greece | 99.0 /100 | #64 | Exceptional 2.0% |
| Maltese | 98.9 /100 | #65 | Exceptional 2.0% |
| Immigrants | Argentina | 98.9 /100 | #66 | Exceptional 2.0% |
| Immigrants | Northern Africa | 98.8 /100 | #67 | Exceptional 2.0% |
| Immigrants | Czechoslovakia | 98.7 /100 | #68 | Exceptional 2.0% |
| Russians | 98.6 /100 | #69 | Exceptional 2.0% |
| Immigrants | Kazakhstan | 98.6 /100 | #70 | Exceptional 2.0% |
Demographics Similar to Immigrants from Congo by Vision Disability
In terms of vision disability, the demographic groups most similar to Immigrants from Congo are Immigrants from Portugal (2.3%, a difference of 0.050%), Marshallese (2.3%, a difference of 0.090%), Scottish (2.3%, a difference of 0.16%), Immigrants from Cambodia (2.3%, a difference of 0.32%), and Central American (2.3%, a difference of 0.34%).
| Demographics | Rating | Rank | Vision Disability |
| Welsh | 2.3 /100 | #229 | Tragic 2.3% |
| Nicaraguans | 2.2 /100 | #230 | Tragic 2.3% |
| Immigrants | Ecuador | 2.0 /100 | #231 | Tragic 2.3% |
| German Russians | 1.8 /100 | #232 | Tragic 2.3% |
| Central Americans | 1.8 /100 | #233 | Tragic 2.3% |
| Scottish | 1.6 /100 | #234 | Tragic 2.3% |
| Marshallese | 1.5 /100 | #235 | Tragic 2.3% |
| Immigrants | Congo | 1.4 /100 | #236 | Tragic 2.3% |
| Immigrants | Portugal | 1.4 /100 | #237 | Tragic 2.3% |
| Immigrants | Cambodia | 1.1 /100 | #238 | Tragic 2.3% |
| English | 1.1 /100 | #239 | Tragic 2.3% |
| Panamanians | 0.9 /100 | #240 | Tragic 2.3% |
| Malaysians | 0.9 /100 | #241 | Tragic 2.3% |
| Immigrants | Panama | 0.8 /100 | #242 | Tragic 2.3% |
| Immigrants | Nicaragua | 0.6 /100 | #243 | Tragic 2.3% |