Armenian vs Immigrants from Congo Child Poverty Under the Age of 16
COMPARE
Armenian
Immigrants from Congo
Child Poverty Under the Age of 16
Child Poverty Under the Age of 16 Comparison
Armenians
Immigrants from Congo
15.2%
CHILD POVERTY UNDER THE AGE OF 16
89.4/ 100
METRIC RATING
131st/ 347
METRIC RANK
22.5%
CHILD POVERTY UNDER THE AGE OF 16
0.0/ 100
METRIC RATING
325th/ 347
METRIC RANK
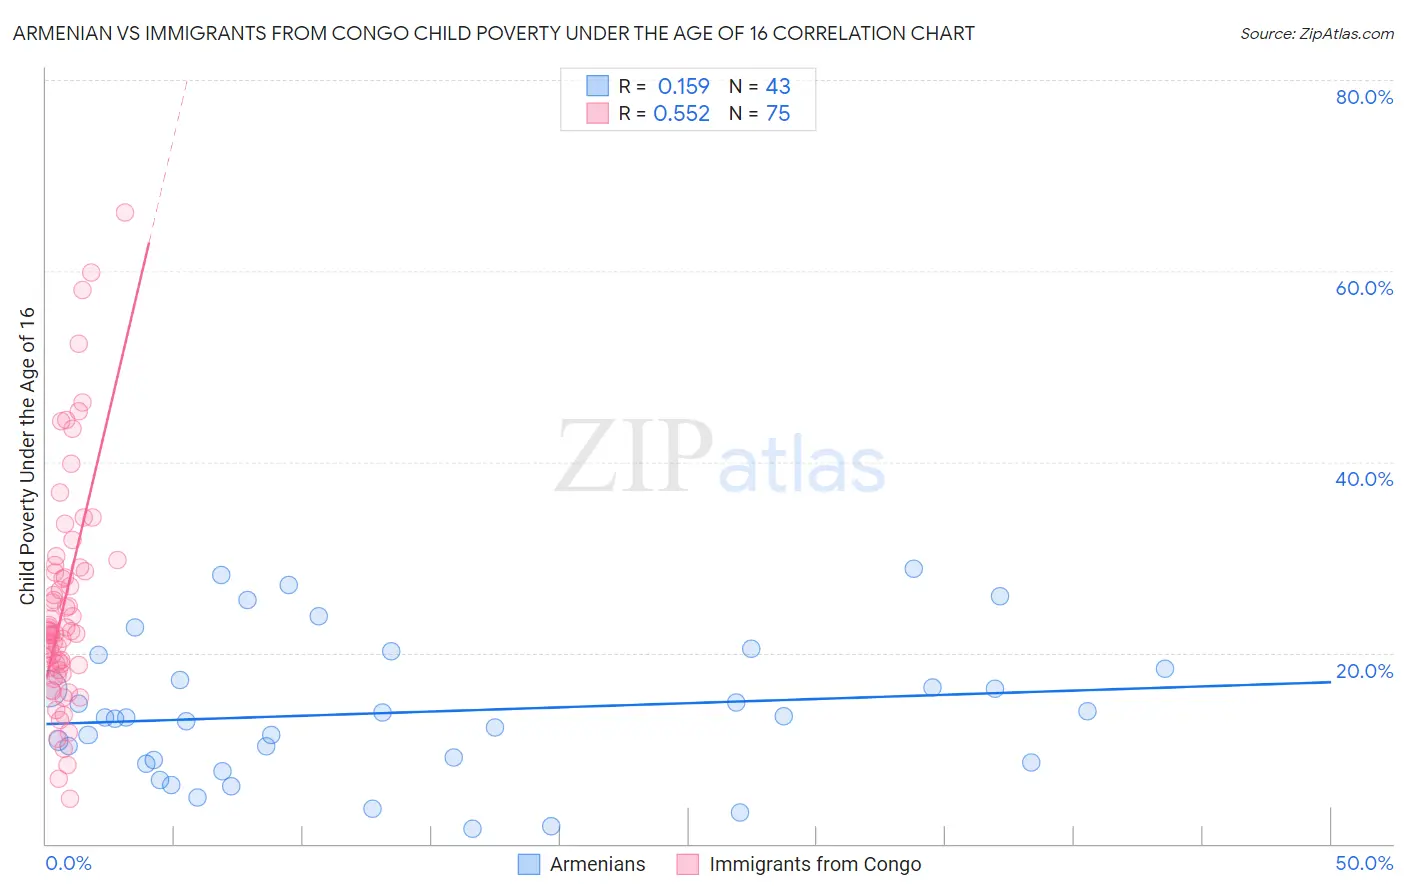
Armenian vs Immigrants from Congo Child Poverty Under the Age of 16 Correlation Chart
The statistical analysis conducted on geographies consisting of 307,876,845 people shows a poor positive correlation between the proportion of Armenians and poverty level among children under the age of 16 in the United States with a correlation coefficient (R) of 0.159 and weighted average of 15.2%. Similarly, the statistical analysis conducted on geographies consisting of 92,037,076 people shows a substantial positive correlation between the proportion of Immigrants from Congo and poverty level among children under the age of 16 in the United States with a correlation coefficient (R) of 0.552 and weighted average of 22.5%, a difference of 48.5%.
Child Poverty Under the Age of 16 Correlation Summary
| Measurement | Armenian | Immigrants from Congo |
| Minimum | 1.5% | 4.7% |
| Maximum | 28.8% | 66.1% |
| Range | 27.3% | 61.5% |
| Mean | 13.8% | 25.3% |
| Median | 13.2% | 22.2% |
| Interquartile 25% (IQ1) | 8.6% | 18.5% |
| Interquartile 75% (IQ3) | 18.3% | 28.9% |
| Interquartile Range (IQR) | 9.8% | 10.4% |
| Standard Deviation (Sample) | 7.2% | 12.0% |
| Standard Deviation (Population) | 7.2% | 11.9% |
Similar Demographics by Child Poverty Under the Age of 16
Demographics Similar to Armenians by Child Poverty Under the Age of 16
In terms of child poverty under the age of 16, the demographic groups most similar to Armenians are Mongolian (15.2%, a difference of 0.030%), Canadian (15.2%, a difference of 0.090%), Immigrants from Southern Europe (15.1%, a difference of 0.12%), Immigrants from South Eastern Asia (15.2%, a difference of 0.14%), and Native Hawaiian (15.2%, a difference of 0.23%).
| Demographics | Rating | Rank | Child Poverty Under the Age of 16 |
| Czechoslovakians | 91.0 /100 | #124 | Exceptional 15.1% |
| Palestinians | 90.9 /100 | #125 | Exceptional 15.1% |
| Portuguese | 90.6 /100 | #126 | Exceptional 15.1% |
| Immigrants | Western Europe | 90.3 /100 | #127 | Exceptional 15.1% |
| Immigrants | Kazakhstan | 90.2 /100 | #128 | Exceptional 15.1% |
| Immigrants | Southern Europe | 89.7 /100 | #129 | Excellent 15.1% |
| Mongolians | 89.5 /100 | #130 | Excellent 15.2% |
| Armenians | 89.4 /100 | #131 | Excellent 15.2% |
| Canadians | 89.1 /100 | #132 | Excellent 15.2% |
| Immigrants | South Eastern Asia | 89.0 /100 | #133 | Excellent 15.2% |
| Native Hawaiians | 88.7 /100 | #134 | Excellent 15.2% |
| Albanians | 88.6 /100 | #135 | Excellent 15.2% |
| Immigrants | Spain | 87.3 /100 | #136 | Excellent 15.3% |
| Peruvians | 87.2 /100 | #137 | Excellent 15.3% |
| Welsh | 87.2 /100 | #138 | Excellent 15.3% |
Demographics Similar to Immigrants from Congo by Child Poverty Under the Age of 16
In terms of child poverty under the age of 16, the demographic groups most similar to Immigrants from Congo are Central American Indian (22.5%, a difference of 0.14%), Paiute (22.4%, a difference of 0.45%), Immigrants from Honduras (22.7%, a difference of 0.81%), Honduran (22.2%, a difference of 1.5%), and Kiowa (22.2%, a difference of 1.7%).
| Demographics | Rating | Rank | Child Poverty Under the Age of 16 |
| U.S. Virgin Islanders | 0.0 /100 | #318 | Tragic 22.0% |
| Yakama | 0.0 /100 | #319 | Tragic 22.1% |
| Cajuns | 0.0 /100 | #320 | Tragic 22.1% |
| Kiowa | 0.0 /100 | #321 | Tragic 22.2% |
| Hondurans | 0.0 /100 | #322 | Tragic 22.2% |
| Paiute | 0.0 /100 | #323 | Tragic 22.4% |
| Central American Indians | 0.0 /100 | #324 | Tragic 22.5% |
| Immigrants | Congo | 0.0 /100 | #325 | Tragic 22.5% |
| Immigrants | Honduras | 0.0 /100 | #326 | Tragic 22.7% |
| Menominee | 0.0 /100 | #327 | Tragic 23.0% |
| Colville | 0.0 /100 | #328 | Tragic 23.0% |
| Dominicans | 0.0 /100 | #329 | Tragic 23.8% |
| Natives/Alaskans | 0.0 /100 | #330 | Tragic 23.8% |
| Apache | 0.0 /100 | #331 | Tragic 23.8% |
| Pueblo | 0.0 /100 | #332 | Tragic 23.9% |