Immigrants from Middle Africa vs Immigrants from Congo Vision Disability
COMPARE
Immigrants from Middle Africa
Immigrants from Congo
Vision Disability
Vision Disability Comparison
Immigrants from Middle Africa
Immigrants from Congo
2.2%
VISION DISABILITY
33.5/ 100
METRIC RATING
185th/ 347
METRIC RANK
2.3%
VISION DISABILITY
1.4/ 100
METRIC RATING
236th/ 347
METRIC RANK
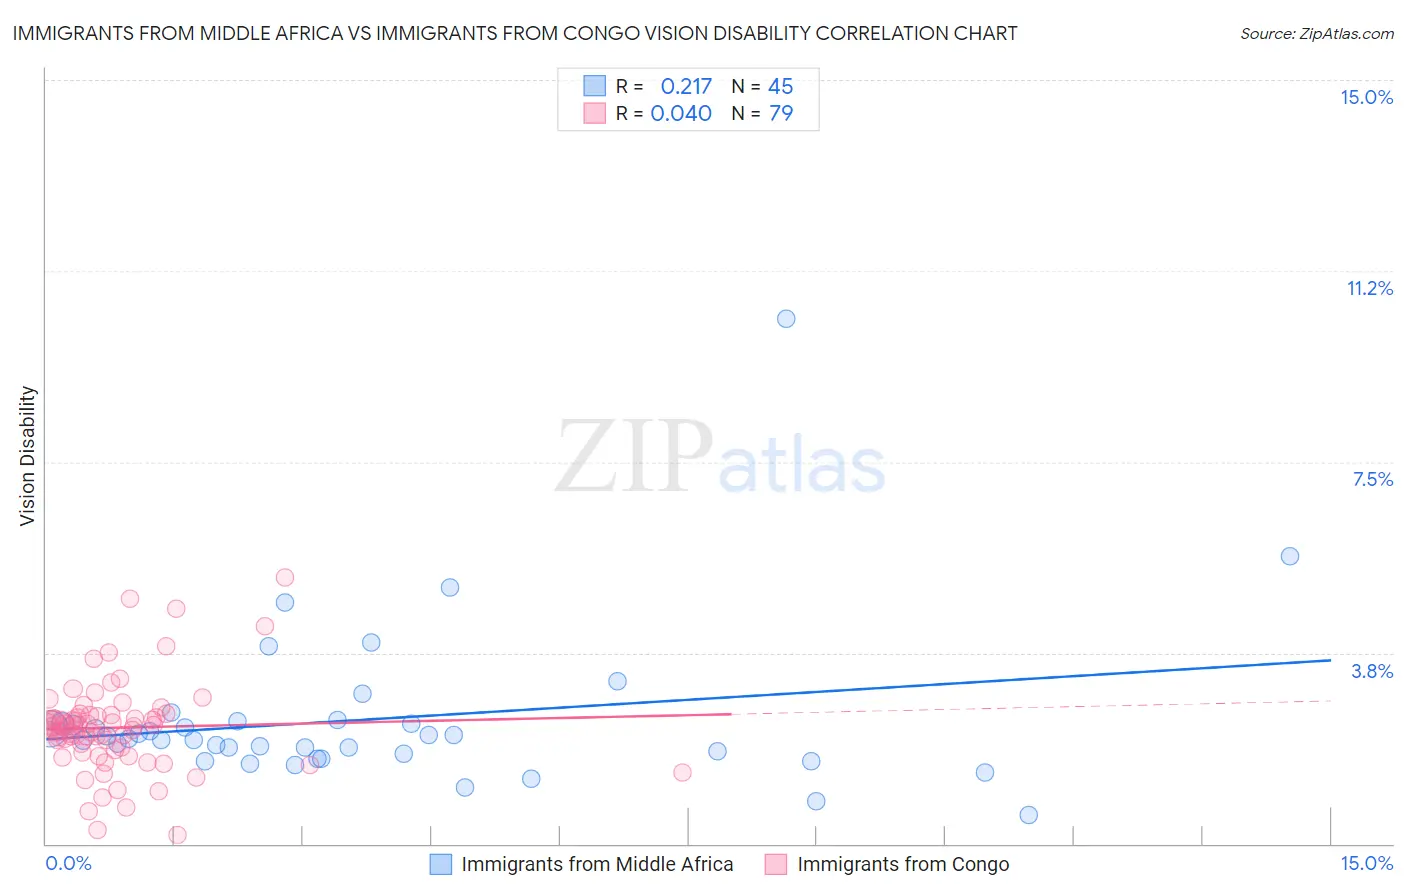
Immigrants from Middle Africa vs Immigrants from Congo Vision Disability Correlation Chart
The statistical analysis conducted on geographies consisting of 202,642,272 people shows a weak positive correlation between the proportion of Immigrants from Middle Africa and percentage of population with vision disability in the United States with a correlation coefficient (R) of 0.217 and weighted average of 2.2%. Similarly, the statistical analysis conducted on geographies consisting of 92,098,538 people shows no correlation between the proportion of Immigrants from Congo and percentage of population with vision disability in the United States with a correlation coefficient (R) of 0.040 and weighted average of 2.3%, a difference of 5.6%.
Vision Disability Correlation Summary
| Measurement | Immigrants from Middle Africa | Immigrants from Congo |
| Minimum | 0.56% | 0.17% |
| Maximum | 10.3% | 5.2% |
| Range | 9.7% | 5.1% |
| Mean | 2.4% | 2.3% |
| Median | 2.1% | 2.3% |
| Interquartile 25% (IQ1) | 1.7% | 1.8% |
| Interquartile 75% (IQ3) | 2.4% | 2.5% |
| Interquartile Range (IQR) | 0.66% | 0.67% |
| Standard Deviation (Sample) | 1.6% | 0.89% |
| Standard Deviation (Population) | 1.5% | 0.89% |
Similar Demographics by Vision Disability
Demographics Similar to Immigrants from Middle Africa by Vision Disability
In terms of vision disability, the demographic groups most similar to Immigrants from Middle Africa are Native Hawaiian (2.2%, a difference of 0.020%), Moroccan (2.2%, a difference of 0.13%), Immigrants from St. Vincent and the Grenadines (2.2%, a difference of 0.23%), Immigrants from Burma/Myanmar (2.2%, a difference of 0.30%), and Guyanese (2.2%, a difference of 0.34%).
| Demographics | Rating | Rank | Vision Disability |
| Immigrants | Oceania | 45.1 /100 | #178 | Average 2.2% |
| Immigrants | North America | 44.5 /100 | #179 | Average 2.2% |
| Uruguayans | 42.7 /100 | #180 | Average 2.2% |
| Immigrants | Western Europe | 41.1 /100 | #181 | Average 2.2% |
| Costa Ricans | 40.7 /100 | #182 | Average 2.2% |
| Immigrants | Burma/Myanmar | 37.9 /100 | #183 | Fair 2.2% |
| Moroccans | 35.4 /100 | #184 | Fair 2.2% |
| Immigrants | Middle Africa | 33.5 /100 | #185 | Fair 2.2% |
| Native Hawaiians | 33.3 /100 | #186 | Fair 2.2% |
| Immigrants | St. Vincent and the Grenadines | 30.3 /100 | #187 | Fair 2.2% |
| Guyanese | 28.9 /100 | #188 | Fair 2.2% |
| Salvadorans | 27.4 /100 | #189 | Fair 2.2% |
| Immigrants | Costa Rica | 26.1 /100 | #190 | Fair 2.2% |
| Canadians | 25.8 /100 | #191 | Fair 2.2% |
| Europeans | 25.7 /100 | #192 | Fair 2.2% |
Demographics Similar to Immigrants from Congo by Vision Disability
In terms of vision disability, the demographic groups most similar to Immigrants from Congo are Immigrants from Portugal (2.3%, a difference of 0.050%), Marshallese (2.3%, a difference of 0.090%), Scottish (2.3%, a difference of 0.16%), Immigrants from Cambodia (2.3%, a difference of 0.32%), and Central American (2.3%, a difference of 0.34%).
| Demographics | Rating | Rank | Vision Disability |
| Welsh | 2.3 /100 | #229 | Tragic 2.3% |
| Nicaraguans | 2.2 /100 | #230 | Tragic 2.3% |
| Immigrants | Ecuador | 2.0 /100 | #231 | Tragic 2.3% |
| German Russians | 1.8 /100 | #232 | Tragic 2.3% |
| Central Americans | 1.8 /100 | #233 | Tragic 2.3% |
| Scottish | 1.6 /100 | #234 | Tragic 2.3% |
| Marshallese | 1.5 /100 | #235 | Tragic 2.3% |
| Immigrants | Congo | 1.4 /100 | #236 | Tragic 2.3% |
| Immigrants | Portugal | 1.4 /100 | #237 | Tragic 2.3% |
| Immigrants | Cambodia | 1.1 /100 | #238 | Tragic 2.3% |
| English | 1.1 /100 | #239 | Tragic 2.3% |
| Panamanians | 0.9 /100 | #240 | Tragic 2.3% |
| Malaysians | 0.9 /100 | #241 | Tragic 2.3% |
| Immigrants | Panama | 0.8 /100 | #242 | Tragic 2.3% |
| Immigrants | Nicaragua | 0.6 /100 | #243 | Tragic 2.3% |