Armenian vs Comanche 10th Grade
COMPARE
Armenian
Comanche
10th Grade
10th Grade Comparison
Armenians
Comanche
92.7%
10TH GRADE
0.9/ 100
METRIC RATING
254th/ 347
METRIC RANK
93.1%
10TH GRADE
4.9/ 100
METRIC RATING
233rd/ 347
METRIC RANK
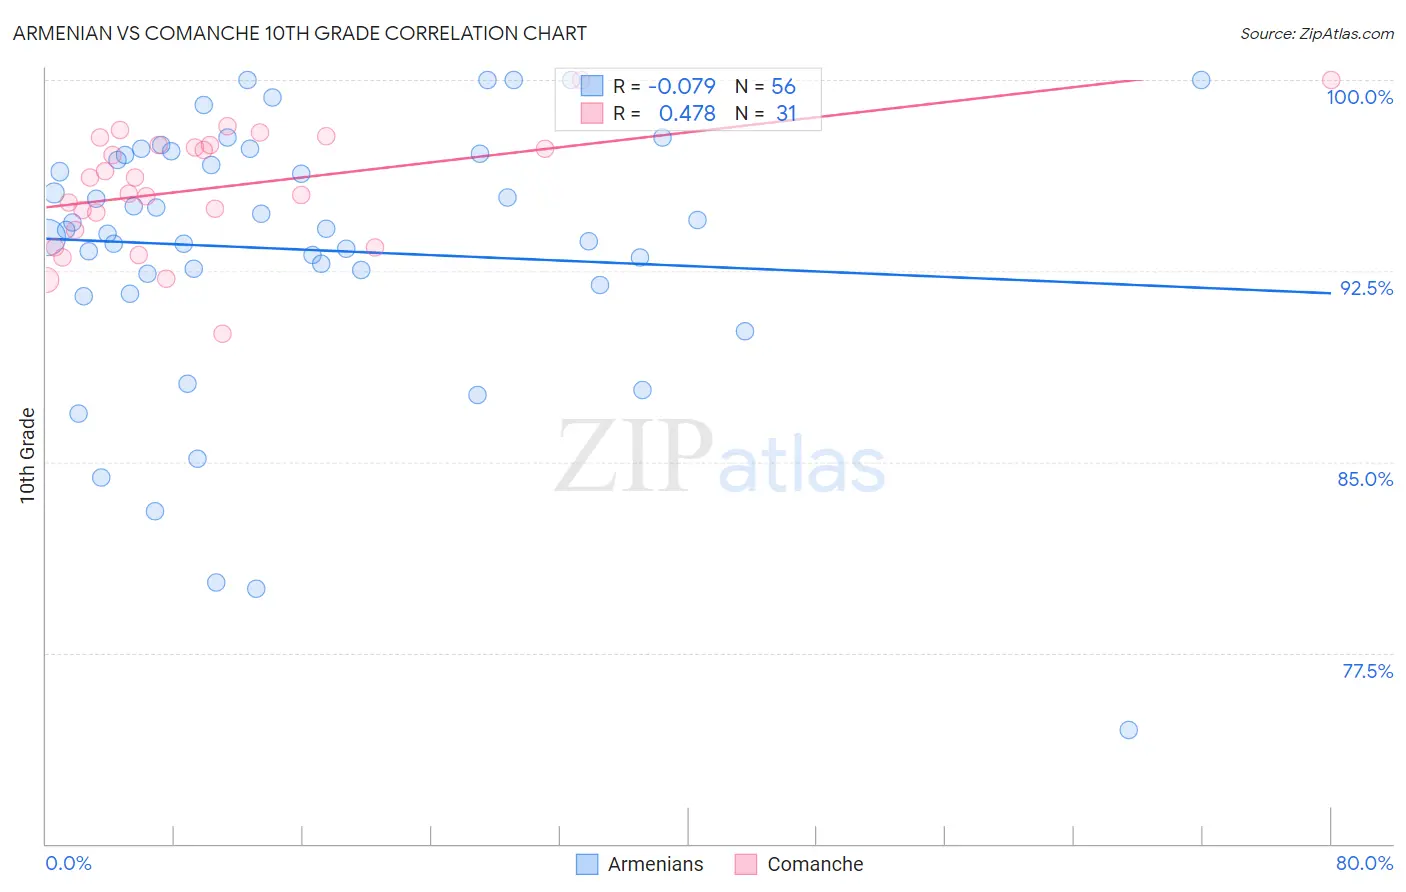
Armenian vs Comanche 10th Grade Correlation Chart
The statistical analysis conducted on geographies consisting of 310,954,685 people shows a slight negative correlation between the proportion of Armenians and percentage of population with at least 10th grade education in the United States with a correlation coefficient (R) of -0.079 and weighted average of 92.7%. Similarly, the statistical analysis conducted on geographies consisting of 109,786,530 people shows a moderate positive correlation between the proportion of Comanche and percentage of population with at least 10th grade education in the United States with a correlation coefficient (R) of 0.478 and weighted average of 93.1%, a difference of 0.40%.
10th Grade Correlation Summary
| Measurement | Armenian | Comanche |
| Minimum | 74.5% | 90.1% |
| Maximum | 100.0% | 100.0% |
| Range | 25.5% | 9.9% |
| Mean | 93.3% | 95.8% |
| Median | 94.1% | 96.1% |
| Interquartile 25% (IQ1) | 92.2% | 94.1% |
| Interquartile 75% (IQ3) | 97.1% | 97.4% |
| Interquartile Range (IQR) | 4.9% | 3.3% |
| Standard Deviation (Sample) | 5.4% | 2.3% |
| Standard Deviation (Population) | 5.3% | 2.3% |
Similar Demographics by 10th Grade
Demographics Similar to Armenians by 10th Grade
In terms of 10th grade, the demographic groups most similar to Armenians are South American (92.8%, a difference of 0.010%), Ghanaian (92.8%, a difference of 0.010%), Immigrants from Thailand (92.8%, a difference of 0.020%), Immigrants from Bolivia (92.7%, a difference of 0.050%), and Immigrants from Nigeria (92.7%, a difference of 0.060%).
| Demographics | Rating | Rank | 10th Grade |
| Immigrants | Afghanistan | 1.4 /100 | #247 | Tragic 92.8% |
| Colombians | 1.4 /100 | #248 | Tragic 92.8% |
| Immigrants | Senegal | 1.4 /100 | #249 | Tragic 92.8% |
| Jamaicans | 1.2 /100 | #250 | Tragic 92.8% |
| Immigrants | Thailand | 1.0 /100 | #251 | Tragic 92.8% |
| South Americans | 0.9 /100 | #252 | Tragic 92.8% |
| Ghanaians | 0.9 /100 | #253 | Tragic 92.8% |
| Armenians | 0.9 /100 | #254 | Tragic 92.7% |
| Immigrants | Bolivia | 0.7 /100 | #255 | Tragic 92.7% |
| Immigrants | Nigeria | 0.7 /100 | #256 | Tragic 92.7% |
| U.S. Virgin Islanders | 0.7 /100 | #257 | Tragic 92.7% |
| Immigrants | Costa Rica | 0.6 /100 | #258 | Tragic 92.7% |
| Immigrants | Jamaica | 0.5 /100 | #259 | Tragic 92.6% |
| Immigrants | Uzbekistan | 0.5 /100 | #260 | Tragic 92.6% |
| Paiute | 0.4 /100 | #261 | Tragic 92.6% |
Demographics Similar to Comanche by 10th Grade
In terms of 10th grade, the demographic groups most similar to Comanche are South American Indian (93.1%, a difference of 0.0%), Bahamian (93.1%, a difference of 0.0%), Immigrants from Ethiopia (93.1%, a difference of 0.010%), Immigrants from Africa (93.1%, a difference of 0.010%), and Subsaharan African (93.1%, a difference of 0.010%).
| Demographics | Rating | Rank | 10th Grade |
| Koreans | 6.1 /100 | #226 | Tragic 93.2% |
| Blacks/African Americans | 6.0 /100 | #227 | Tragic 93.2% |
| Immigrants | China | 5.9 /100 | #228 | Tragic 93.2% |
| Immigrants | Ethiopia | 5.1 /100 | #229 | Tragic 93.1% |
| Immigrants | Africa | 5.0 /100 | #230 | Tragic 93.1% |
| South American Indians | 4.9 /100 | #231 | Tragic 93.1% |
| Bahamians | 4.9 /100 | #232 | Tragic 93.1% |
| Comanche | 4.9 /100 | #233 | Tragic 93.1% |
| Sub-Saharan Africans | 4.7 /100 | #234 | Tragic 93.1% |
| Africans | 4.6 /100 | #235 | Tragic 93.1% |
| Afghans | 4.5 /100 | #236 | Tragic 93.1% |
| Immigrants | Panama | 4.3 /100 | #237 | Tragic 93.1% |
| Nigerians | 4.2 /100 | #238 | Tragic 93.1% |
| Costa Ricans | 4.2 /100 | #239 | Tragic 93.1% |
| Immigrants | Hong Kong | 4.2 /100 | #240 | Tragic 93.1% |