Immigrants from Afghanistan vs Barbadian Vision Disability
COMPARE
Immigrants from Afghanistan
Barbadian
Vision Disability
Vision Disability Comparison
Immigrants from Afghanistan
Barbadians
2.1%
VISION DISABILITY
95.6/ 100
METRIC RATING
97th/ 347
METRIC RANK
2.3%
VISION DISABILITY
5.1/ 100
METRIC RATING
217th/ 347
METRIC RANK
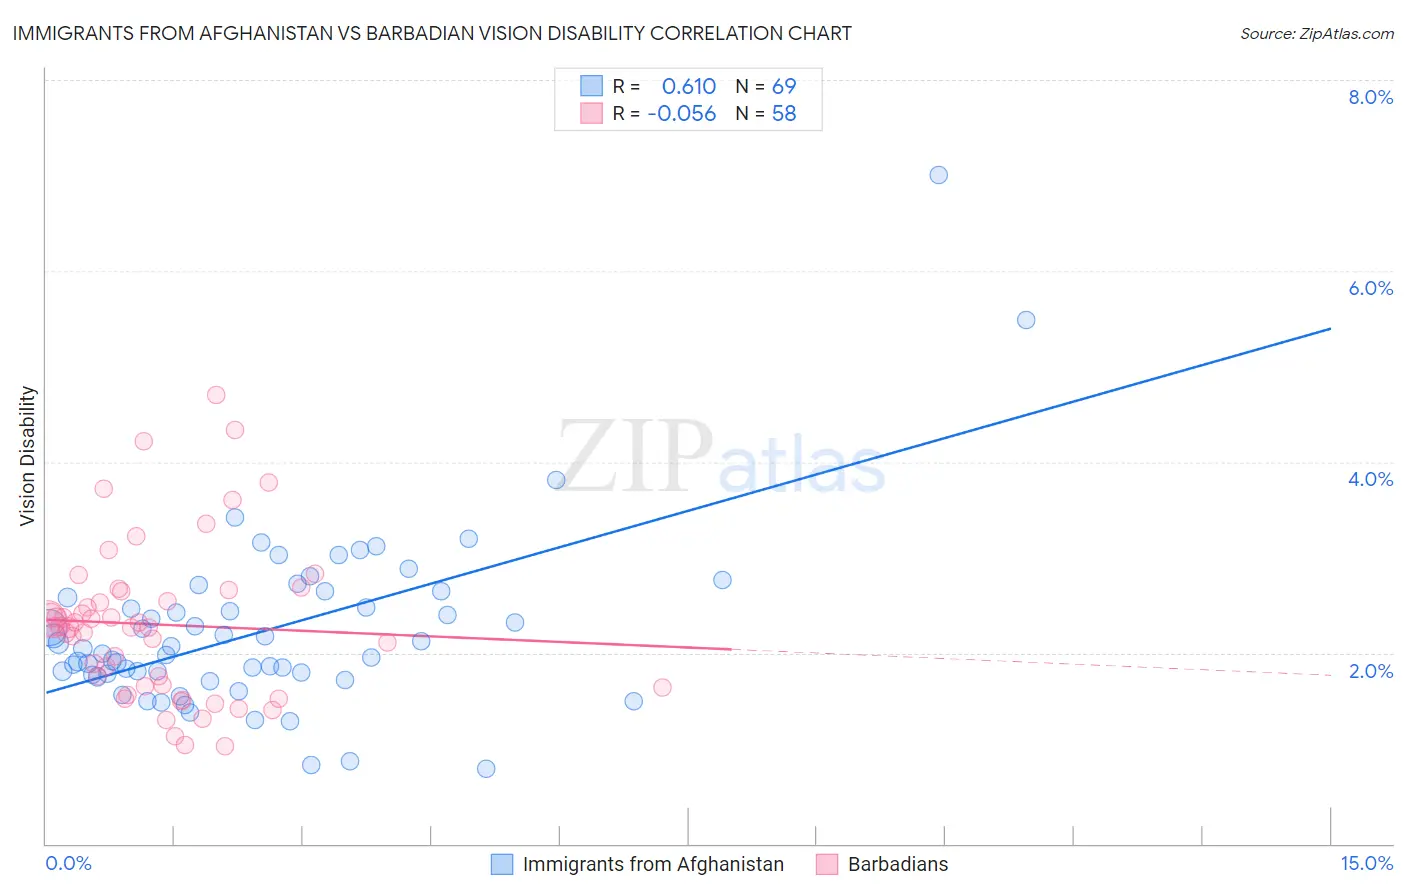
Immigrants from Afghanistan vs Barbadian Vision Disability Correlation Chart
The statistical analysis conducted on geographies consisting of 147,616,042 people shows a significant positive correlation between the proportion of Immigrants from Afghanistan and percentage of population with vision disability in the United States with a correlation coefficient (R) of 0.610 and weighted average of 2.1%. Similarly, the statistical analysis conducted on geographies consisting of 141,266,636 people shows a slight negative correlation between the proportion of Barbadians and percentage of population with vision disability in the United States with a correlation coefficient (R) of -0.056 and weighted average of 2.3%, a difference of 9.9%.
Vision Disability Correlation Summary
| Measurement | Immigrants from Afghanistan | Barbadian |
| Minimum | 0.79% | 1.0% |
| Maximum | 7.0% | 4.7% |
| Range | 6.2% | 3.7% |
| Mean | 2.2% | 2.3% |
| Median | 2.0% | 2.3% |
| Interquartile 25% (IQ1) | 1.8% | 1.6% |
| Interquartile 75% (IQ3) | 2.6% | 2.6% |
| Interquartile Range (IQR) | 0.84% | 1.0% |
| Standard Deviation (Sample) | 0.93% | 0.81% |
| Standard Deviation (Population) | 0.93% | 0.81% |
Similar Demographics by Vision Disability
Demographics Similar to Immigrants from Afghanistan by Vision Disability
In terms of vision disability, the demographic groups most similar to Immigrants from Afghanistan are Immigrants from South Africa (2.1%, a difference of 0.050%), Romanian (2.1%, a difference of 0.070%), Estonian (2.1%, a difference of 0.12%), Australian (2.1%, a difference of 0.13%), and Greek (2.1%, a difference of 0.16%).
| Demographics | Rating | Rank | Vision Disability |
| Immigrants | Lebanon | 96.7 /100 | #90 | Exceptional 2.1% |
| Immigrants | Somalia | 96.2 /100 | #91 | Exceptional 2.1% |
| Immigrants | Syria | 96.2 /100 | #92 | Exceptional 2.1% |
| Immigrants | Europe | 96.1 /100 | #93 | Exceptional 2.1% |
| Immigrants | Croatia | 96.0 /100 | #94 | Exceptional 2.1% |
| Australians | 95.9 /100 | #95 | Exceptional 2.1% |
| Romanians | 95.7 /100 | #96 | Exceptional 2.1% |
| Immigrants | Afghanistan | 95.6 /100 | #97 | Exceptional 2.1% |
| Immigrants | South Africa | 95.4 /100 | #98 | Exceptional 2.1% |
| Estonians | 95.3 /100 | #99 | Exceptional 2.1% |
| Greeks | 95.1 /100 | #100 | Exceptional 2.1% |
| Albanians | 94.9 /100 | #101 | Exceptional 2.1% |
| Sri Lankans | 94.8 /100 | #102 | Exceptional 2.1% |
| Immigrants | Austria | 94.4 /100 | #103 | Exceptional 2.1% |
| Immigrants | Italy | 94.4 /100 | #104 | Exceptional 2.1% |
Demographics Similar to Barbadians by Vision Disability
In terms of vision disability, the demographic groups most similar to Barbadians are Portuguese (2.3%, a difference of 0.070%), Ecuadorian (2.3%, a difference of 0.17%), Immigrants from Trinidad and Tobago (2.3%, a difference of 0.28%), Guamanian/Chamorro (2.3%, a difference of 0.41%), and French Canadian (2.3%, a difference of 0.43%).
| Demographics | Rating | Rank | Vision Disability |
| Immigrants | Uruguay | 11.5 /100 | #210 | Poor 2.2% |
| Indonesians | 9.5 /100 | #211 | Tragic 2.2% |
| Bermudans | 9.0 /100 | #212 | Tragic 2.2% |
| Immigrants | Ghana | 8.9 /100 | #213 | Tragic 2.2% |
| Trinidadians and Tobagonians | 8.2 /100 | #214 | Tragic 2.2% |
| Nigerians | 7.2 /100 | #215 | Tragic 2.3% |
| Immigrants | Trinidad and Tobago | 6.1 /100 | #216 | Tragic 2.3% |
| Barbadians | 5.1 /100 | #217 | Tragic 2.3% |
| Portuguese | 4.9 /100 | #218 | Tragic 2.3% |
| Ecuadorians | 4.6 /100 | #219 | Tragic 2.3% |
| Guamanians/Chamorros | 3.9 /100 | #220 | Tragic 2.3% |
| French Canadians | 3.9 /100 | #221 | Tragic 2.3% |
| Immigrants | Senegal | 3.8 /100 | #222 | Tragic 2.3% |
| Basques | 3.5 /100 | #223 | Tragic 2.3% |
| Irish | 3.4 /100 | #224 | Tragic 2.3% |