Tohono O'odham vs Barbadian Vision Disability
COMPARE
Tohono O'odham
Barbadian
Vision Disability
Vision Disability Comparison
Tohono O'odham
Barbadians
2.8%
VISION DISABILITY
0.0/ 100
METRIC RATING
319th/ 347
METRIC RANK
2.3%
VISION DISABILITY
5.1/ 100
METRIC RATING
217th/ 347
METRIC RANK
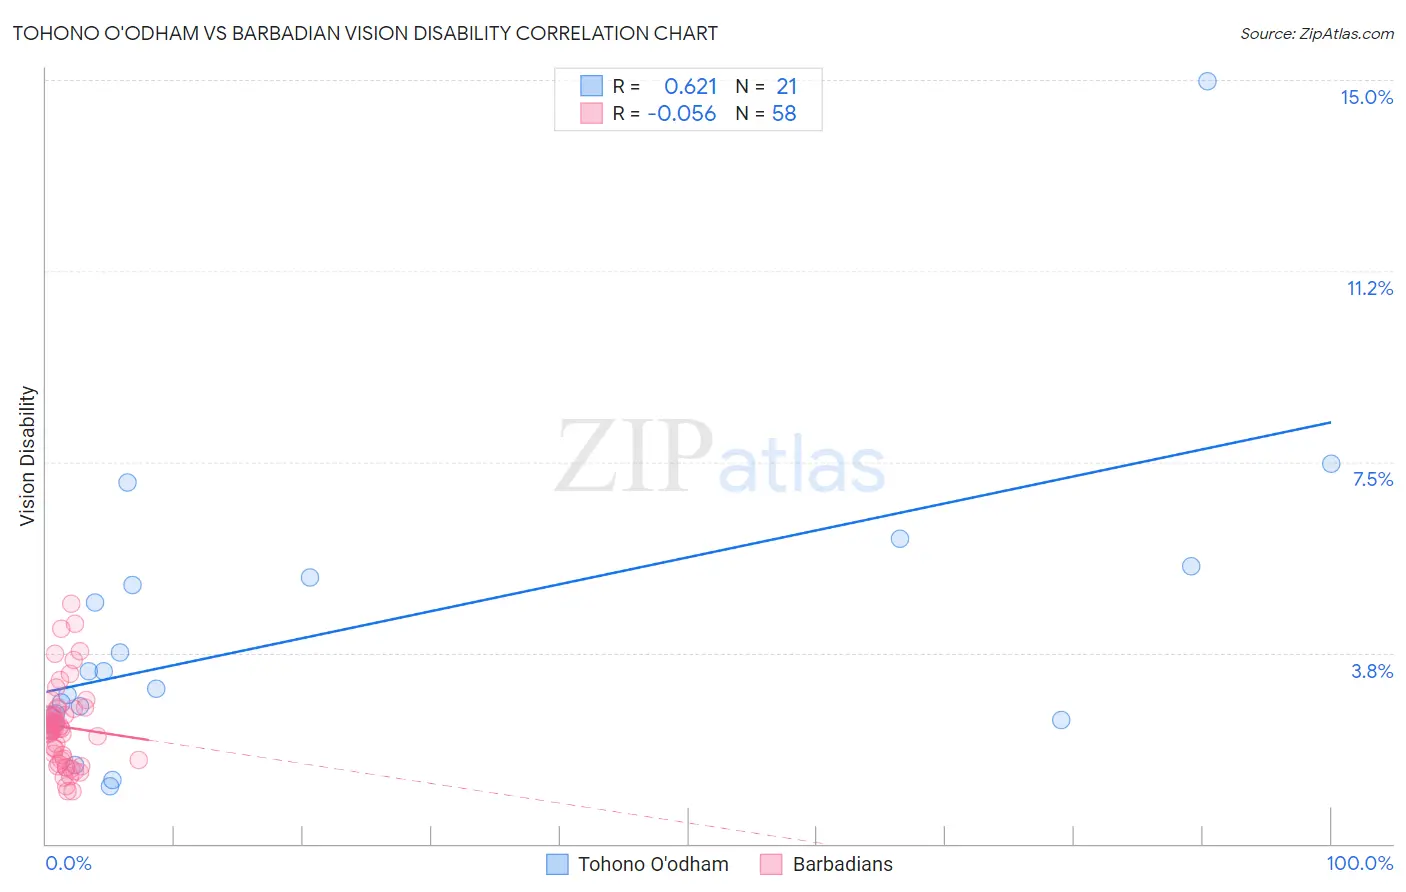
Tohono O'odham vs Barbadian Vision Disability Correlation Chart
The statistical analysis conducted on geographies consisting of 58,710,192 people shows a significant positive correlation between the proportion of Tohono O'odham and percentage of population with vision disability in the United States with a correlation coefficient (R) of 0.621 and weighted average of 2.8%. Similarly, the statistical analysis conducted on geographies consisting of 141,266,636 people shows a slight negative correlation between the proportion of Barbadians and percentage of population with vision disability in the United States with a correlation coefficient (R) of -0.056 and weighted average of 2.3%, a difference of 22.1%.
Vision Disability Correlation Summary
| Measurement | Tohono O'odham | Barbadian |
| Minimum | 1.1% | 1.0% |
| Maximum | 15.0% | 4.7% |
| Range | 13.8% | 3.7% |
| Mean | 4.2% | 2.3% |
| Median | 3.4% | 2.3% |
| Interquartile 25% (IQ1) | 2.5% | 1.6% |
| Interquartile 75% (IQ3) | 5.3% | 2.6% |
| Interquartile Range (IQR) | 2.8% | 1.0% |
| Standard Deviation (Sample) | 3.0% | 0.81% |
| Standard Deviation (Population) | 3.0% | 0.81% |
Similar Demographics by Vision Disability
Demographics Similar to Tohono O'odham by Vision Disability
In terms of vision disability, the demographic groups most similar to Tohono O'odham are Black/African American (2.8%, a difference of 0.69%), Alaska Native (2.7%, a difference of 1.4%), Yup'ik (2.7%, a difference of 2.5%), Comanche (2.8%, a difference of 2.7%), and Shoshone (2.7%, a difference of 2.7%).
| Demographics | Rating | Rank | Vision Disability |
| Americans | 0.0 /100 | #312 | Tragic 2.6% |
| Potawatomi | 0.0 /100 | #313 | Tragic 2.6% |
| Inupiat | 0.0 /100 | #314 | Tragic 2.7% |
| Osage | 0.0 /100 | #315 | Tragic 2.7% |
| Shoshone | 0.0 /100 | #316 | Tragic 2.7% |
| Yup'ik | 0.0 /100 | #317 | Tragic 2.7% |
| Alaska Natives | 0.0 /100 | #318 | Tragic 2.7% |
| Tohono O'odham | 0.0 /100 | #319 | Tragic 2.8% |
| Blacks/African Americans | 0.0 /100 | #320 | Tragic 2.8% |
| Comanche | 0.0 /100 | #321 | Tragic 2.8% |
| Paiute | 0.0 /100 | #322 | Tragic 2.9% |
| Tlingit-Haida | 0.0 /100 | #323 | Tragic 2.9% |
| Hopi | 0.0 /100 | #324 | Tragic 2.9% |
| Cherokee | 0.0 /100 | #325 | Tragic 2.9% |
| Spanish Americans | 0.0 /100 | #326 | Tragic 2.9% |
Demographics Similar to Barbadians by Vision Disability
In terms of vision disability, the demographic groups most similar to Barbadians are Portuguese (2.3%, a difference of 0.070%), Ecuadorian (2.3%, a difference of 0.17%), Immigrants from Trinidad and Tobago (2.3%, a difference of 0.28%), Guamanian/Chamorro (2.3%, a difference of 0.41%), and French Canadian (2.3%, a difference of 0.43%).
| Demographics | Rating | Rank | Vision Disability |
| Immigrants | Uruguay | 11.5 /100 | #210 | Poor 2.2% |
| Indonesians | 9.5 /100 | #211 | Tragic 2.2% |
| Bermudans | 9.0 /100 | #212 | Tragic 2.2% |
| Immigrants | Ghana | 8.9 /100 | #213 | Tragic 2.2% |
| Trinidadians and Tobagonians | 8.2 /100 | #214 | Tragic 2.2% |
| Nigerians | 7.2 /100 | #215 | Tragic 2.3% |
| Immigrants | Trinidad and Tobago | 6.1 /100 | #216 | Tragic 2.3% |
| Barbadians | 5.1 /100 | #217 | Tragic 2.3% |
| Portuguese | 4.9 /100 | #218 | Tragic 2.3% |
| Ecuadorians | 4.6 /100 | #219 | Tragic 2.3% |
| Guamanians/Chamorros | 3.9 /100 | #220 | Tragic 2.3% |
| French Canadians | 3.9 /100 | #221 | Tragic 2.3% |
| Immigrants | Senegal | 3.8 /100 | #222 | Tragic 2.3% |
| Basques | 3.5 /100 | #223 | Tragic 2.3% |
| Irish | 3.4 /100 | #224 | Tragic 2.3% |