Apache vs French American Indian Disability Age 35 to 64
COMPARE
Apache
French American Indian
Disability Age 35 to 64
Disability Age 35 to 64 Comparison
Apache
French American Indians
14.9%
DISABILITY AGE 35 TO 64
0.0/ 100
METRIC RATING
323rd/ 347
METRIC RANK
13.7%
DISABILITY AGE 35 TO 64
0.0/ 100
METRIC RATING
301st/ 347
METRIC RANK
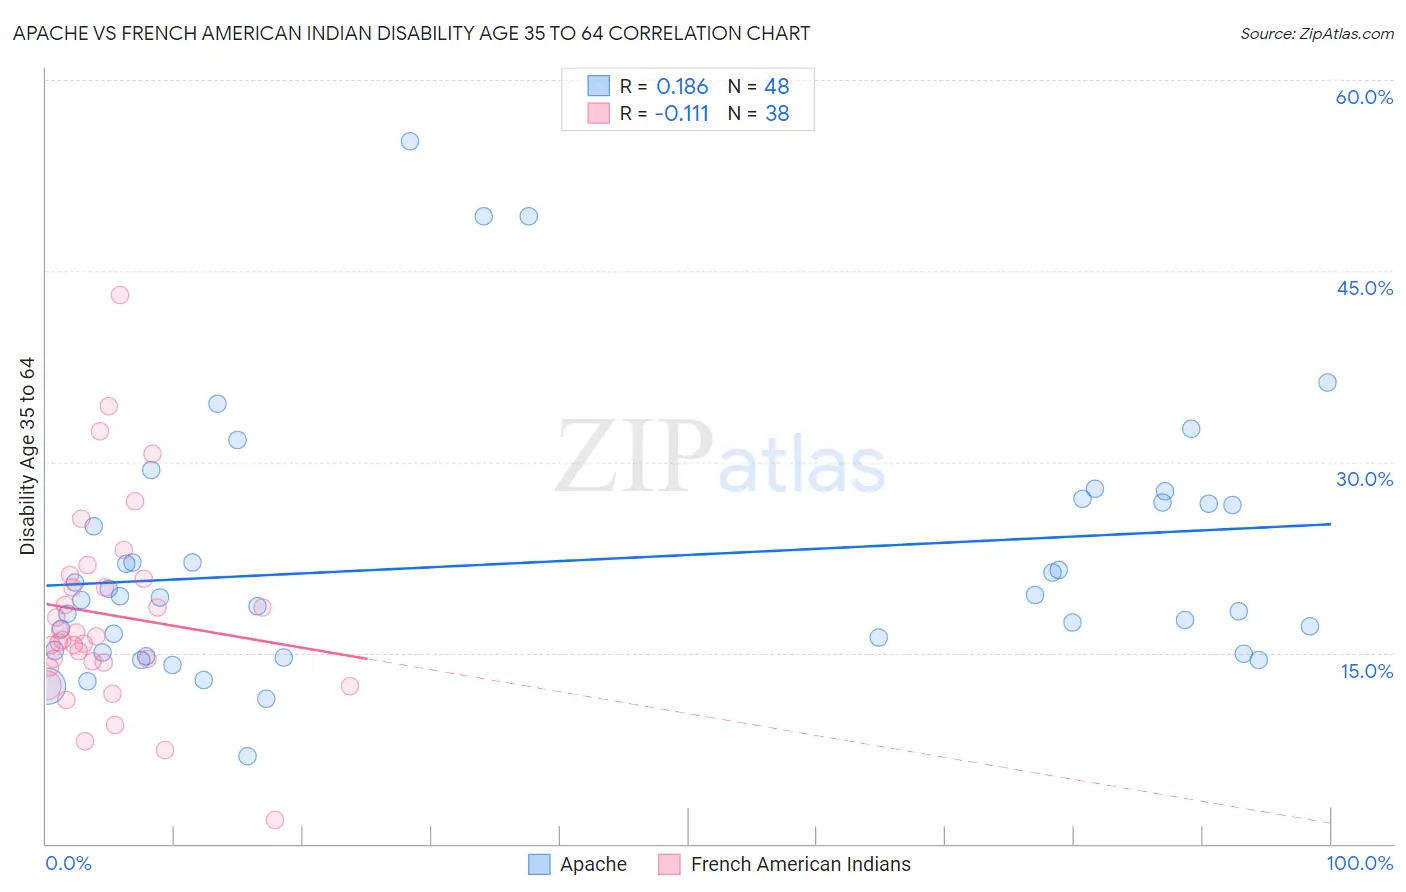
Apache vs French American Indian Disability Age 35 to 64 Correlation Chart
The statistical analysis conducted on geographies consisting of 231,024,095 people shows a poor positive correlation between the proportion of Apache and percentage of population with a disability between the ages 34 and 64 in the United States with a correlation coefficient (R) of 0.186 and weighted average of 14.9%. Similarly, the statistical analysis conducted on geographies consisting of 131,954,859 people shows a poor negative correlation between the proportion of French American Indians and percentage of population with a disability between the ages 34 and 64 in the United States with a correlation coefficient (R) of -0.111 and weighted average of 13.7%, a difference of 8.9%.
Disability Age 35 to 64 Correlation Summary
| Measurement | Apache | French American Indian |
| Minimum | 6.9% | 1.9% |
| Maximum | 55.2% | 43.1% |
| Range | 48.3% | 41.2% |
| Mean | 22.1% | 18.0% |
| Median | 19.4% | 16.2% |
| Interquartile 25% (IQ1) | 15.1% | 14.3% |
| Interquartile 75% (IQ3) | 26.8% | 20.8% |
| Interquartile Range (IQR) | 11.7% | 6.5% |
| Standard Deviation (Sample) | 9.9% | 7.8% |
| Standard Deviation (Population) | 9.8% | 7.7% |
Similar Demographics by Disability Age 35 to 64
Demographics Similar to Apache by Disability Age 35 to 64
In terms of disability age 35 to 64, the demographic groups most similar to Apache are Chippewa (15.0%, a difference of 0.20%), Arapaho (15.1%, a difference of 0.87%), Potawatomi (14.8%, a difference of 1.2%), Comanche (14.7%, a difference of 1.3%), and Black/African American (14.7%, a difference of 1.5%).
| Demographics | Rating | Rank | Disability Age 35 to 64 |
| Osage | 0.0 /100 | #316 | Tragic 14.5% |
| Crow | 0.0 /100 | #317 | Tragic 14.6% |
| Ottawa | 0.0 /100 | #318 | Tragic 14.6% |
| Immigrants | Cabo Verde | 0.0 /100 | #319 | Tragic 14.7% |
| Blacks/African Americans | 0.0 /100 | #320 | Tragic 14.7% |
| Comanche | 0.0 /100 | #321 | Tragic 14.7% |
| Potawatomi | 0.0 /100 | #322 | Tragic 14.8% |
| Apache | 0.0 /100 | #323 | Tragic 14.9% |
| Chippewa | 0.0 /100 | #324 | Tragic 15.0% |
| Arapaho | 0.0 /100 | #325 | Tragic 15.1% |
| Natives/Alaskans | 0.0 /100 | #326 | Tragic 15.3% |
| Pueblo | 0.0 /100 | #327 | Tragic 15.3% |
| Cajuns | 0.0 /100 | #328 | Tragic 15.3% |
| Cherokee | 0.0 /100 | #329 | Tragic 15.5% |
| Navajo | 0.0 /100 | #330 | Tragic 15.5% |
Demographics Similar to French American Indians by Disability Age 35 to 64
In terms of disability age 35 to 64, the demographic groups most similar to French American Indians are Delaware (13.7%, a difference of 0.30%), Spanish American (13.7%, a difference of 0.38%), Cheyenne (13.6%, a difference of 0.58%), Bangladeshi (13.6%, a difference of 0.61%), and Aleut (13.8%, a difference of 0.89%).
| Demographics | Rating | Rank | Disability Age 35 to 64 |
| Yaqui | 0.0 /100 | #294 | Tragic 13.5% |
| Yakama | 0.0 /100 | #295 | Tragic 13.6% |
| Africans | 0.0 /100 | #296 | Tragic 13.6% |
| Bangladeshis | 0.0 /100 | #297 | Tragic 13.6% |
| Cheyenne | 0.0 /100 | #298 | Tragic 13.6% |
| Spanish Americans | 0.0 /100 | #299 | Tragic 13.7% |
| Delaware | 0.0 /100 | #300 | Tragic 13.7% |
| French American Indians | 0.0 /100 | #301 | Tragic 13.7% |
| Aleuts | 0.0 /100 | #302 | Tragic 13.8% |
| Sioux | 0.0 /100 | #303 | Tragic 13.9% |
| Hopi | 0.0 /100 | #304 | Tragic 13.9% |
| Americans | 0.0 /100 | #305 | Tragic 13.9% |
| Immigrants | Yemen | 0.0 /100 | #306 | Tragic 14.0% |
| Blackfeet | 0.0 /100 | #307 | Tragic 14.1% |
| Inupiat | 0.0 /100 | #308 | Tragic 14.1% |