American vs Immigrants from Fiji Disability Age Over 75
COMPARE
American
Immigrants from Fiji
Disability Age Over 75
Disability Age Over 75 Comparison
Americans
Immigrants from Fiji
48.4%
DISABILITY AGE OVER 75
1.7/ 100
METRIC RATING
245th/ 347
METRIC RANK
50.6%
DISABILITY AGE OVER 75
0.0/ 100
METRIC RATING
307th/ 347
METRIC RANK
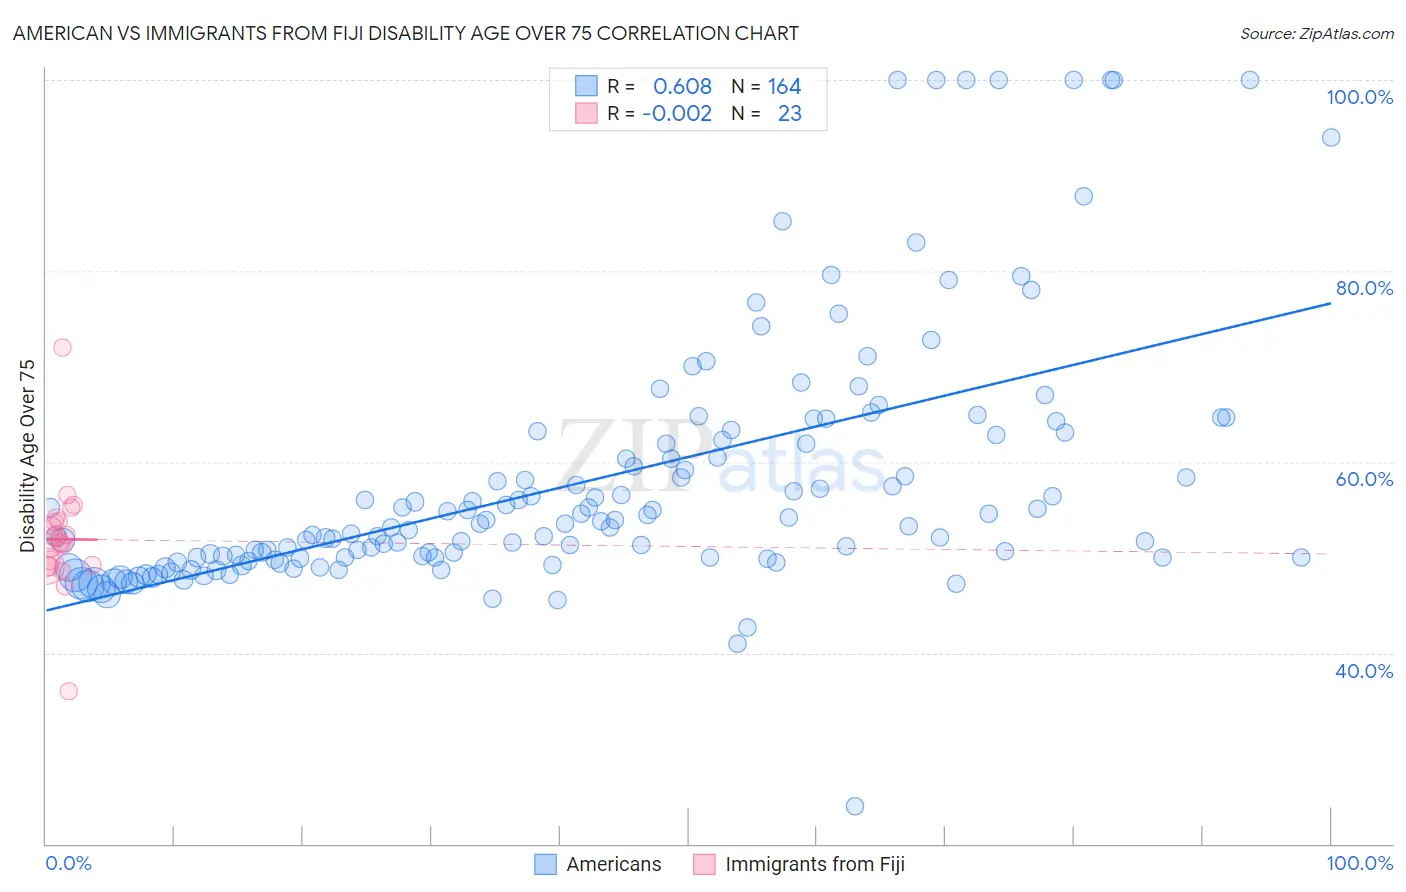
American vs Immigrants from Fiji Disability Age Over 75 Correlation Chart
The statistical analysis conducted on geographies consisting of 579,462,277 people shows a significant positive correlation between the proportion of Americans and percentage of population with a disability over the age of 75 in the United States with a correlation coefficient (R) of 0.608 and weighted average of 48.4%. Similarly, the statistical analysis conducted on geographies consisting of 93,724,522 people shows no correlation between the proportion of Immigrants from Fiji and percentage of population with a disability over the age of 75 in the United States with a correlation coefficient (R) of -0.002 and weighted average of 50.6%, a difference of 4.4%.
Disability Age Over 75 Correlation Summary
| Measurement | American | Immigrants from Fiji |
| Minimum | 23.9% | 35.9% |
| Maximum | 100.0% | 72.0% |
| Range | 76.1% | 36.1% |
| Mean | 58.0% | 51.9% |
| Median | 53.4% | 51.5% |
| Interquartile 25% (IQ1) | 50.0% | 49.1% |
| Interquartile 75% (IQ3) | 62.0% | 53.8% |
| Interquartile Range (IQR) | 12.1% | 4.7% |
| Standard Deviation (Sample) | 13.5% | 6.0% |
| Standard Deviation (Population) | 13.4% | 5.9% |
Similar Demographics by Disability Age Over 75
Demographics Similar to Americans by Disability Age Over 75
In terms of disability age over 75, the demographic groups most similar to Americans are Afghan (48.4%, a difference of 0.020%), Chippewa (48.4%, a difference of 0.030%), Iroquois (48.4%, a difference of 0.050%), Immigrants from Caribbean (48.4%, a difference of 0.11%), and Sri Lankan (48.5%, a difference of 0.11%).
| Demographics | Rating | Rank | Disability Age Over 75 |
| Nicaraguans | 3.0 /100 | #238 | Tragic 48.3% |
| Immigrants | Thailand | 2.8 /100 | #239 | Tragic 48.3% |
| Tongans | 2.3 /100 | #240 | Tragic 48.3% |
| Native Hawaiians | 2.2 /100 | #241 | Tragic 48.3% |
| French American Indians | 2.2 /100 | #242 | Tragic 48.3% |
| Immigrants | Caribbean | 2.1 /100 | #243 | Tragic 48.4% |
| Afghans | 1.8 /100 | #244 | Tragic 48.4% |
| Americans | 1.7 /100 | #245 | Tragic 48.4% |
| Chippewa | 1.6 /100 | #246 | Tragic 48.4% |
| Iroquois | 1.6 /100 | #247 | Tragic 48.4% |
| Sri Lankans | 1.4 /100 | #248 | Tragic 48.5% |
| Iraqis | 1.0 /100 | #249 | Tragic 48.6% |
| West Indians | 0.8 /100 | #250 | Tragic 48.6% |
| Koreans | 0.8 /100 | #251 | Tragic 48.6% |
| Immigrants | South Eastern Asia | 0.7 /100 | #252 | Tragic 48.7% |
Demographics Similar to Immigrants from Fiji by Disability Age Over 75
In terms of disability age over 75, the demographic groups most similar to Immigrants from Fiji are Hispanic or Latino (50.6%, a difference of 0.020%), Aleut (50.6%, a difference of 0.030%), Immigrants from Central America (50.5%, a difference of 0.060%), Tlingit-Haida (50.6%, a difference of 0.070%), and Central American Indian (50.5%, a difference of 0.15%).
| Demographics | Rating | Rank | Disability Age Over 75 |
| Cape Verdeans | 0.0 /100 | #300 | Tragic 50.1% |
| Dominicans | 0.0 /100 | #301 | Tragic 50.2% |
| Cherokee | 0.0 /100 | #302 | Tragic 50.2% |
| Japanese | 0.0 /100 | #303 | Tragic 50.2% |
| Immigrants | Dominican Republic | 0.0 /100 | #304 | Tragic 50.3% |
| Central American Indians | 0.0 /100 | #305 | Tragic 50.5% |
| Immigrants | Central America | 0.0 /100 | #306 | Tragic 50.5% |
| Immigrants | Fiji | 0.0 /100 | #307 | Tragic 50.6% |
| Hispanics or Latinos | 0.0 /100 | #308 | Tragic 50.6% |
| Aleuts | 0.0 /100 | #309 | Tragic 50.6% |
| Tlingit-Haida | 0.0 /100 | #310 | Tragic 50.6% |
| Cajuns | 0.0 /100 | #311 | Tragic 50.7% |
| Cheyenne | 0.0 /100 | #312 | Tragic 50.9% |
| Immigrants | Azores | 0.0 /100 | #313 | Tragic 50.9% |
| Immigrants | Mexico | 0.0 /100 | #314 | Tragic 51.1% |