Immigrants from Argentina vs Immigrants from Fiji Disability Age Over 75
COMPARE
Immigrants from Argentina
Immigrants from Fiji
Disability Age Over 75
Disability Age Over 75 Comparison
Immigrants from Argentina
Immigrants from Fiji
45.9%
DISABILITY AGE OVER 75
99.6/ 100
METRIC RATING
61st/ 347
METRIC RANK
50.6%
DISABILITY AGE OVER 75
0.0/ 100
METRIC RATING
307th/ 347
METRIC RANK
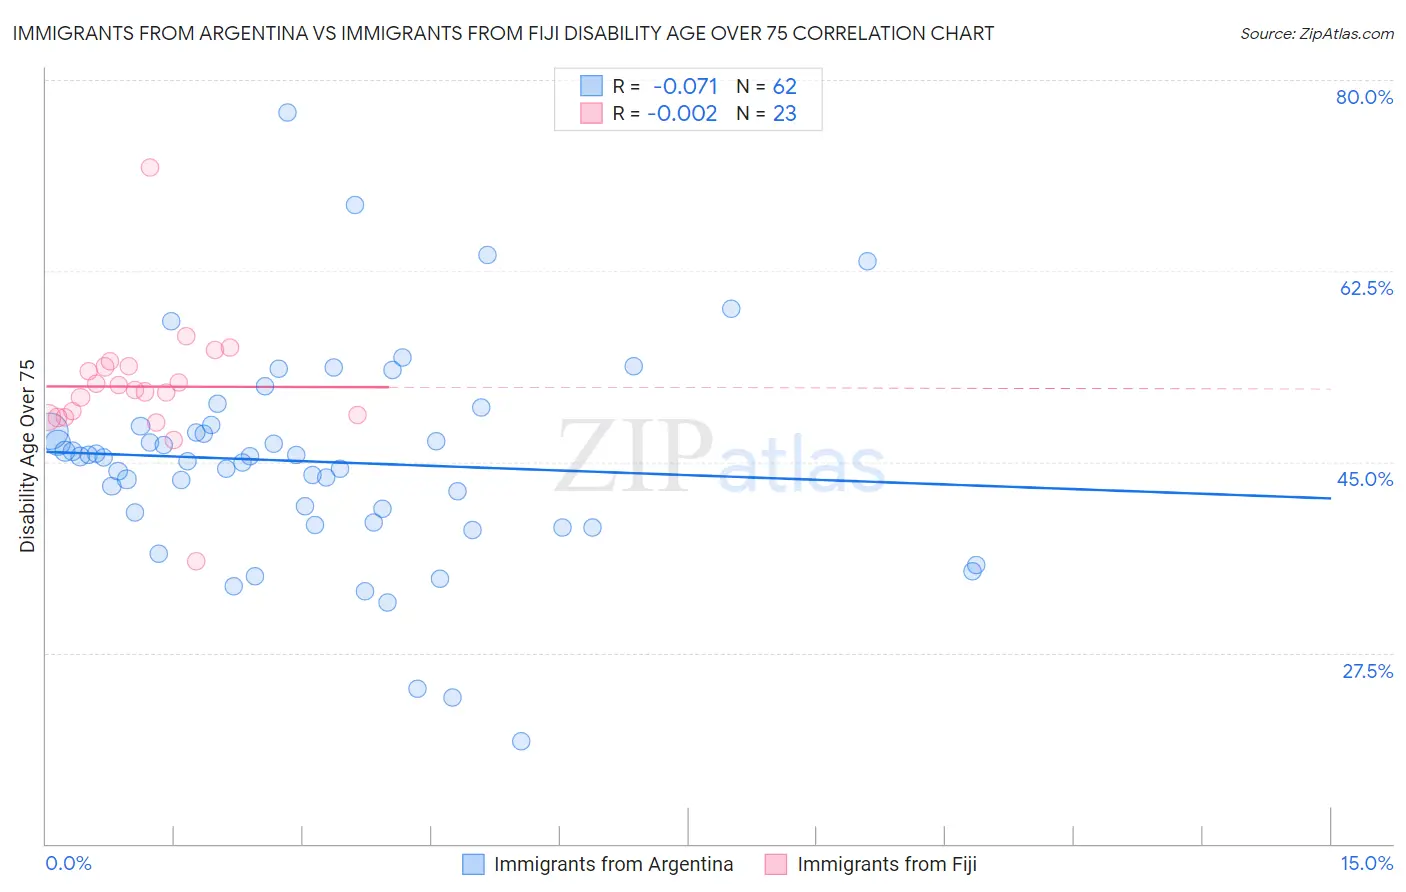
Immigrants from Argentina vs Immigrants from Fiji Disability Age Over 75 Correlation Chart
The statistical analysis conducted on geographies consisting of 264,260,821 people shows a slight negative correlation between the proportion of Immigrants from Argentina and percentage of population with a disability over the age of 75 in the United States with a correlation coefficient (R) of -0.071 and weighted average of 45.9%. Similarly, the statistical analysis conducted on geographies consisting of 93,724,522 people shows no correlation between the proportion of Immigrants from Fiji and percentage of population with a disability over the age of 75 in the United States with a correlation coefficient (R) of -0.002 and weighted average of 50.6%, a difference of 10.2%.
Disability Age Over 75 Correlation Summary
| Measurement | Immigrants from Argentina | Immigrants from Fiji |
| Minimum | 19.4% | 35.9% |
| Maximum | 77.0% | 72.0% |
| Range | 57.6% | 36.1% |
| Mean | 45.0% | 51.9% |
| Median | 45.4% | 51.5% |
| Interquartile 25% (IQ1) | 39.5% | 49.1% |
| Interquartile 75% (IQ3) | 48.2% | 53.8% |
| Interquartile Range (IQR) | 8.7% | 4.7% |
| Standard Deviation (Sample) | 9.9% | 6.0% |
| Standard Deviation (Population) | 9.8% | 5.9% |
Similar Demographics by Disability Age Over 75
Demographics Similar to Immigrants from Argentina by Disability Age Over 75
In terms of disability age over 75, the demographic groups most similar to Immigrants from Argentina are Iranian (45.9%, a difference of 0.020%), Immigrants from Europe (45.9%, a difference of 0.020%), Immigrants from Israel (45.9%, a difference of 0.030%), Burmese (45.9%, a difference of 0.030%), and Immigrants from Turkey (45.9%, a difference of 0.040%).
| Demographics | Rating | Rank | Disability Age Over 75 |
| Slovaks | 99.6 /100 | #54 | Exceptional 45.8% |
| Maltese | 99.6 /100 | #55 | Exceptional 45.8% |
| Immigrants | Netherlands | 99.6 /100 | #56 | Exceptional 45.9% |
| Immigrants | Turkey | 99.6 /100 | #57 | Exceptional 45.9% |
| Immigrants | Israel | 99.6 /100 | #58 | Exceptional 45.9% |
| Iranians | 99.6 /100 | #59 | Exceptional 45.9% |
| Immigrants | Europe | 99.6 /100 | #60 | Exceptional 45.9% |
| Immigrants | Argentina | 99.6 /100 | #61 | Exceptional 45.9% |
| Burmese | 99.5 /100 | #62 | Exceptional 45.9% |
| Immigrants | Norway | 99.5 /100 | #63 | Exceptional 45.9% |
| Immigrants | North Macedonia | 99.5 /100 | #64 | Exceptional 45.9% |
| Austrians | 99.5 /100 | #65 | Exceptional 46.0% |
| Immigrants | England | 99.5 /100 | #66 | Exceptional 46.0% |
| Immigrants | Spain | 99.4 /100 | #67 | Exceptional 46.0% |
| Immigrants | South Central Asia | 99.4 /100 | #68 | Exceptional 46.0% |
Demographics Similar to Immigrants from Fiji by Disability Age Over 75
In terms of disability age over 75, the demographic groups most similar to Immigrants from Fiji are Hispanic or Latino (50.6%, a difference of 0.020%), Aleut (50.6%, a difference of 0.030%), Immigrants from Central America (50.5%, a difference of 0.060%), Tlingit-Haida (50.6%, a difference of 0.070%), and Central American Indian (50.5%, a difference of 0.15%).
| Demographics | Rating | Rank | Disability Age Over 75 |
| Cape Verdeans | 0.0 /100 | #300 | Tragic 50.1% |
| Dominicans | 0.0 /100 | #301 | Tragic 50.2% |
| Cherokee | 0.0 /100 | #302 | Tragic 50.2% |
| Japanese | 0.0 /100 | #303 | Tragic 50.2% |
| Immigrants | Dominican Republic | 0.0 /100 | #304 | Tragic 50.3% |
| Central American Indians | 0.0 /100 | #305 | Tragic 50.5% |
| Immigrants | Central America | 0.0 /100 | #306 | Tragic 50.5% |
| Immigrants | Fiji | 0.0 /100 | #307 | Tragic 50.6% |
| Hispanics or Latinos | 0.0 /100 | #308 | Tragic 50.6% |
| Aleuts | 0.0 /100 | #309 | Tragic 50.6% |
| Tlingit-Haida | 0.0 /100 | #310 | Tragic 50.6% |
| Cajuns | 0.0 /100 | #311 | Tragic 50.7% |
| Cheyenne | 0.0 /100 | #312 | Tragic 50.9% |
| Immigrants | Azores | 0.0 /100 | #313 | Tragic 50.9% |
| Immigrants | Mexico | 0.0 /100 | #314 | Tragic 51.1% |