American vs Immigrants from Poland Disability Age Over 75
COMPARE
American
Immigrants from Poland
Disability Age Over 75
Disability Age Over 75 Comparison
Americans
Immigrants from Poland
48.4%
DISABILITY AGE OVER 75
1.7/ 100
METRIC RATING
245th/ 347
METRIC RANK
45.4%
DISABILITY AGE OVER 75
99.9/ 100
METRIC RATING
27th/ 347
METRIC RANK
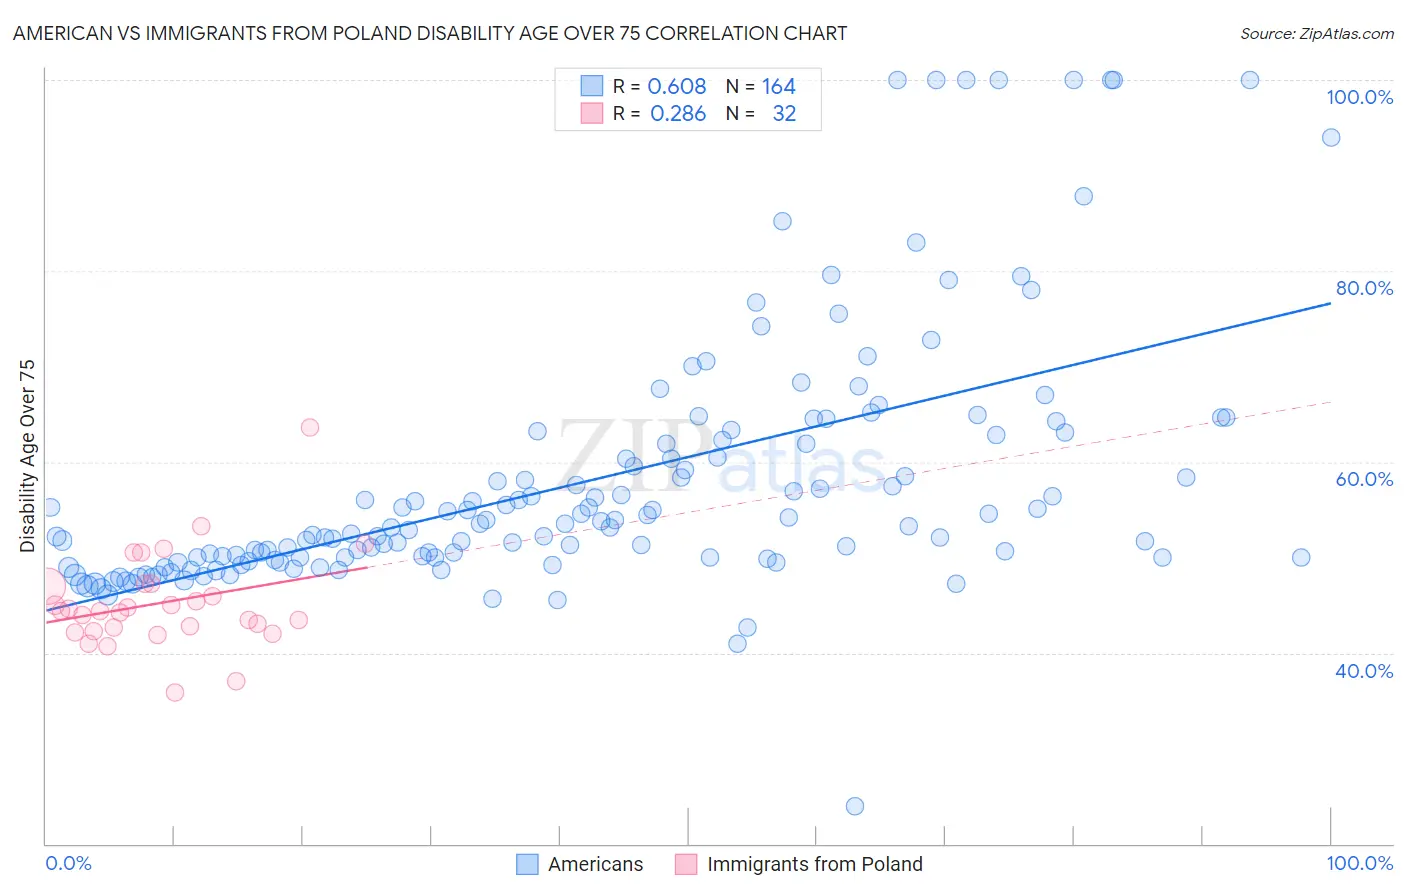
American vs Immigrants from Poland Disability Age Over 75 Correlation Chart
The statistical analysis conducted on geographies consisting of 579,462,277 people shows a significant positive correlation between the proportion of Americans and percentage of population with a disability over the age of 75 in the United States with a correlation coefficient (R) of 0.608 and weighted average of 48.4%. Similarly, the statistical analysis conducted on geographies consisting of 304,637,447 people shows a weak positive correlation between the proportion of Immigrants from Poland and percentage of population with a disability over the age of 75 in the United States with a correlation coefficient (R) of 0.286 and weighted average of 45.4%, a difference of 6.7%.
Disability Age Over 75 Correlation Summary
| Measurement | American | Immigrants from Poland |
| Minimum | 23.9% | 35.9% |
| Maximum | 100.0% | 63.6% |
| Range | 76.1% | 27.7% |
| Mean | 58.0% | 45.2% |
| Median | 53.4% | 44.4% |
| Interquartile 25% (IQ1) | 50.0% | 42.5% |
| Interquartile 75% (IQ3) | 62.0% | 47.1% |
| Interquartile Range (IQR) | 12.1% | 4.6% |
| Standard Deviation (Sample) | 13.5% | 5.1% |
| Standard Deviation (Population) | 13.4% | 5.0% |
Similar Demographics by Disability Age Over 75
Demographics Similar to Americans by Disability Age Over 75
In terms of disability age over 75, the demographic groups most similar to Americans are Afghan (48.4%, a difference of 0.020%), Chippewa (48.4%, a difference of 0.030%), Iroquois (48.4%, a difference of 0.050%), Immigrants from Caribbean (48.4%, a difference of 0.11%), and Sri Lankan (48.5%, a difference of 0.11%).
| Demographics | Rating | Rank | Disability Age Over 75 |
| Nicaraguans | 3.0 /100 | #238 | Tragic 48.3% |
| Immigrants | Thailand | 2.8 /100 | #239 | Tragic 48.3% |
| Tongans | 2.3 /100 | #240 | Tragic 48.3% |
| Native Hawaiians | 2.2 /100 | #241 | Tragic 48.3% |
| French American Indians | 2.2 /100 | #242 | Tragic 48.3% |
| Immigrants | Caribbean | 2.1 /100 | #243 | Tragic 48.4% |
| Afghans | 1.8 /100 | #244 | Tragic 48.4% |
| Americans | 1.7 /100 | #245 | Tragic 48.4% |
| Chippewa | 1.6 /100 | #246 | Tragic 48.4% |
| Iroquois | 1.6 /100 | #247 | Tragic 48.4% |
| Sri Lankans | 1.4 /100 | #248 | Tragic 48.5% |
| Iraqis | 1.0 /100 | #249 | Tragic 48.6% |
| West Indians | 0.8 /100 | #250 | Tragic 48.6% |
| Koreans | 0.8 /100 | #251 | Tragic 48.6% |
| Immigrants | South Eastern Asia | 0.7 /100 | #252 | Tragic 48.7% |
Demographics Similar to Immigrants from Poland by Disability Age Over 75
In terms of disability age over 75, the demographic groups most similar to Immigrants from Poland are Macedonian (45.4%, a difference of 0.010%), Thai (45.4%, a difference of 0.020%), Immigrants from Bolivia (45.4%, a difference of 0.050%), Filipino (45.4%, a difference of 0.060%), and Polish (45.3%, a difference of 0.090%).
| Demographics | Rating | Rank | Disability Age Over 75 |
| Immigrants | Serbia | 100.0 /100 | #20 | Exceptional 45.3% |
| Immigrants | Belgium | 100.0 /100 | #21 | Exceptional 45.3% |
| Immigrants | South Africa | 100.0 /100 | #22 | Exceptional 45.3% |
| Immigrants | Switzerland | 99.9 /100 | #23 | Exceptional 45.3% |
| Poles | 99.9 /100 | #24 | Exceptional 45.3% |
| Immigrants | Bolivia | 99.9 /100 | #25 | Exceptional 45.4% |
| Macedonians | 99.9 /100 | #26 | Exceptional 45.4% |
| Immigrants | Poland | 99.9 /100 | #27 | Exceptional 45.4% |
| Thais | 99.9 /100 | #28 | Exceptional 45.4% |
| Filipinos | 99.9 /100 | #29 | Exceptional 45.4% |
| Immigrants | Denmark | 99.9 /100 | #30 | Exceptional 45.4% |
| Immigrants | Bulgaria | 99.9 /100 | #31 | Exceptional 45.5% |
| Immigrants | Australia | 99.9 /100 | #32 | Exceptional 45.5% |
| Immigrants | Croatia | 99.9 /100 | #33 | Exceptional 45.5% |
| Russians | 99.9 /100 | #34 | Exceptional 45.5% |