American vs Immigrants from Uruguay Disability Age Over 75
COMPARE
American
Immigrants from Uruguay
Disability Age Over 75
Disability Age Over 75 Comparison
Americans
Immigrants from Uruguay
48.4%
DISABILITY AGE OVER 75
1.7/ 100
METRIC RATING
245th/ 347
METRIC RANK
46.4%
DISABILITY AGE OVER 75
96.7/ 100
METRIC RATING
107th/ 347
METRIC RANK
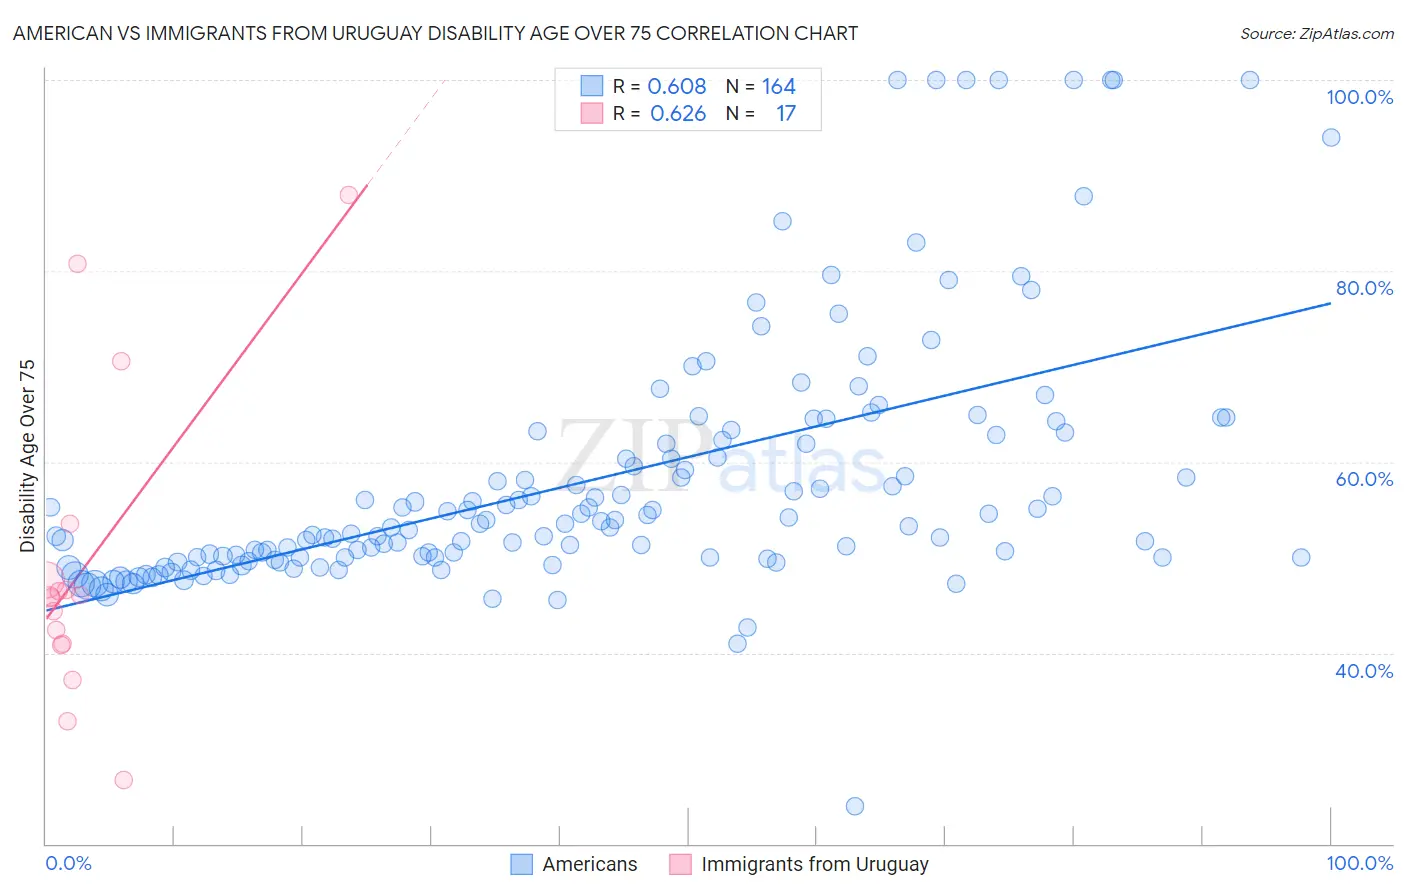
American vs Immigrants from Uruguay Disability Age Over 75 Correlation Chart
The statistical analysis conducted on geographies consisting of 579,462,277 people shows a significant positive correlation between the proportion of Americans and percentage of population with a disability over the age of 75 in the United States with a correlation coefficient (R) of 0.608 and weighted average of 48.4%. Similarly, the statistical analysis conducted on geographies consisting of 133,242,093 people shows a significant positive correlation between the proportion of Immigrants from Uruguay and percentage of population with a disability over the age of 75 in the United States with a correlation coefficient (R) of 0.626 and weighted average of 46.4%, a difference of 4.2%.
Disability Age Over 75 Correlation Summary
| Measurement | American | Immigrants from Uruguay |
| Minimum | 23.9% | 26.7% |
| Maximum | 100.0% | 88.0% |
| Range | 76.1% | 61.3% |
| Mean | 58.0% | 49.2% |
| Median | 53.4% | 45.9% |
| Interquartile 25% (IQ1) | 50.0% | 40.9% |
| Interquartile 75% (IQ3) | 62.0% | 50.6% |
| Interquartile Range (IQR) | 12.1% | 9.7% |
| Standard Deviation (Sample) | 13.5% | 16.1% |
| Standard Deviation (Population) | 13.4% | 15.6% |
Similar Demographics by Disability Age Over 75
Demographics Similar to Americans by Disability Age Over 75
In terms of disability age over 75, the demographic groups most similar to Americans are Afghan (48.4%, a difference of 0.020%), Chippewa (48.4%, a difference of 0.030%), Iroquois (48.4%, a difference of 0.050%), Immigrants from Caribbean (48.4%, a difference of 0.11%), and Sri Lankan (48.5%, a difference of 0.11%).
| Demographics | Rating | Rank | Disability Age Over 75 |
| Nicaraguans | 3.0 /100 | #238 | Tragic 48.3% |
| Immigrants | Thailand | 2.8 /100 | #239 | Tragic 48.3% |
| Tongans | 2.3 /100 | #240 | Tragic 48.3% |
| Native Hawaiians | 2.2 /100 | #241 | Tragic 48.3% |
| French American Indians | 2.2 /100 | #242 | Tragic 48.3% |
| Immigrants | Caribbean | 2.1 /100 | #243 | Tragic 48.4% |
| Afghans | 1.8 /100 | #244 | Tragic 48.4% |
| Americans | 1.7 /100 | #245 | Tragic 48.4% |
| Chippewa | 1.6 /100 | #246 | Tragic 48.4% |
| Iroquois | 1.6 /100 | #247 | Tragic 48.4% |
| Sri Lankans | 1.4 /100 | #248 | Tragic 48.5% |
| Iraqis | 1.0 /100 | #249 | Tragic 48.6% |
| West Indians | 0.8 /100 | #250 | Tragic 48.6% |
| Koreans | 0.8 /100 | #251 | Tragic 48.6% |
| Immigrants | South Eastern Asia | 0.7 /100 | #252 | Tragic 48.7% |
Demographics Similar to Immigrants from Uruguay by Disability Age Over 75
In terms of disability age over 75, the demographic groups most similar to Immigrants from Uruguay are Brazilian (46.5%, a difference of 0.010%), Immigrants from Kuwait (46.4%, a difference of 0.030%), Chilean (46.5%, a difference of 0.040%), Immigrants from Cameroon (46.4%, a difference of 0.050%), and Immigrants from Hong Kong (46.5%, a difference of 0.050%).
| Demographics | Rating | Rank | Disability Age Over 75 |
| Immigrants | Eastern Europe | 97.7 /100 | #100 | Exceptional 46.3% |
| Mongolians | 97.7 /100 | #101 | Exceptional 46.3% |
| Immigrants | Malaysia | 97.1 /100 | #102 | Exceptional 46.4% |
| Ukrainians | 97.1 /100 | #103 | Exceptional 46.4% |
| Israelis | 97.0 /100 | #104 | Exceptional 46.4% |
| Immigrants | Cameroon | 96.9 /100 | #105 | Exceptional 46.4% |
| Immigrants | Kuwait | 96.8 /100 | #106 | Exceptional 46.4% |
| Immigrants | Uruguay | 96.7 /100 | #107 | Exceptional 46.4% |
| Brazilians | 96.6 /100 | #108 | Exceptional 46.5% |
| Chileans | 96.4 /100 | #109 | Exceptional 46.5% |
| Immigrants | Hong Kong | 96.4 /100 | #110 | Exceptional 46.5% |
| Immigrants | Chile | 96.4 /100 | #111 | Exceptional 46.5% |
| Immigrants | Pakistan | 96.1 /100 | #112 | Exceptional 46.5% |
| Irish | 96.0 /100 | #113 | Exceptional 46.5% |
| Dutch | 95.9 /100 | #114 | Exceptional 46.5% |