American vs Immigrants from Jordan Disability Age Over 75
COMPARE
American
Immigrants from Jordan
Disability Age Over 75
Disability Age Over 75 Comparison
Americans
Immigrants from Jordan
48.4%
DISABILITY AGE OVER 75
1.7/ 100
METRIC RATING
245th/ 347
METRIC RANK
46.2%
DISABILITY AGE OVER 75
98.7/ 100
METRIC RATING
84th/ 347
METRIC RANK
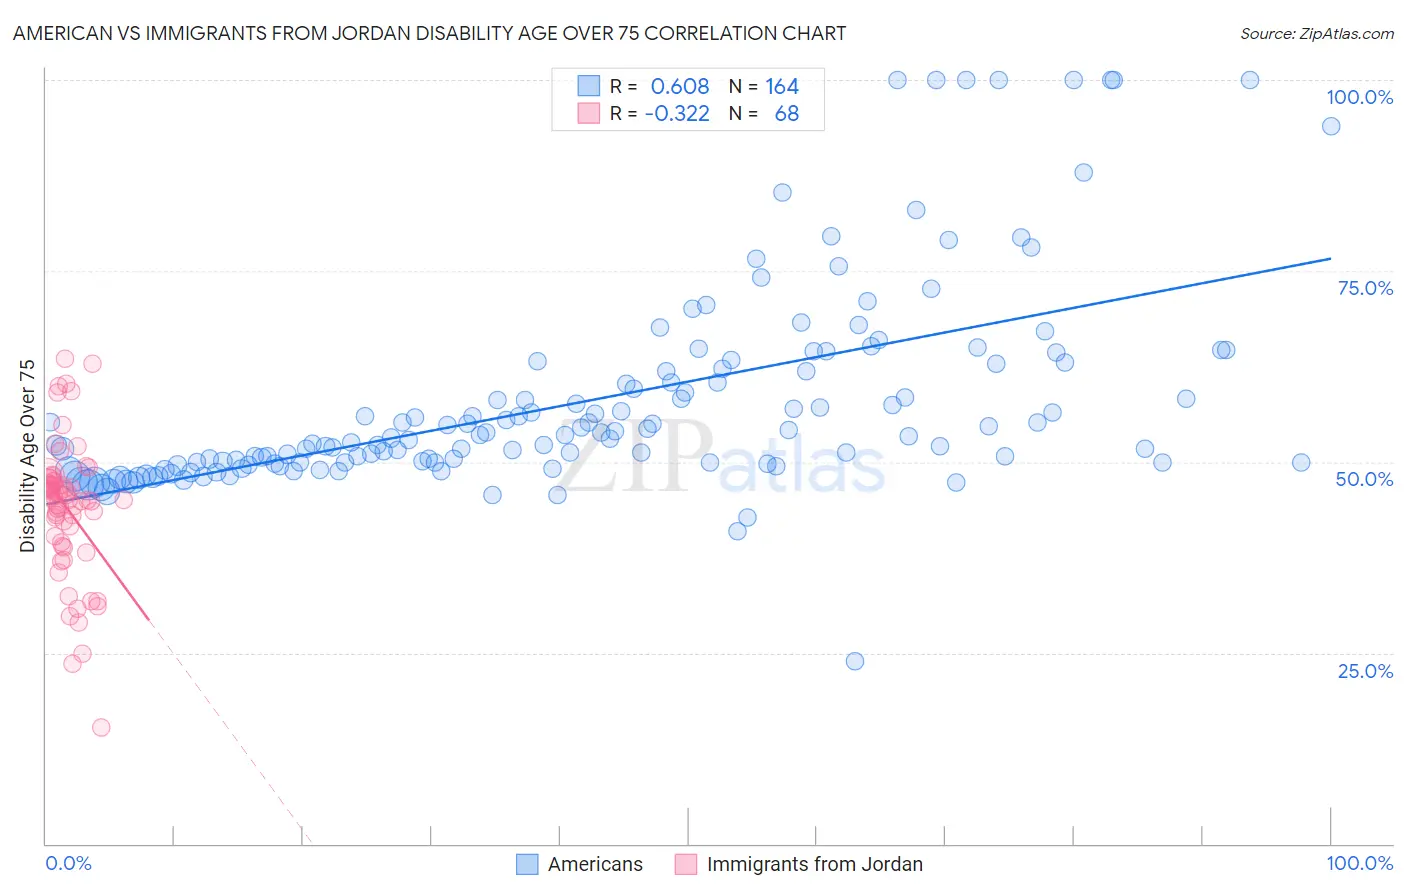
American vs Immigrants from Jordan Disability Age Over 75 Correlation Chart
The statistical analysis conducted on geographies consisting of 579,462,277 people shows a significant positive correlation between the proportion of Americans and percentage of population with a disability over the age of 75 in the United States with a correlation coefficient (R) of 0.608 and weighted average of 48.4%. Similarly, the statistical analysis conducted on geographies consisting of 181,194,306 people shows a mild negative correlation between the proportion of Immigrants from Jordan and percentage of population with a disability over the age of 75 in the United States with a correlation coefficient (R) of -0.322 and weighted average of 46.2%, a difference of 4.8%.
Disability Age Over 75 Correlation Summary
| Measurement | American | Immigrants from Jordan |
| Minimum | 23.9% | 15.2% |
| Maximum | 100.0% | 63.5% |
| Range | 76.1% | 48.4% |
| Mean | 58.0% | 43.9% |
| Median | 53.4% | 45.1% |
| Interquartile 25% (IQ1) | 50.0% | 39.8% |
| Interquartile 75% (IQ3) | 62.0% | 47.4% |
| Interquartile Range (IQR) | 12.1% | 7.5% |
| Standard Deviation (Sample) | 13.5% | 9.0% |
| Standard Deviation (Population) | 13.4% | 8.9% |
Similar Demographics by Disability Age Over 75
Demographics Similar to Americans by Disability Age Over 75
In terms of disability age over 75, the demographic groups most similar to Americans are Afghan (48.4%, a difference of 0.020%), Chippewa (48.4%, a difference of 0.030%), Iroquois (48.4%, a difference of 0.050%), Immigrants from Caribbean (48.4%, a difference of 0.11%), and Sri Lankan (48.5%, a difference of 0.11%).
| Demographics | Rating | Rank | Disability Age Over 75 |
| Nicaraguans | 3.0 /100 | #238 | Tragic 48.3% |
| Immigrants | Thailand | 2.8 /100 | #239 | Tragic 48.3% |
| Tongans | 2.3 /100 | #240 | Tragic 48.3% |
| Native Hawaiians | 2.2 /100 | #241 | Tragic 48.3% |
| French American Indians | 2.2 /100 | #242 | Tragic 48.3% |
| Immigrants | Caribbean | 2.1 /100 | #243 | Tragic 48.4% |
| Afghans | 1.8 /100 | #244 | Tragic 48.4% |
| Americans | 1.7 /100 | #245 | Tragic 48.4% |
| Chippewa | 1.6 /100 | #246 | Tragic 48.4% |
| Iroquois | 1.6 /100 | #247 | Tragic 48.4% |
| Sri Lankans | 1.4 /100 | #248 | Tragic 48.5% |
| Iraqis | 1.0 /100 | #249 | Tragic 48.6% |
| West Indians | 0.8 /100 | #250 | Tragic 48.6% |
| Koreans | 0.8 /100 | #251 | Tragic 48.6% |
| Immigrants | South Eastern Asia | 0.7 /100 | #252 | Tragic 48.7% |
Demographics Similar to Immigrants from Jordan by Disability Age Over 75
In terms of disability age over 75, the demographic groups most similar to Immigrants from Jordan are Immigrants from Latvia (46.2%, a difference of 0.010%), Argentinean (46.2%, a difference of 0.010%), Immigrants from Southern Europe (46.2%, a difference of 0.020%), Romanian (46.2%, a difference of 0.020%), and Danish (46.2%, a difference of 0.020%).
| Demographics | Rating | Rank | Disability Age Over 75 |
| Immigrants | Eastern Asia | 98.9 /100 | #77 | Exceptional 46.2% |
| Immigrants | Western Europe | 98.8 /100 | #78 | Exceptional 46.2% |
| Swiss | 98.8 /100 | #79 | Exceptional 46.2% |
| Soviet Union | 98.8 /100 | #80 | Exceptional 46.2% |
| New Zealanders | 98.8 /100 | #81 | Exceptional 46.2% |
| Immigrants | Latvia | 98.7 /100 | #82 | Exceptional 46.2% |
| Argentineans | 98.7 /100 | #83 | Exceptional 46.2% |
| Immigrants | Jordan | 98.7 /100 | #84 | Exceptional 46.2% |
| Immigrants | Southern Europe | 98.6 /100 | #85 | Exceptional 46.2% |
| Romanians | 98.6 /100 | #86 | Exceptional 46.2% |
| Danes | 98.6 /100 | #87 | Exceptional 46.2% |
| Uruguayans | 98.4 /100 | #88 | Exceptional 46.2% |
| Immigrants | Saudi Arabia | 98.4 /100 | #89 | Exceptional 46.3% |
| Northern Europeans | 98.3 /100 | #90 | Exceptional 46.3% |
| Immigrants | Egypt | 98.3 /100 | #91 | Exceptional 46.3% |