Albanian vs Immigrants from Oceania 5th Grade
COMPARE
Albanian
Immigrants from Oceania
5th Grade
5th Grade Comparison
Albanians
Immigrants from Oceania
97.4%
5TH GRADE
68.3/ 100
METRIC RATING
158th/ 347
METRIC RANK
97.1%
5TH GRADE
10.0/ 100
METRIC RATING
210th/ 347
METRIC RANK
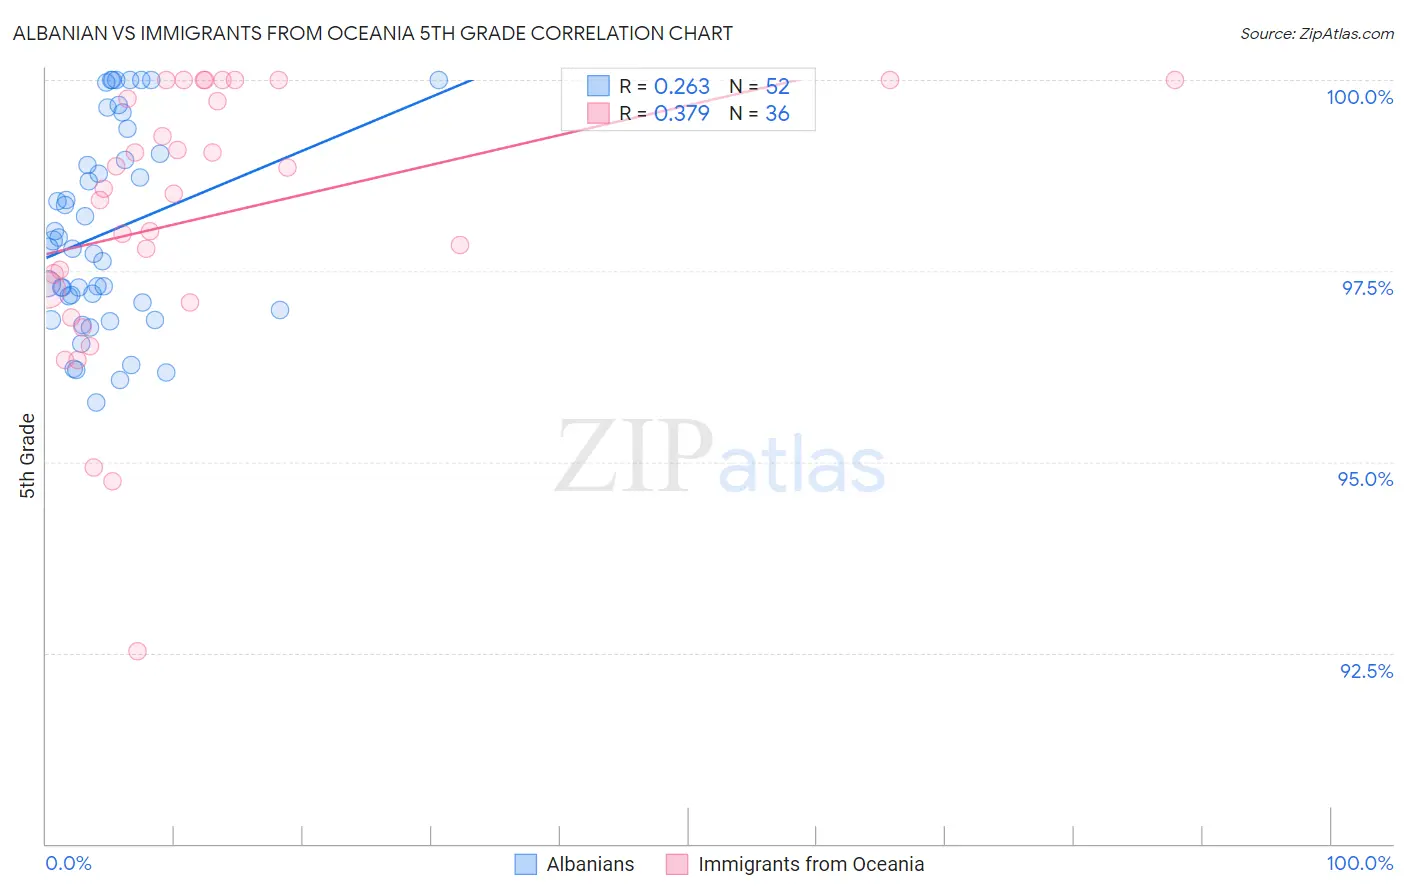
Albanian vs Immigrants from Oceania 5th Grade Correlation Chart
The statistical analysis conducted on geographies consisting of 193,265,850 people shows a weak positive correlation between the proportion of Albanians and percentage of population with at least 5th grade education in the United States with a correlation coefficient (R) of 0.263 and weighted average of 97.4%. Similarly, the statistical analysis conducted on geographies consisting of 305,516,300 people shows a mild positive correlation between the proportion of Immigrants from Oceania and percentage of population with at least 5th grade education in the United States with a correlation coefficient (R) of 0.379 and weighted average of 97.1%, a difference of 0.31%.
5th Grade Correlation Summary
| Measurement | Albanian | Immigrants from Oceania |
| Minimum | 95.8% | 92.5% |
| Maximum | 100.0% | 100.0% |
| Range | 4.2% | 7.5% |
| Mean | 98.0% | 98.2% |
| Median | 97.8% | 98.5% |
| Interquartile 25% (IQ1) | 97.0% | 97.2% |
| Interquartile 75% (IQ3) | 99.0% | 99.9% |
| Interquartile Range (IQR) | 2.0% | 2.7% |
| Standard Deviation (Sample) | 1.3% | 1.8% |
| Standard Deviation (Population) | 1.3% | 1.8% |
Similar Demographics by 5th Grade
Demographics Similar to Albanians by 5th Grade
In terms of 5th grade, the demographic groups most similar to Albanians are Immigrants from Russia (97.4%, a difference of 0.010%), Immigrants from Bosnia and Herzegovina (97.4%, a difference of 0.010%), French American Indian (97.4%, a difference of 0.010%), Immigrants from Jordan (97.4%, a difference of 0.010%), and Immigrants from Italy (97.4%, a difference of 0.010%).
| Demographics | Rating | Rank | 5th Grade |
| Immigrants | Eastern Europe | 75.0 /100 | #151 | Good 97.4% |
| Ute | 74.9 /100 | #152 | Good 97.4% |
| Alsatians | 74.3 /100 | #153 | Good 97.4% |
| Immigrants | Russia | 71.2 /100 | #154 | Good 97.4% |
| Immigrants | Bosnia and Herzegovina | 71.0 /100 | #155 | Good 97.4% |
| French American Indians | 70.5 /100 | #156 | Good 97.4% |
| Immigrants | Jordan | 70.4 /100 | #157 | Good 97.4% |
| Albanians | 68.3 /100 | #158 | Good 97.4% |
| Immigrants | Italy | 65.2 /100 | #159 | Good 97.4% |
| Marshallese | 61.2 /100 | #160 | Good 97.4% |
| Kenyans | 59.7 /100 | #161 | Average 97.4% |
| Immigrants | Iran | 59.5 /100 | #162 | Average 97.4% |
| Ugandans | 58.9 /100 | #163 | Average 97.4% |
| Bermudans | 58.8 /100 | #164 | Average 97.4% |
| Immigrants | Poland | 57.9 /100 | #165 | Average 97.4% |
Demographics Similar to Immigrants from Oceania by 5th Grade
In terms of 5th grade, the demographic groups most similar to Immigrants from Oceania are Immigrants from Nepal (97.1%, a difference of 0.0%), Iraqi (97.1%, a difference of 0.010%), Laotian (97.1%, a difference of 0.010%), Moroccan (97.1%, a difference of 0.020%), and Paiute (97.1%, a difference of 0.020%).
| Demographics | Rating | Rank | 5th Grade |
| Immigrants | Bahamas | 14.9 /100 | #203 | Poor 97.2% |
| Immigrants | Zaire | 13.7 /100 | #204 | Poor 97.1% |
| Moroccans | 12.0 /100 | #205 | Poor 97.1% |
| Paiute | 11.6 /100 | #206 | Poor 97.1% |
| Iraqis | 10.9 /100 | #207 | Poor 97.1% |
| Laotians | 10.8 /100 | #208 | Poor 97.1% |
| Immigrants | Nepal | 10.3 /100 | #209 | Poor 97.1% |
| Immigrants | Oceania | 10.0 /100 | #210 | Poor 97.1% |
| Samoans | 8.5 /100 | #211 | Tragic 97.1% |
| Immigrants | Iraq | 8.3 /100 | #212 | Tragic 97.1% |
| Portuguese | 7.8 /100 | #213 | Tragic 97.1% |
| Costa Ricans | 7.7 /100 | #214 | Tragic 97.1% |
| Immigrants | Morocco | 7.5 /100 | #215 | Tragic 97.1% |
| Sudanese | 7.0 /100 | #216 | Tragic 97.1% |
| Immigrants | Lebanon | 6.8 /100 | #217 | Tragic 97.1% |