Albanian vs Immigrants from Asia Self-Care Disability
COMPARE
Albanian
Immigrants from Asia
Self-Care Disability
Self-Care Disability Comparison
Albanians
Immigrants from Asia
2.6%
SELF-CARE DISABILITY
2.2/ 100
METRIC RATING
232nd/ 347
METRIC RANK
2.4%
SELF-CARE DISABILITY
96.9/ 100
METRIC RATING
95th/ 347
METRIC RANK
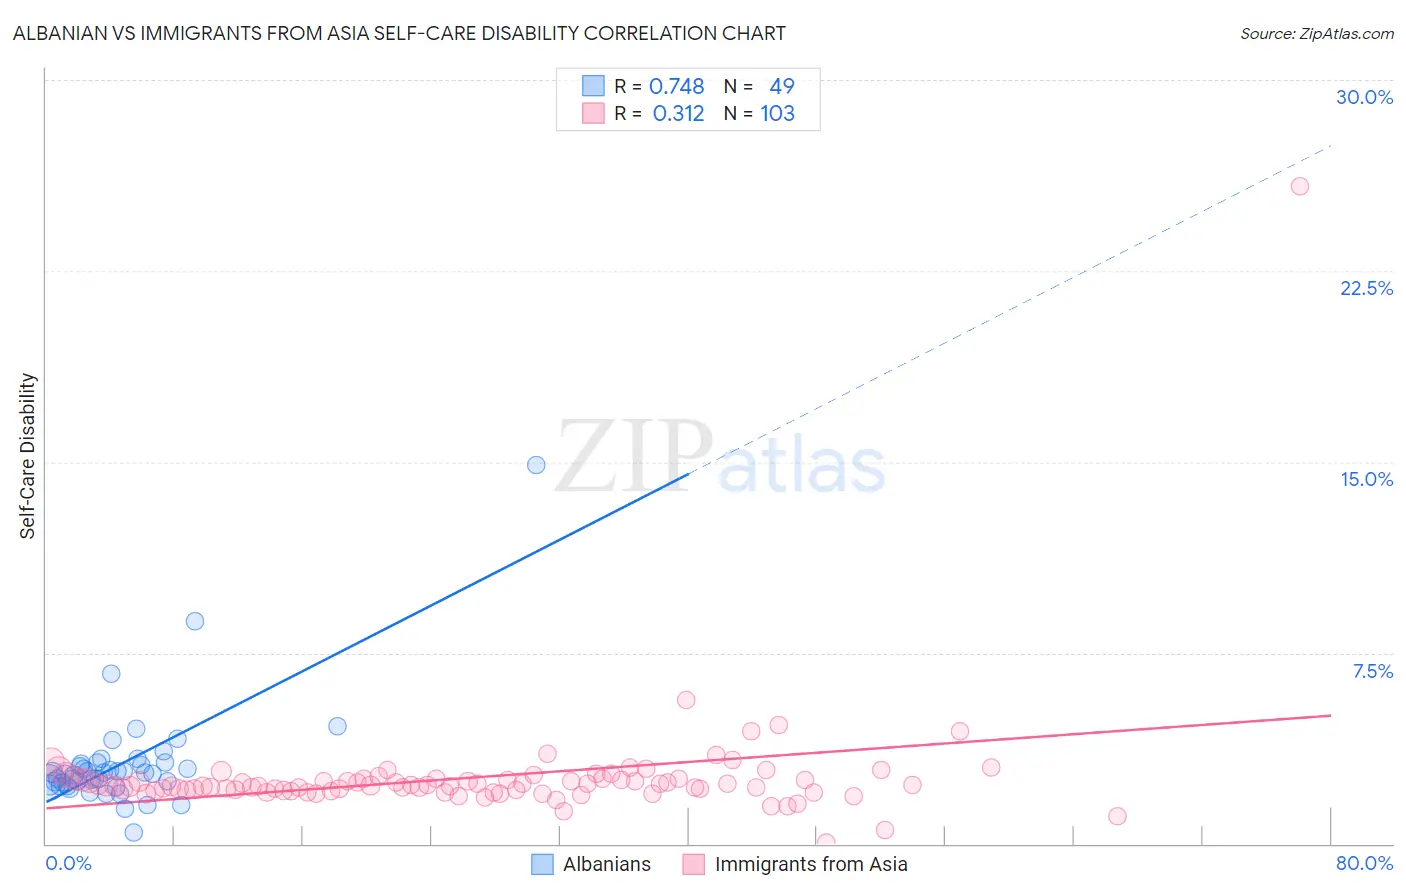
Albanian vs Immigrants from Asia Self-Care Disability Correlation Chart
The statistical analysis conducted on geographies consisting of 193,148,254 people shows a strong positive correlation between the proportion of Albanians and percentage of population with self-care disability in the United States with a correlation coefficient (R) of 0.748 and weighted average of 2.6%. Similarly, the statistical analysis conducted on geographies consisting of 547,490,821 people shows a mild positive correlation between the proportion of Immigrants from Asia and percentage of population with self-care disability in the United States with a correlation coefficient (R) of 0.312 and weighted average of 2.4%, a difference of 9.0%.
Self-Care Disability Correlation Summary
| Measurement | Albanian | Immigrants from Asia |
| Minimum | 0.42% | 0.037% |
| Maximum | 14.9% | 25.8% |
| Range | 14.5% | 25.8% |
| Mean | 3.2% | 2.6% |
| Median | 2.7% | 2.3% |
| Interquartile 25% (IQ1) | 2.3% | 2.1% |
| Interquartile 75% (IQ3) | 3.1% | 2.5% |
| Interquartile Range (IQR) | 0.80% | 0.44% |
| Standard Deviation (Sample) | 2.1% | 2.4% |
| Standard Deviation (Population) | 2.1% | 2.4% |
Similar Demographics by Self-Care Disability
Demographics Similar to Albanians by Self-Care Disability
In terms of self-care disability, the demographic groups most similar to Albanians are Immigrants from Guatemala (2.6%, a difference of 0.030%), Liberian (2.6%, a difference of 0.040%), Vietnamese (2.6%, a difference of 0.050%), Bahamian (2.6%, a difference of 0.090%), and Bermudan (2.6%, a difference of 0.15%).
| Demographics | Rating | Rank | Self-Care Disability |
| Iraqis | 3.2 /100 | #225 | Tragic 2.6% |
| Chinese | 2.9 /100 | #226 | Tragic 2.6% |
| Immigrants | Philippines | 2.7 /100 | #227 | Tragic 2.6% |
| Guatemalans | 2.7 /100 | #228 | Tragic 2.6% |
| Guamanians/Chamorros | 2.5 /100 | #229 | Tragic 2.6% |
| Immigrants | Ecuador | 2.5 /100 | #230 | Tragic 2.6% |
| Immigrants | Guatemala | 2.2 /100 | #231 | Tragic 2.6% |
| Albanians | 2.2 /100 | #232 | Tragic 2.6% |
| Liberians | 2.1 /100 | #233 | Tragic 2.6% |
| Vietnamese | 2.1 /100 | #234 | Tragic 2.6% |
| Bahamians | 2.0 /100 | #235 | Tragic 2.6% |
| Bermudans | 1.9 /100 | #236 | Tragic 2.6% |
| Immigrants | Senegal | 1.6 /100 | #237 | Tragic 2.6% |
| Senegalese | 1.3 /100 | #238 | Tragic 2.6% |
| Immigrants | Panama | 1.2 /100 | #239 | Tragic 2.6% |
Demographics Similar to Immigrants from Asia by Self-Care Disability
In terms of self-care disability, the demographic groups most similar to Immigrants from Asia are Macedonian (2.4%, a difference of 0.010%), Immigrants from Latvia (2.4%, a difference of 0.050%), Immigrants from Chile (2.4%, a difference of 0.060%), Swiss (2.4%, a difference of 0.10%), and Immigrants from Poland (2.4%, a difference of 0.19%).
| Demographics | Rating | Rank | Self-Care Disability |
| Lithuanians | 98.0 /100 | #88 | Exceptional 2.4% |
| Immigrants | Congo | 98.0 /100 | #89 | Exceptional 2.4% |
| Immigrants | Czechoslovakia | 97.7 /100 | #90 | Exceptional 2.4% |
| Immigrants | Jordan | 97.7 /100 | #91 | Exceptional 2.4% |
| Icelanders | 97.4 /100 | #92 | Exceptional 2.4% |
| Immigrants | Latvia | 97.0 /100 | #93 | Exceptional 2.4% |
| Macedonians | 96.9 /100 | #94 | Exceptional 2.4% |
| Immigrants | Asia | 96.9 /100 | #95 | Exceptional 2.4% |
| Immigrants | Chile | 96.7 /100 | #96 | Exceptional 2.4% |
| Swiss | 96.6 /100 | #97 | Exceptional 2.4% |
| Immigrants | Poland | 96.4 /100 | #98 | Exceptional 2.4% |
| Immigrants | Israel | 96.1 /100 | #99 | Exceptional 2.4% |
| Europeans | 95.8 /100 | #100 | Exceptional 2.4% |
| Immigrants | Scotland | 95.7 /100 | #101 | Exceptional 2.4% |
| Croatians | 95.0 /100 | #102 | Exceptional 2.4% |