Mongolian vs Brazilian Vision Disability
COMPARE
Mongolian
Brazilian
Vision Disability
Vision Disability Comparison
Mongolians
Brazilians
1.9%
VISION DISABILITY
99.9/ 100
METRIC RATING
31st/ 347
METRIC RANK
2.1%
VISION DISABILITY
62.2/ 100
METRIC RATING
168th/ 347
METRIC RANK
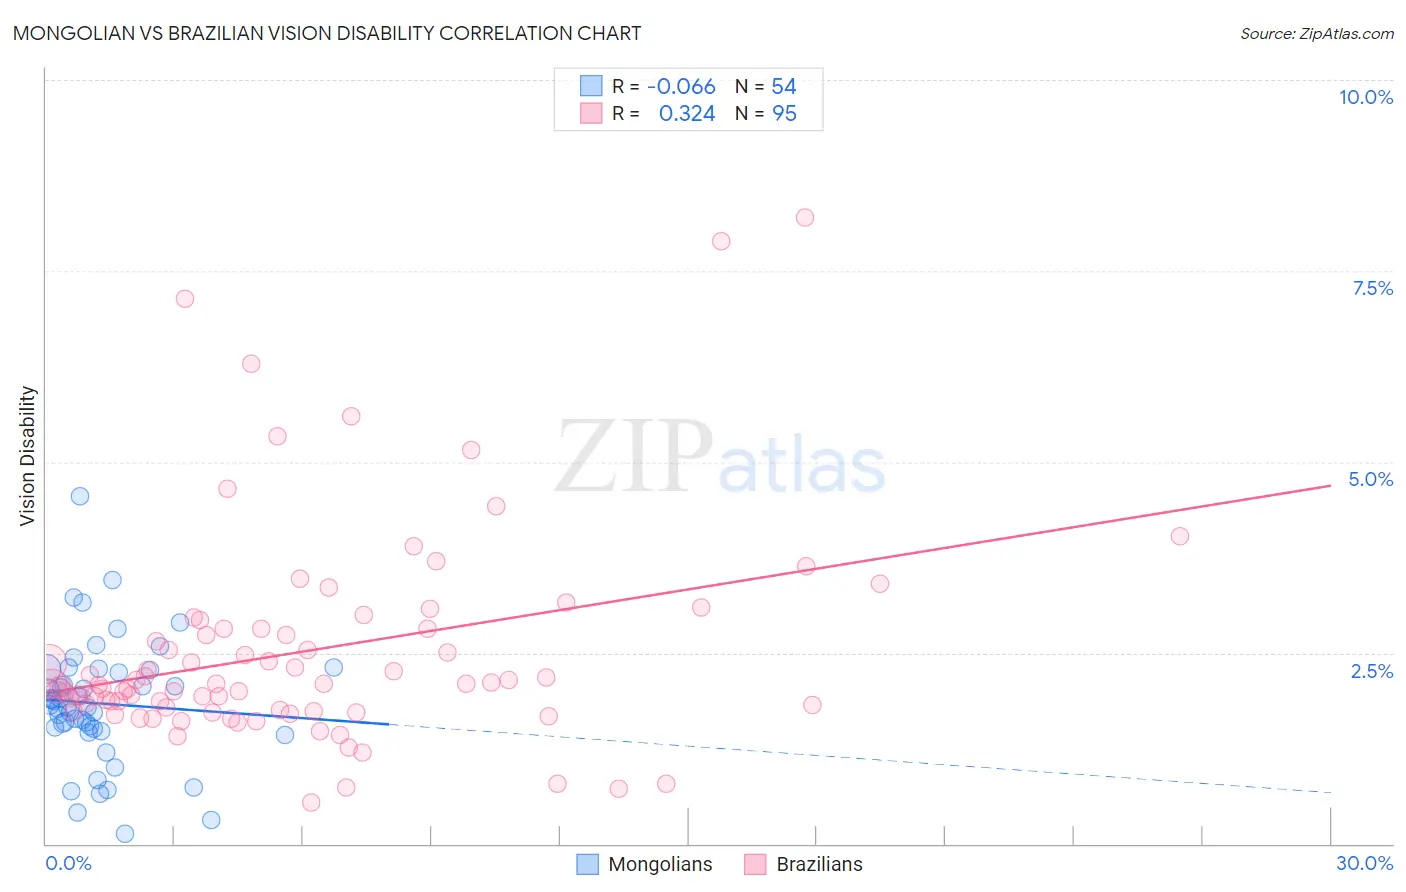
Mongolian vs Brazilian Vision Disability Correlation Chart
The statistical analysis conducted on geographies consisting of 140,326,151 people shows a slight negative correlation between the proportion of Mongolians and percentage of population with vision disability in the United States with a correlation coefficient (R) of -0.066 and weighted average of 1.9%. Similarly, the statistical analysis conducted on geographies consisting of 323,719,841 people shows a mild positive correlation between the proportion of Brazilians and percentage of population with vision disability in the United States with a correlation coefficient (R) of 0.324 and weighted average of 2.1%, a difference of 11.2%.
Vision Disability Correlation Summary
| Measurement | Mongolian | Brazilian |
| Minimum | 0.13% | 0.54% |
| Maximum | 4.5% | 8.2% |
| Range | 4.4% | 7.7% |
| Mean | 1.8% | 2.5% |
| Median | 1.8% | 2.1% |
| Interquartile 25% (IQ1) | 1.5% | 1.7% |
| Interquartile 75% (IQ3) | 2.3% | 2.8% |
| Interquartile Range (IQR) | 0.76% | 1.1% |
| Standard Deviation (Sample) | 0.81% | 1.4% |
| Standard Deviation (Population) | 0.80% | 1.4% |
Similar Demographics by Vision Disability
Demographics Similar to Mongolians by Vision Disability
In terms of vision disability, the demographic groups most similar to Mongolians are Immigrants from Nepal (1.9%, a difference of 0.17%), Egyptian (1.9%, a difference of 0.20%), Immigrants from Malaysia (1.9%, a difference of 0.27%), Luxembourger (1.9%, a difference of 0.27%), and Taiwanese (1.9%, a difference of 0.29%).
| Demographics | Rating | Rank | Vision Disability |
| Immigrants | Lithuania | 99.9 /100 | #24 | Exceptional 1.9% |
| Bulgarians | 99.9 /100 | #25 | Exceptional 1.9% |
| Immigrants | Japan | 99.9 /100 | #26 | Exceptional 1.9% |
| Taiwanese | 99.9 /100 | #27 | Exceptional 1.9% |
| Immigrants | Malaysia | 99.9 /100 | #28 | Exceptional 1.9% |
| Egyptians | 99.9 /100 | #29 | Exceptional 1.9% |
| Immigrants | Nepal | 99.9 /100 | #30 | Exceptional 1.9% |
| Mongolians | 99.9 /100 | #31 | Exceptional 1.9% |
| Luxembourgers | 99.9 /100 | #32 | Exceptional 1.9% |
| Immigrants | Egypt | 99.9 /100 | #33 | Exceptional 1.9% |
| Immigrants | Turkey | 99.8 /100 | #34 | Exceptional 1.9% |
| Immigrants | Australia | 99.8 /100 | #35 | Exceptional 1.9% |
| Cambodians | 99.8 /100 | #36 | Exceptional 2.0% |
| Bhutanese | 99.8 /100 | #37 | Exceptional 2.0% |
| Immigrants | Kuwait | 99.8 /100 | #38 | Exceptional 2.0% |
Demographics Similar to Brazilians by Vision Disability
In terms of vision disability, the demographic groups most similar to Brazilians are Immigrants from Africa (2.1%, a difference of 0.030%), Immigrants from England (2.1%, a difference of 0.040%), Immigrants from Iraq (2.1%, a difference of 0.18%), Immigrants from Bangladesh (2.1%, a difference of 0.23%), and Icelander (2.1%, a difference of 0.27%).
| Demographics | Rating | Rank | Vision Disability |
| Iraqis | 67.7 /100 | #161 | Good 2.1% |
| Hungarians | 67.4 /100 | #162 | Good 2.1% |
| Icelanders | 66.1 /100 | #163 | Good 2.1% |
| Immigrants | Bangladesh | 65.5 /100 | #164 | Good 2.1% |
| Immigrants | Iraq | 64.8 /100 | #165 | Good 2.1% |
| Immigrants | England | 62.8 /100 | #166 | Good 2.1% |
| Immigrants | Africa | 62.6 /100 | #167 | Good 2.1% |
| Brazilians | 62.2 /100 | #168 | Good 2.1% |
| South American Indians | 57.4 /100 | #169 | Average 2.2% |
| Swiss | 55.7 /100 | #170 | Average 2.2% |
| Lebanese | 54.3 /100 | #171 | Average 2.2% |
| Northern Europeans | 50.1 /100 | #172 | Average 2.2% |
| Scandinavians | 50.0 /100 | #173 | Average 2.2% |
| Immigrants | Canada | 50.0 /100 | #174 | Average 2.2% |
| Immigrants | Fiji | 47.6 /100 | #175 | Average 2.2% |