Trinidadian and Tobagonian vs Immigrants from Chile Disability Age Under 5
COMPARE
Trinidadian and Tobagonian
Immigrants from Chile
Disability Age Under 5
Disability Age Under 5 Comparison
Trinidadians and Tobagonians
Immigrants from Chile
1.1%
DISABILITY AGE UNDER 5
98.6/ 100
METRIC RATING
71st/ 347
METRIC RANK
1.3%
DISABILITY AGE UNDER 5
17.2/ 100
METRIC RATING
214th/ 347
METRIC RANK
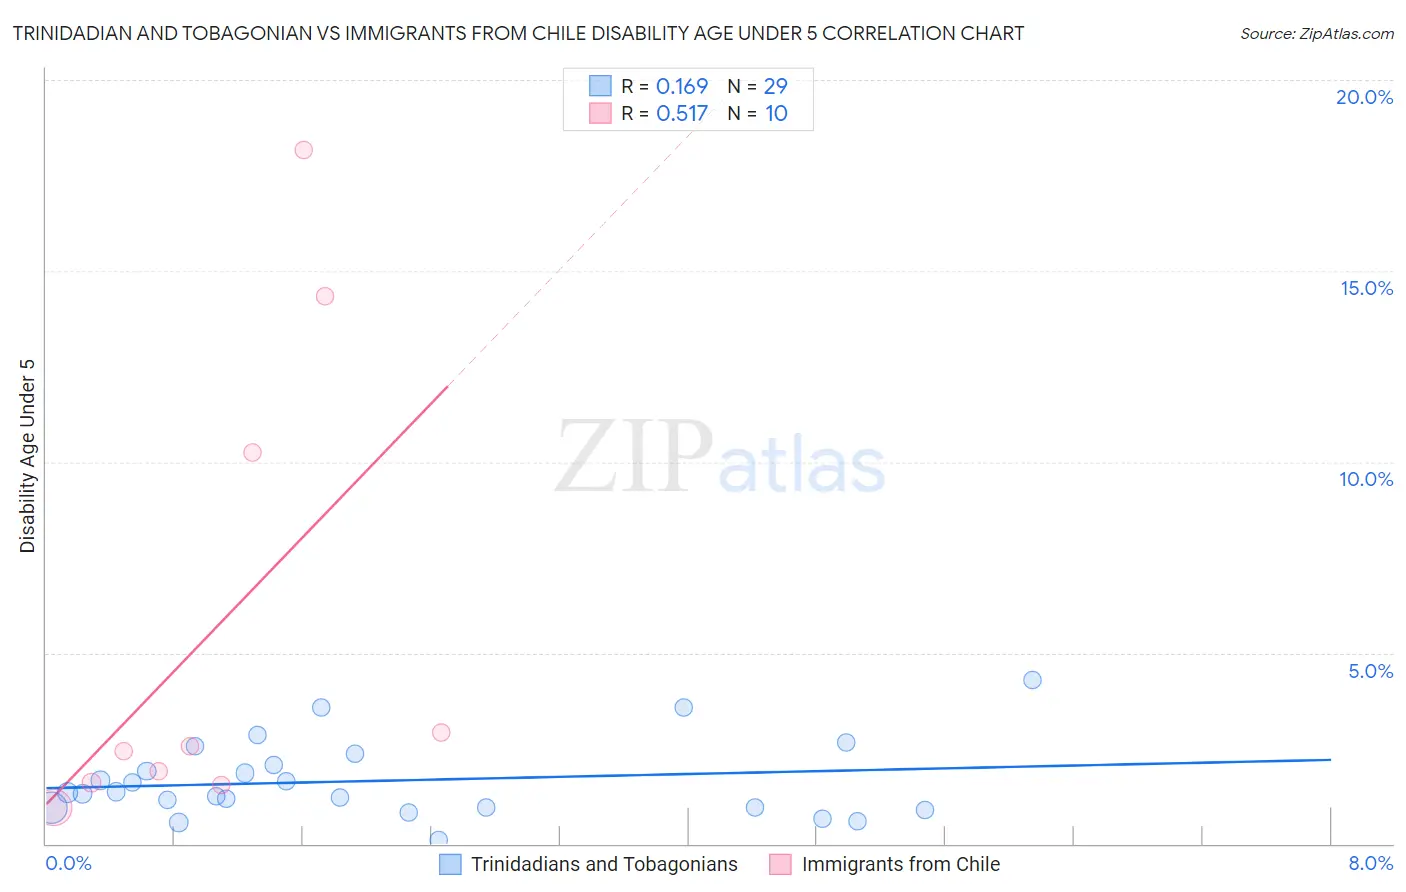
Trinidadian and Tobagonian vs Immigrants from Chile Disability Age Under 5 Correlation Chart
The statistical analysis conducted on geographies consisting of 140,023,510 people shows a poor positive correlation between the proportion of Trinidadians and Tobagonians and percentage of population with a disability under the age of 5 in the United States with a correlation coefficient (R) of 0.169 and weighted average of 1.1%. Similarly, the statistical analysis conducted on geographies consisting of 142,107,365 people shows a substantial positive correlation between the proportion of Immigrants from Chile and percentage of population with a disability under the age of 5 in the United States with a correlation coefficient (R) of 0.517 and weighted average of 1.3%, a difference of 14.6%.
Disability Age Under 5 Correlation Summary
| Measurement | Trinidadian and Tobagonian | Immigrants from Chile |
| Minimum | 0.086% | 0.94% |
| Maximum | 4.3% | 18.2% |
| Range | 4.2% | 17.2% |
| Mean | 1.6% | 5.7% |
| Median | 1.3% | 2.5% |
| Interquartile 25% (IQ1) | 0.94% | 1.6% |
| Interquartile 75% (IQ3) | 2.2% | 10.2% |
| Interquartile Range (IQR) | 1.3% | 8.6% |
| Standard Deviation (Sample) | 1.0% | 6.2% |
| Standard Deviation (Population) | 0.98% | 5.9% |
Similar Demographics by Disability Age Under 5
Demographics Similar to Trinidadians and Tobagonians by Disability Age Under 5
In terms of disability age under 5, the demographic groups most similar to Trinidadians and Tobagonians are Immigrants from Ecuador (1.1%, a difference of 0.060%), Israeli (1.1%, a difference of 0.15%), Burmese (1.1%, a difference of 0.16%), South African (1.1%, a difference of 0.17%), and Immigrants from Belize (1.1%, a difference of 0.21%).
| Demographics | Rating | Rank | Disability Age Under 5 |
| Egyptians | 98.9 /100 | #64 | Exceptional 1.1% |
| Immigrants | Korea | 98.8 /100 | #65 | Exceptional 1.1% |
| Immigrants | Indonesia | 98.7 /100 | #66 | Exceptional 1.1% |
| Immigrants | Belize | 98.7 /100 | #67 | Exceptional 1.1% |
| South Africans | 98.7 /100 | #68 | Exceptional 1.1% |
| Israelis | 98.7 /100 | #69 | Exceptional 1.1% |
| Immigrants | Ecuador | 98.6 /100 | #70 | Exceptional 1.1% |
| Trinidadians and Tobagonians | 98.6 /100 | #71 | Exceptional 1.1% |
| Burmese | 98.5 /100 | #72 | Exceptional 1.1% |
| Immigrants | Sri Lanka | 98.5 /100 | #73 | Exceptional 1.1% |
| Jordanians | 98.5 /100 | #74 | Exceptional 1.1% |
| Immigrants | Pakistan | 98.4 /100 | #75 | Exceptional 1.1% |
| Immigrants | Burma/Myanmar | 98.2 /100 | #76 | Exceptional 1.1% |
| Immigrants | Denmark | 98.1 /100 | #77 | Exceptional 1.1% |
| West Indians | 98.0 /100 | #78 | Exceptional 1.1% |
Demographics Similar to Immigrants from Chile by Disability Age Under 5
In terms of disability age under 5, the demographic groups most similar to Immigrants from Chile are Syrian (1.3%, a difference of 0.17%), Immigrants from Sudan (1.3%, a difference of 0.23%), Chilean (1.3%, a difference of 0.24%), Bangladeshi (1.3%, a difference of 0.27%), and Immigrants from Greece (1.3%, a difference of 0.29%).
| Demographics | Rating | Rank | Disability Age Under 5 |
| Nigerians | 21.2 /100 | #207 | Fair 1.3% |
| Mexicans | 20.8 /100 | #208 | Fair 1.3% |
| Bulgarians | 19.5 /100 | #209 | Poor 1.3% |
| Pakistanis | 19.4 /100 | #210 | Poor 1.3% |
| Immigrants | Greece | 19.1 /100 | #211 | Poor 1.3% |
| Chileans | 18.8 /100 | #212 | Poor 1.3% |
| Immigrants | Sudan | 18.7 /100 | #213 | Poor 1.3% |
| Immigrants | Chile | 17.2 /100 | #214 | Poor 1.3% |
| Syrians | 16.1 /100 | #215 | Poor 1.3% |
| Bangladeshis | 15.5 /100 | #216 | Poor 1.3% |
| Cypriots | 14.9 /100 | #217 | Poor 1.3% |
| Malaysians | 13.2 /100 | #218 | Poor 1.3% |
| Immigrants | Croatia | 11.2 /100 | #219 | Poor 1.3% |
| Serbians | 9.6 /100 | #220 | Tragic 1.3% |
| Sub-Saharan Africans | 8.3 /100 | #221 | Tragic 1.3% |