Immigrants from Western Europe vs Osage Vision Disability
COMPARE
Immigrants from Western Europe
Osage
Vision Disability
Vision Disability Comparison
Immigrants from Western Europe
Osage
2.2%
VISION DISABILITY
41.1/ 100
METRIC RATING
181st/ 347
METRIC RANK
2.7%
VISION DISABILITY
0.0/ 100
METRIC RATING
315th/ 347
METRIC RANK
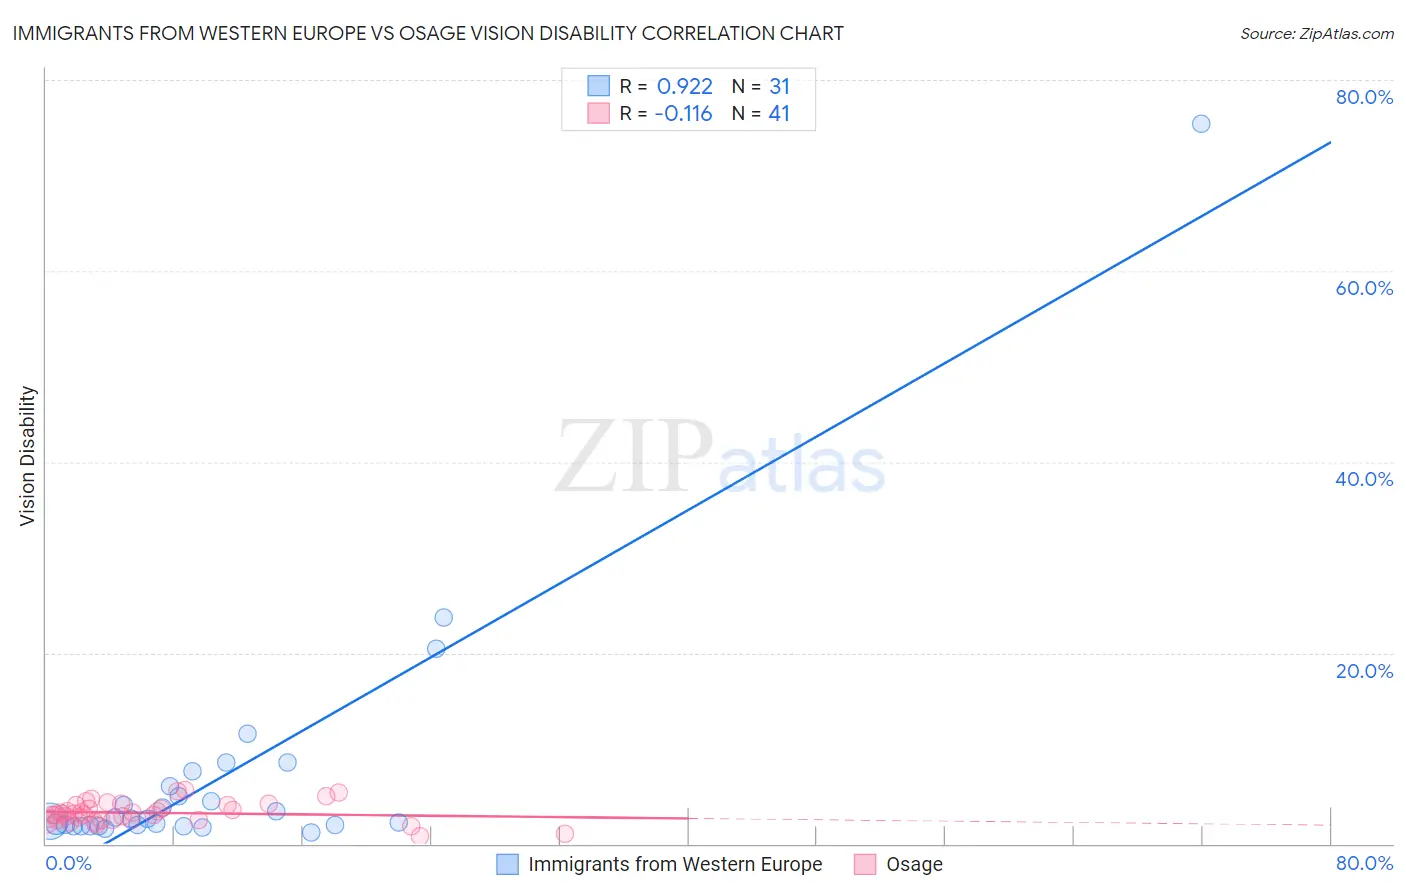
Immigrants from Western Europe vs Osage Vision Disability Correlation Chart
The statistical analysis conducted on geographies consisting of 493,396,041 people shows a near-perfect positive correlation between the proportion of Immigrants from Western Europe and percentage of population with vision disability in the United States with a correlation coefficient (R) of 0.922 and weighted average of 2.2%. Similarly, the statistical analysis conducted on geographies consisting of 91,791,636 people shows a poor negative correlation between the proportion of Osage and percentage of population with vision disability in the United States with a correlation coefficient (R) of -0.116 and weighted average of 2.7%, a difference of 23.1%.
Vision Disability Correlation Summary
| Measurement | Immigrants from Western Europe | Osage |
| Minimum | 1.2% | 0.78% |
| Maximum | 75.4% | 5.7% |
| Range | 74.2% | 4.9% |
| Mean | 7.0% | 3.2% |
| Median | 2.6% | 3.1% |
| Interquartile 25% (IQ1) | 1.9% | 2.5% |
| Interquartile 75% (IQ3) | 6.1% | 4.1% |
| Interquartile Range (IQR) | 4.2% | 1.6% |
| Standard Deviation (Sample) | 13.7% | 1.1% |
| Standard Deviation (Population) | 13.5% | 1.1% |
Similar Demographics by Vision Disability
Demographics Similar to Immigrants from Western Europe by Vision Disability
In terms of vision disability, the demographic groups most similar to Immigrants from Western Europe are Costa Rican (2.2%, a difference of 0.020%), Uruguayan (2.2%, a difference of 0.10%), Immigrants from Burma/Myanmar (2.2%, a difference of 0.21%), Immigrants from North America (2.2%, a difference of 0.22%), and Immigrants from Oceania (2.2%, a difference of 0.26%).
| Demographics | Rating | Rank | Vision Disability |
| Immigrants | Canada | 50.0 /100 | #174 | Average 2.2% |
| Immigrants | Fiji | 47.6 /100 | #175 | Average 2.2% |
| Yugoslavians | 46.5 /100 | #176 | Average 2.2% |
| Slavs | 46.0 /100 | #177 | Average 2.2% |
| Immigrants | Oceania | 45.1 /100 | #178 | Average 2.2% |
| Immigrants | North America | 44.5 /100 | #179 | Average 2.2% |
| Uruguayans | 42.7 /100 | #180 | Average 2.2% |
| Immigrants | Western Europe | 41.1 /100 | #181 | Average 2.2% |
| Costa Ricans | 40.7 /100 | #182 | Average 2.2% |
| Immigrants | Burma/Myanmar | 37.9 /100 | #183 | Fair 2.2% |
| Moroccans | 35.4 /100 | #184 | Fair 2.2% |
| Immigrants | Middle Africa | 33.5 /100 | #185 | Fair 2.2% |
| Native Hawaiians | 33.3 /100 | #186 | Fair 2.2% |
| Immigrants | St. Vincent and the Grenadines | 30.3 /100 | #187 | Fair 2.2% |
| Guyanese | 28.9 /100 | #188 | Fair 2.2% |
Demographics Similar to Osage by Vision Disability
In terms of vision disability, the demographic groups most similar to Osage are Shoshone (2.7%, a difference of 0.43%), Yup'ik (2.7%, a difference of 0.63%), Inupiat (2.7%, a difference of 1.2%), Potawatomi (2.6%, a difference of 1.3%), and American (2.6%, a difference of 1.3%).
| Demographics | Rating | Rank | Vision Disability |
| Arapaho | 0.0 /100 | #308 | Tragic 2.6% |
| Immigrants | Yemen | 0.0 /100 | #309 | Tragic 2.6% |
| Blackfeet | 0.0 /100 | #310 | Tragic 2.6% |
| Dominicans | 0.0 /100 | #311 | Tragic 2.6% |
| Americans | 0.0 /100 | #312 | Tragic 2.6% |
| Potawatomi | 0.0 /100 | #313 | Tragic 2.6% |
| Inupiat | 0.0 /100 | #314 | Tragic 2.7% |
| Osage | 0.0 /100 | #315 | Tragic 2.7% |
| Shoshone | 0.0 /100 | #316 | Tragic 2.7% |
| Yup'ik | 0.0 /100 | #317 | Tragic 2.7% |
| Alaska Natives | 0.0 /100 | #318 | Tragic 2.7% |
| Tohono O'odham | 0.0 /100 | #319 | Tragic 2.8% |
| Blacks/African Americans | 0.0 /100 | #320 | Tragic 2.8% |
| Comanche | 0.0 /100 | #321 | Tragic 2.8% |
| Paiute | 0.0 /100 | #322 | Tragic 2.9% |