Alaska Native vs Osage 8th Grade
COMPARE
Alaska Native
Osage
8th Grade
8th Grade Comparison
Alaska Natives
Osage
97.0%
8TH GRADE
100.0/ 100
METRIC RATING
35th/ 347
METRIC RANK
96.4%
8TH GRADE
98.7/ 100
METRIC RATING
97th/ 347
METRIC RANK
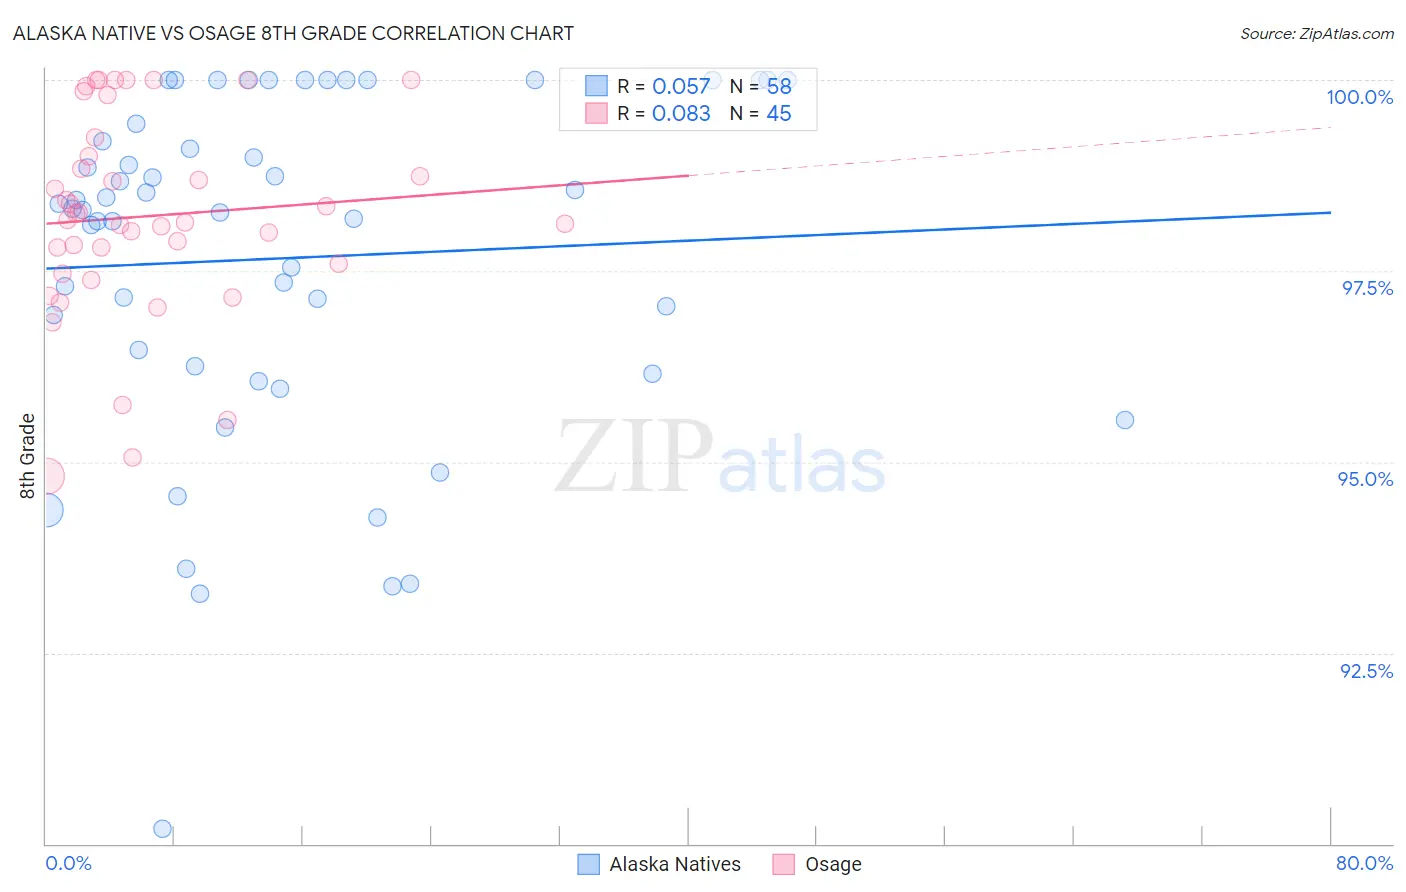
Alaska Native vs Osage 8th Grade Correlation Chart
The statistical analysis conducted on geographies consisting of 76,778,057 people shows a slight positive correlation between the proportion of Alaska Natives and percentage of population with at least 8th grade education in the United States with a correlation coefficient (R) of 0.057 and weighted average of 97.0%. Similarly, the statistical analysis conducted on geographies consisting of 91,808,929 people shows a slight positive correlation between the proportion of Osage and percentage of population with at least 8th grade education in the United States with a correlation coefficient (R) of 0.083 and weighted average of 96.4%, a difference of 0.62%.
8th Grade Correlation Summary
| Measurement | Alaska Native | Osage |
| Minimum | 90.2% | 94.8% |
| Maximum | 100.0% | 100.0% |
| Range | 9.8% | 5.2% |
| Mean | 97.7% | 98.2% |
| Median | 98.3% | 98.2% |
| Interquartile 25% (IQ1) | 96.2% | 97.5% |
| Interquartile 75% (IQ3) | 99.4% | 99.1% |
| Interquartile Range (IQR) | 3.2% | 1.6% |
| Standard Deviation (Sample) | 2.2% | 1.3% |
| Standard Deviation (Population) | 2.2% | 1.3% |
Similar Demographics by 8th Grade
Demographics Similar to Alaska Natives by 8th Grade
In terms of 8th grade, the demographic groups most similar to Alaska Natives are Luxembourger (97.0%, a difference of 0.010%), Belgian (97.0%, a difference of 0.010%), Latvian (97.0%, a difference of 0.010%), British (97.0%, a difference of 0.030%), and Hungarian (97.0%, a difference of 0.030%).
| Demographics | Rating | Rank | 8th Grade |
| Italians | 100.0 /100 | #28 | Exceptional 97.1% |
| Europeans | 100.0 /100 | #29 | Exceptional 97.1% |
| Sioux | 100.0 /100 | #30 | Exceptional 97.1% |
| Chippewa | 100.0 /100 | #31 | Exceptional 97.1% |
| Yup'ik | 100.0 /100 | #32 | Exceptional 97.0% |
| Swiss | 100.0 /100 | #33 | Exceptional 97.0% |
| Luxembourgers | 100.0 /100 | #34 | Exceptional 97.0% |
| Alaska Natives | 100.0 /100 | #35 | Exceptional 97.0% |
| Belgians | 100.0 /100 | #36 | Exceptional 97.0% |
| Latvians | 100.0 /100 | #37 | Exceptional 97.0% |
| British | 100.0 /100 | #38 | Exceptional 97.0% |
| Hungarians | 100.0 /100 | #39 | Exceptional 97.0% |
| Inupiat | 100.0 /100 | #40 | Exceptional 97.0% |
| Eastern Europeans | 100.0 /100 | #41 | Exceptional 97.0% |
| Chinese | 100.0 /100 | #42 | Exceptional 96.9% |
Demographics Similar to Osage by 8th Grade
In terms of 8th grade, the demographic groups most similar to Osage are Potawatomi (96.4%, a difference of 0.0%), Immigrants from Germany (96.4%, a difference of 0.0%), Cree (96.4%, a difference of 0.0%), Immigrants from Singapore (96.4%, a difference of 0.010%), and German Russian (96.4%, a difference of 0.010%).
| Demographics | Rating | Rank | 8th Grade |
| Immigrants | Sweden | 98.9 /100 | #90 | Exceptional 96.4% |
| Thais | 98.9 /100 | #91 | Exceptional 96.4% |
| Menominee | 98.9 /100 | #92 | Exceptional 96.4% |
| Immigrants | Denmark | 98.8 /100 | #93 | Exceptional 96.4% |
| Immigrants | Singapore | 98.8 /100 | #94 | Exceptional 96.4% |
| German Russians | 98.8 /100 | #95 | Exceptional 96.4% |
| Potawatomi | 98.7 /100 | #96 | Exceptional 96.4% |
| Osage | 98.7 /100 | #97 | Exceptional 96.4% |
| Immigrants | Germany | 98.7 /100 | #98 | Exceptional 96.4% |
| Cree | 98.6 /100 | #99 | Exceptional 96.4% |
| Immigrants | Czechoslovakia | 98.6 /100 | #100 | Exceptional 96.4% |
| Bhutanese | 98.2 /100 | #101 | Exceptional 96.4% |
| South Africans | 98.2 /100 | #102 | Exceptional 96.4% |
| Immigrants | Saudi Arabia | 98.0 /100 | #103 | Exceptional 96.3% |
| Kiowa | 98.0 /100 | #104 | Exceptional 96.3% |