Immigrants from Kenya vs Immigrants from Poland Disability Age 65 to 74
COMPARE
Immigrants from Kenya
Immigrants from Poland
Disability Age 65 to 74
Disability Age 65 to 74 Comparison
Immigrants from Kenya
Immigrants from Poland
23.8%
DISABILITY AGE 65 TO 74
19.6/ 100
METRIC RATING
209th/ 347
METRIC RANK
21.8%
DISABILITY AGE 65 TO 74
99.0/ 100
METRIC RATING
77th/ 347
METRIC RANK
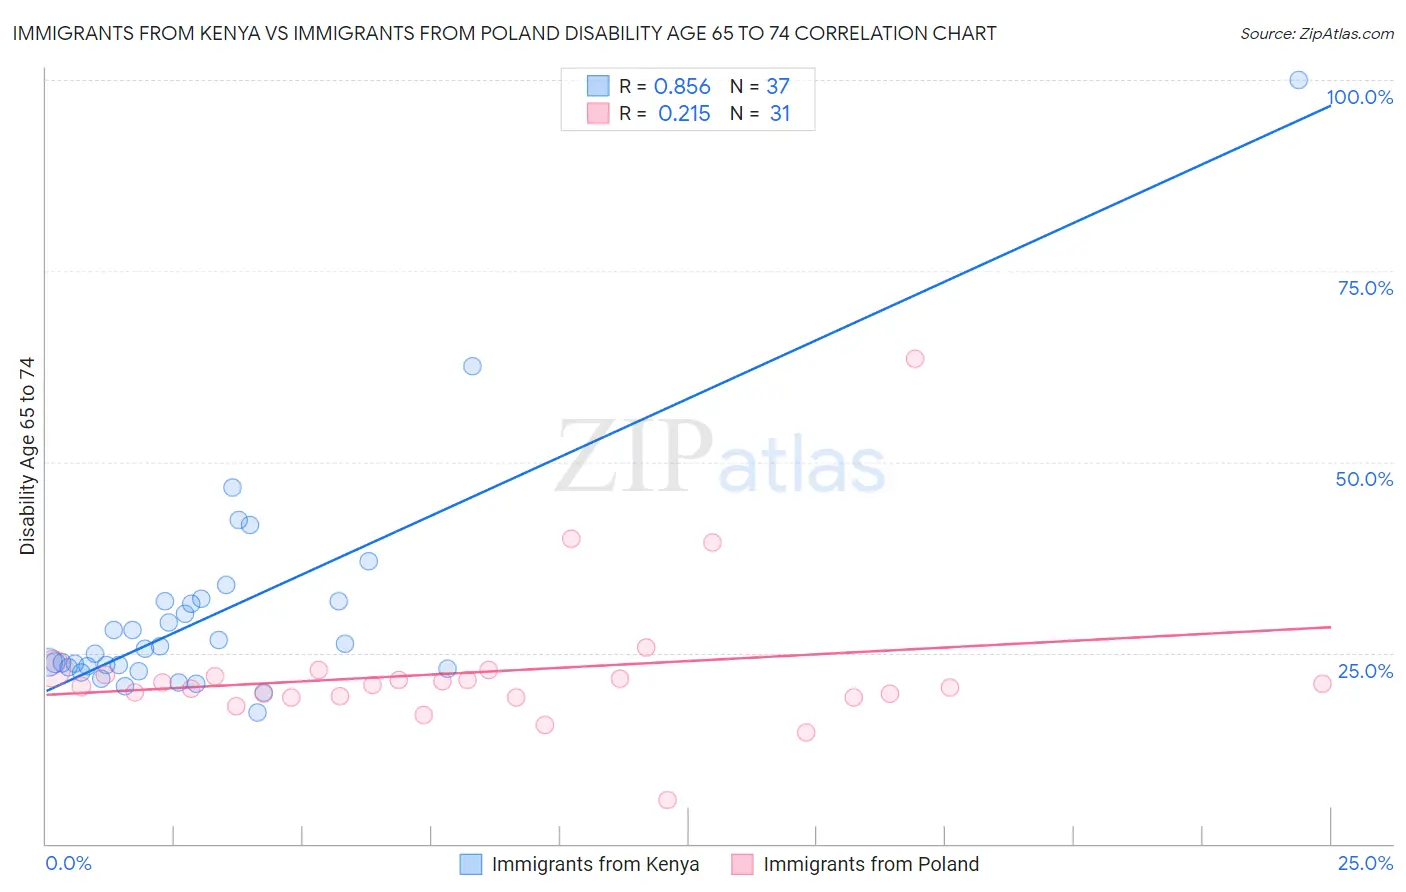
Immigrants from Kenya vs Immigrants from Poland Disability Age 65 to 74 Correlation Chart
The statistical analysis conducted on geographies consisting of 217,828,278 people shows a very strong positive correlation between the proportion of Immigrants from Kenya and percentage of population with a disability between the ages 65 and 75 in the United States with a correlation coefficient (R) of 0.856 and weighted average of 23.8%. Similarly, the statistical analysis conducted on geographies consisting of 304,591,665 people shows a weak positive correlation between the proportion of Immigrants from Poland and percentage of population with a disability between the ages 65 and 75 in the United States with a correlation coefficient (R) of 0.215 and weighted average of 21.8%, a difference of 9.4%.
Disability Age 65 to 74 Correlation Summary
| Measurement | Immigrants from Kenya | Immigrants from Poland |
| Minimum | 17.1% | 5.8% |
| Maximum | 100.0% | 63.5% |
| Range | 82.9% | 57.7% |
| Mean | 30.1% | 22.5% |
| Median | 25.6% | 20.8% |
| Interquartile 25% (IQ1) | 23.0% | 19.2% |
| Interquartile 75% (IQ3) | 31.8% | 22.1% |
| Interquartile Range (IQR) | 8.8% | 2.9% |
| Standard Deviation (Sample) | 14.7% | 9.7% |
| Standard Deviation (Population) | 14.5% | 9.5% |
Similar Demographics by Disability Age 65 to 74
Demographics Similar to Immigrants from Kenya by Disability Age 65 to 74
In terms of disability age 65 to 74, the demographic groups most similar to Immigrants from Kenya are Immigrants from Barbados (23.8%, a difference of 0.0%), Immigrants from Sudan (23.8%, a difference of 0.050%), Tongan (23.8%, a difference of 0.11%), Immigrants from Jamaica (23.8%, a difference of 0.11%), and Immigrants from Grenada (23.8%, a difference of 0.22%).
| Demographics | Rating | Rank | Disability Age 65 to 74 |
| Immigrants | Bahamas | 23.3 /100 | #202 | Fair 23.7% |
| Kenyans | 23.2 /100 | #203 | Fair 23.7% |
| Immigrants | Grenada | 22.1 /100 | #204 | Fair 23.8% |
| Tongans | 20.8 /100 | #205 | Fair 23.8% |
| Immigrants | Jamaica | 20.7 /100 | #206 | Fair 23.8% |
| Immigrants | Sudan | 20.1 /100 | #207 | Fair 23.8% |
| Immigrants | Barbados | 19.6 /100 | #208 | Poor 23.8% |
| Immigrants | Kenya | 19.6 /100 | #209 | Poor 23.8% |
| Trinidadians and Tobagonians | 16.4 /100 | #210 | Poor 23.9% |
| Immigrants | West Indies | 15.9 /100 | #211 | Poor 23.9% |
| French | 15.7 /100 | #212 | Poor 23.9% |
| Nicaraguans | 14.3 /100 | #213 | Poor 23.9% |
| Immigrants | Oceania | 13.6 /100 | #214 | Poor 24.0% |
| Pennsylvania Germans | 13.3 /100 | #215 | Poor 24.0% |
| Jamaicans | 12.2 /100 | #216 | Poor 24.0% |
Demographics Similar to Immigrants from Poland by Disability Age 65 to 74
In terms of disability age 65 to 74, the demographic groups most similar to Immigrants from Poland are Greek (21.8%, a difference of 0.060%), Immigrants from Eastern Europe (21.8%, a difference of 0.060%), Venezuelan (21.8%, a difference of 0.060%), Mongolian (21.8%, a difference of 0.070%), and Immigrants from Norway (21.8%, a difference of 0.070%).
| Demographics | Rating | Rank | Disability Age 65 to 74 |
| Chinese | 99.2 /100 | #70 | Exceptional 21.7% |
| Immigrants | Belarus | 99.2 /100 | #71 | Exceptional 21.7% |
| Immigrants | Hungary | 99.2 /100 | #72 | Exceptional 21.7% |
| Immigrants | Venezuela | 99.0 /100 | #73 | Exceptional 21.8% |
| Cambodians | 99.0 /100 | #74 | Exceptional 21.8% |
| Mongolians | 99.0 /100 | #75 | Exceptional 21.8% |
| Greeks | 99.0 /100 | #76 | Exceptional 21.8% |
| Immigrants | Poland | 99.0 /100 | #77 | Exceptional 21.8% |
| Immigrants | Eastern Europe | 99.0 /100 | #78 | Exceptional 21.8% |
| Venezuelans | 99.0 /100 | #79 | Exceptional 21.8% |
| Immigrants | Norway | 98.9 /100 | #80 | Exceptional 21.8% |
| Croatians | 98.9 /100 | #81 | Exceptional 21.8% |
| Immigrants | Indonesia | 98.7 /100 | #82 | Exceptional 21.9% |
| Immigrants | Brazil | 98.5 /100 | #83 | Exceptional 21.9% |
| Immigrants | Spain | 98.5 /100 | #84 | Exceptional 21.9% |