Alaska Native vs Sierra Leonean Disability Age 65 to 74
COMPARE
Alaska Native
Sierra Leonean
Disability Age 65 to 74
Disability Age 65 to 74 Comparison
Alaska Natives
Sierra Leoneans
30.6%
DISABILITY AGE 65 TO 74
0.0/ 100
METRIC RATING
334th/ 347
METRIC RANK
23.2%
DISABILITY AGE 65 TO 74
60.9/ 100
METRIC RATING
164th/ 347
METRIC RANK
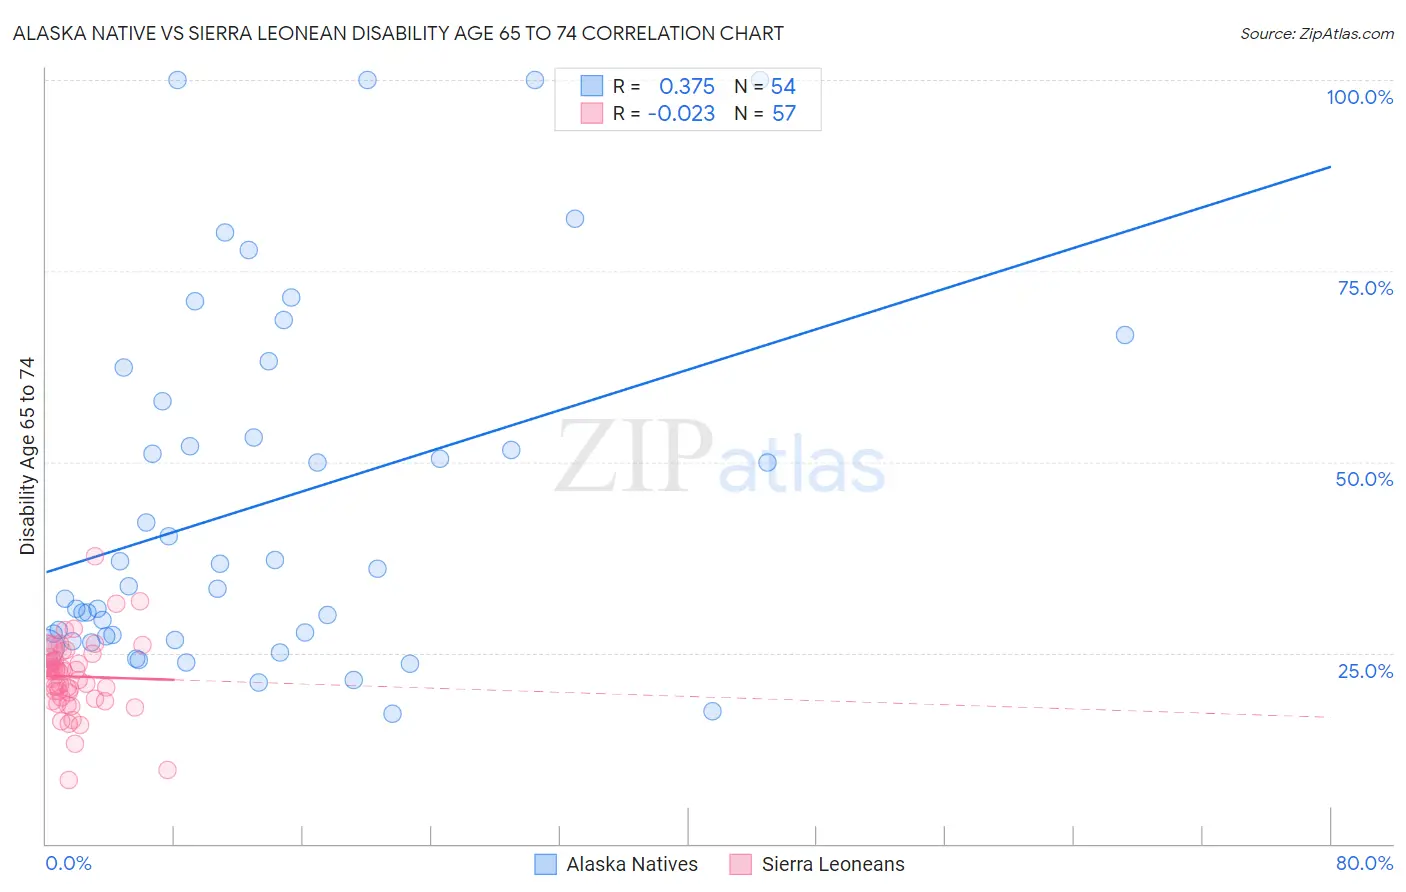
Alaska Native vs Sierra Leonean Disability Age 65 to 74 Correlation Chart
The statistical analysis conducted on geographies consisting of 76,681,406 people shows a mild positive correlation between the proportion of Alaska Natives and percentage of population with a disability between the ages 65 and 75 in the United States with a correlation coefficient (R) of 0.375 and weighted average of 30.6%. Similarly, the statistical analysis conducted on geographies consisting of 83,282,837 people shows no correlation between the proportion of Sierra Leoneans and percentage of population with a disability between the ages 65 and 75 in the United States with a correlation coefficient (R) of -0.023 and weighted average of 23.2%, a difference of 32.1%.
Disability Age 65 to 74 Correlation Summary
| Measurement | Alaska Native | Sierra Leonean |
| Minimum | 16.9% | 8.4% |
| Maximum | 100.0% | 37.6% |
| Range | 83.1% | 29.2% |
| Mean | 44.6% | 21.9% |
| Median | 34.9% | 22.6% |
| Interquartile 25% (IQ1) | 27.2% | 19.0% |
| Interquartile 75% (IQ3) | 58.0% | 24.6% |
| Interquartile Range (IQR) | 30.8% | 5.6% |
| Standard Deviation (Sample) | 23.4% | 4.9% |
| Standard Deviation (Population) | 23.2% | 4.9% |
Similar Demographics by Disability Age 65 to 74
Demographics Similar to Alaska Natives by Disability Age 65 to 74
In terms of disability age 65 to 74, the demographic groups most similar to Alaska Natives are Colville (30.5%, a difference of 0.25%), Native/Alaskan (30.4%, a difference of 0.77%), Chickasaw (30.2%, a difference of 1.4%), Creek (30.2%, a difference of 1.4%), and Choctaw (30.2%, a difference of 1.4%).
| Demographics | Rating | Rank | Disability Age 65 to 74 |
| Apache | 0.0 /100 | #327 | Tragic 29.7% |
| Hopi | 0.0 /100 | #328 | Tragic 30.0% |
| Choctaw | 0.0 /100 | #329 | Tragic 30.2% |
| Creek | 0.0 /100 | #330 | Tragic 30.2% |
| Chickasaw | 0.0 /100 | #331 | Tragic 30.2% |
| Natives/Alaskans | 0.0 /100 | #332 | Tragic 30.4% |
| Colville | 0.0 /100 | #333 | Tragic 30.5% |
| Alaska Natives | 0.0 /100 | #334 | Tragic 30.6% |
| Cheyenne | 0.0 /100 | #335 | Tragic 31.1% |
| Yuman | 0.0 /100 | #336 | Tragic 31.5% |
| Houma | 0.0 /100 | #337 | Tragic 32.3% |
| Alaskan Athabascans | 0.0 /100 | #338 | Tragic 32.4% |
| Kiowa | 0.0 /100 | #339 | Tragic 32.6% |
| Lumbee | 0.0 /100 | #340 | Tragic 32.7% |
| Tsimshian | 0.0 /100 | #341 | Tragic 32.9% |
Demographics Similar to Sierra Leoneans by Disability Age 65 to 74
In terms of disability age 65 to 74, the demographic groups most similar to Sierra Leoneans are Immigrants from Philippines (23.2%, a difference of 0.010%), Vietnamese (23.2%, a difference of 0.010%), European (23.2%, a difference of 0.020%), Immigrants from Afghanistan (23.2%, a difference of 0.020%), and Immigrants from Cameroon (23.1%, a difference of 0.18%).
| Demographics | Rating | Rank | Disability Age 65 to 74 |
| Czechoslovakians | 72.4 /100 | #157 | Good 23.0% |
| Immigrants | Vietnam | 69.1 /100 | #158 | Good 23.1% |
| South American Indians | 65.5 /100 | #159 | Good 23.1% |
| Koreans | 64.2 /100 | #160 | Good 23.1% |
| Immigrants | Cameroon | 63.8 /100 | #161 | Good 23.1% |
| Europeans | 61.2 /100 | #162 | Good 23.2% |
| Immigrants | Philippines | 61.1 /100 | #163 | Good 23.2% |
| Sierra Leoneans | 60.9 /100 | #164 | Good 23.2% |
| Vietnamese | 60.8 /100 | #165 | Good 23.2% |
| Immigrants | Afghanistan | 60.5 /100 | #166 | Good 23.2% |
| Immigrants | Bosnia and Herzegovina | 57.6 /100 | #167 | Average 23.2% |
| Pakistanis | 57.0 /100 | #168 | Average 23.2% |
| Icelanders | 54.3 /100 | #169 | Average 23.3% |
| Moroccans | 54.2 /100 | #170 | Average 23.3% |
| Cubans | 51.9 /100 | #171 | Average 23.3% |