Alaska Native vs Mexican American Indian Disability Age 35 to 64
COMPARE
Alaska Native
Mexican American Indian
Disability Age 35 to 64
Disability Age 35 to 64 Comparison
Alaska Natives
Mexican American Indians
14.5%
DISABILITY AGE 35 TO 64
0.0/ 100
METRIC RATING
315th/ 347
METRIC RANK
12.0%
DISABILITY AGE 35 TO 64
3.2/ 100
METRIC RATING
241st/ 347
METRIC RANK
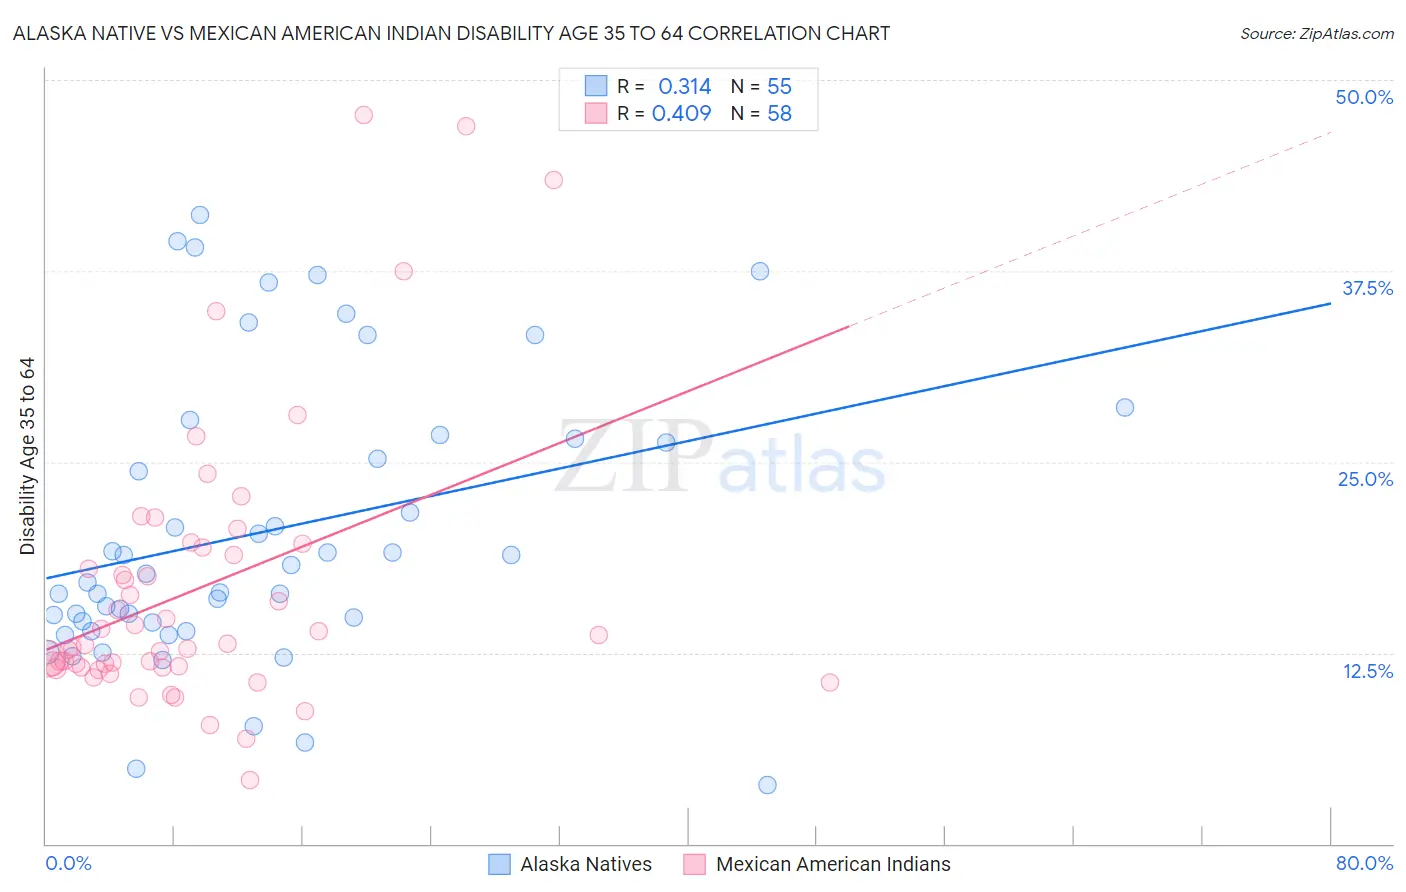
Alaska Native vs Mexican American Indian Disability Age 35 to 64 Correlation Chart
The statistical analysis conducted on geographies consisting of 76,743,337 people shows a mild positive correlation between the proportion of Alaska Natives and percentage of population with a disability between the ages 34 and 64 in the United States with a correlation coefficient (R) of 0.314 and weighted average of 14.5%. Similarly, the statistical analysis conducted on geographies consisting of 317,491,587 people shows a moderate positive correlation between the proportion of Mexican American Indians and percentage of population with a disability between the ages 34 and 64 in the United States with a correlation coefficient (R) of 0.409 and weighted average of 12.0%, a difference of 20.1%.
Disability Age 35 to 64 Correlation Summary
| Measurement | Alaska Native | Mexican American Indian |
| Minimum | 3.8% | 4.2% |
| Maximum | 41.2% | 47.7% |
| Range | 37.3% | 43.6% |
| Mean | 20.5% | 16.7% |
| Median | 17.7% | 13.1% |
| Interquartile 25% (IQ1) | 14.5% | 11.6% |
| Interquartile 75% (IQ3) | 26.5% | 19.4% |
| Interquartile Range (IQR) | 12.1% | 7.8% |
| Standard Deviation (Sample) | 9.3% | 9.3% |
| Standard Deviation (Population) | 9.2% | 9.2% |
Similar Demographics by Disability Age 35 to 64
Demographics Similar to Alaska Natives by Disability Age 35 to 64
In terms of disability age 35 to 64, the demographic groups most similar to Alaska Natives are Shoshone (14.5%, a difference of 0.020%), Osage (14.5%, a difference of 0.19%), Iroquois (14.4%, a difference of 0.77%), Crow (14.6%, a difference of 1.1%), and Ottawa (14.6%, a difference of 1.1%).
| Demographics | Rating | Rank | Disability Age 35 to 64 |
| Inupiat | 0.0 /100 | #308 | Tragic 14.1% |
| Cree | 0.0 /100 | #309 | Tragic 14.1% |
| Cape Verdeans | 0.0 /100 | #310 | Tragic 14.1% |
| Immigrants | Azores | 0.0 /100 | #311 | Tragic 14.3% |
| Paiute | 0.0 /100 | #312 | Tragic 14.3% |
| Iroquois | 0.0 /100 | #313 | Tragic 14.4% |
| Shoshone | 0.0 /100 | #314 | Tragic 14.5% |
| Alaska Natives | 0.0 /100 | #315 | Tragic 14.5% |
| Osage | 0.0 /100 | #316 | Tragic 14.5% |
| Crow | 0.0 /100 | #317 | Tragic 14.6% |
| Ottawa | 0.0 /100 | #318 | Tragic 14.6% |
| Immigrants | Cabo Verde | 0.0 /100 | #319 | Tragic 14.7% |
| Blacks/African Americans | 0.0 /100 | #320 | Tragic 14.7% |
| Comanche | 0.0 /100 | #321 | Tragic 14.7% |
| Potawatomi | 0.0 /100 | #322 | Tragic 14.8% |
Demographics Similar to Mexican American Indians by Disability Age 35 to 64
In terms of disability age 35 to 64, the demographic groups most similar to Mexican American Indians are Immigrants from Western Africa (12.0%, a difference of 0.030%), Immigrants from Thailand (12.0%, a difference of 0.030%), Samoan (12.1%, a difference of 0.27%), West Indian (12.0%, a difference of 0.29%), and Slovak (12.1%, a difference of 0.37%).
| Demographics | Rating | Rank | Disability Age 35 to 64 |
| Portuguese | 4.9 /100 | #234 | Tragic 11.9% |
| Belizeans | 4.5 /100 | #235 | Tragic 12.0% |
| Immigrants | Middle Africa | 4.5 /100 | #236 | Tragic 12.0% |
| Immigrants | Cambodia | 3.9 /100 | #237 | Tragic 12.0% |
| West Indians | 3.7 /100 | #238 | Tragic 12.0% |
| Immigrants | Western Africa | 3.3 /100 | #239 | Tragic 12.0% |
| Immigrants | Thailand | 3.3 /100 | #240 | Tragic 12.0% |
| Mexican American Indians | 3.2 /100 | #241 | Tragic 12.0% |
| Samoans | 2.8 /100 | #242 | Tragic 12.1% |
| Slovaks | 2.7 /100 | #243 | Tragic 12.1% |
| Finns | 2.3 /100 | #244 | Tragic 12.1% |
| Immigrants | Mexico | 2.2 /100 | #245 | Tragic 12.1% |
| Guamanians/Chamorros | 1.4 /100 | #246 | Tragic 12.2% |
| Immigrants | Senegal | 1.3 /100 | #247 | Tragic 12.2% |
| Spaniards | 1.3 /100 | #248 | Tragic 12.3% |