African vs Pima Vision Disability
COMPARE
African
Pima
Vision Disability
Vision Disability Comparison
Africans
Pima
2.5%
VISION DISABILITY
0.0/ 100
METRIC RATING
300th/ 347
METRIC RANK
3.3%
VISION DISABILITY
0.0/ 100
METRIC RATING
343rd/ 347
METRIC RANK
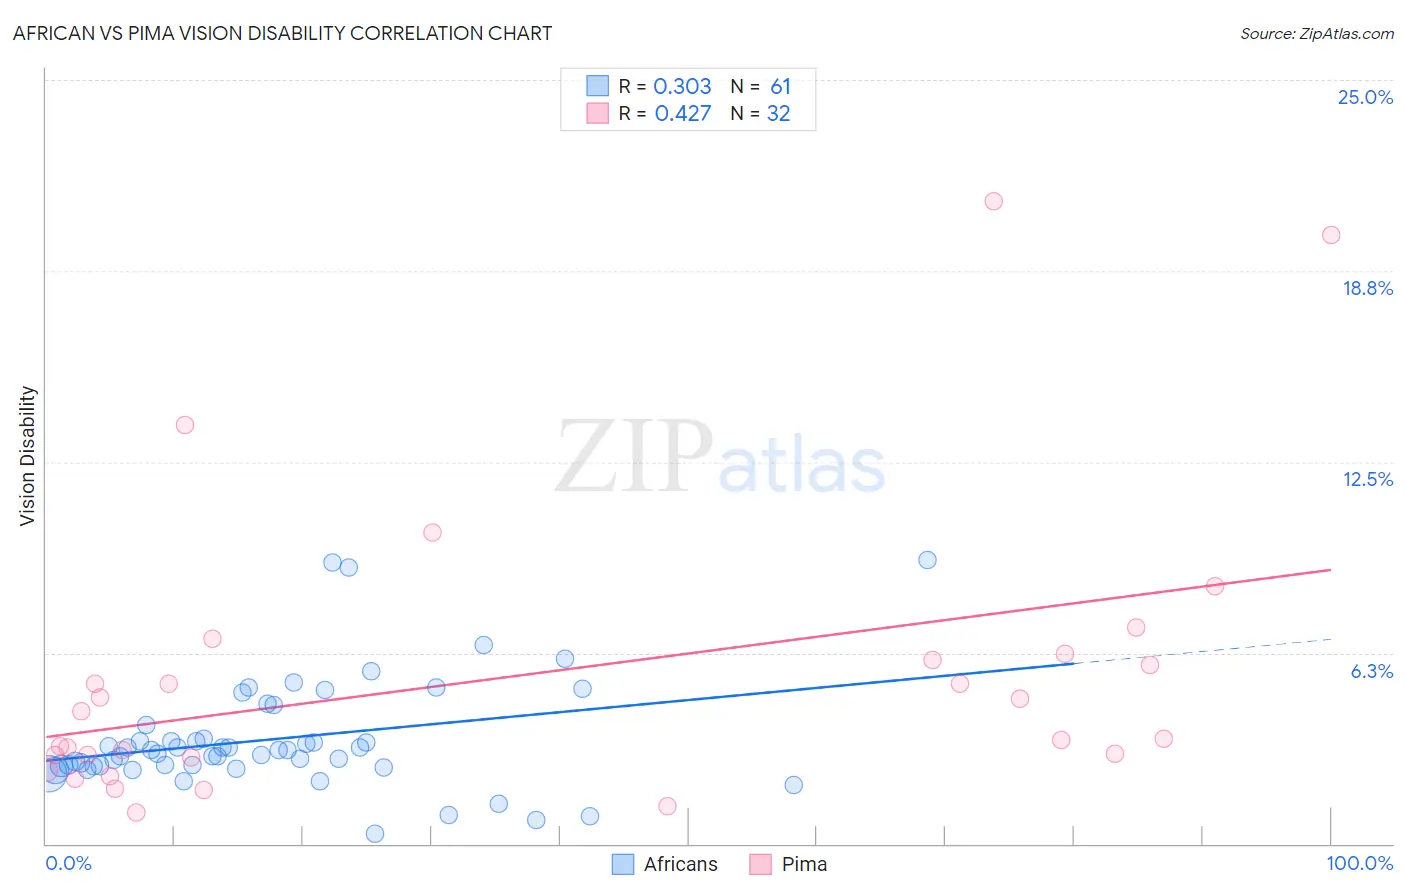
African vs Pima Vision Disability Correlation Chart
The statistical analysis conducted on geographies consisting of 469,580,037 people shows a mild positive correlation between the proportion of Africans and percentage of population with vision disability in the United States with a correlation coefficient (R) of 0.303 and weighted average of 2.5%. Similarly, the statistical analysis conducted on geographies consisting of 61,535,675 people shows a moderate positive correlation between the proportion of Pima and percentage of population with vision disability in the United States with a correlation coefficient (R) of 0.427 and weighted average of 3.3%, a difference of 31.2%.
Vision Disability Correlation Summary
| Measurement | African | Pima |
| Minimum | 0.34% | 1.0% |
| Maximum | 9.3% | 21.0% |
| Range | 9.0% | 20.0% |
| Mean | 3.4% | 5.5% |
| Median | 3.1% | 3.9% |
| Interquartile 25% (IQ1) | 2.5% | 2.9% |
| Interquartile 75% (IQ3) | 3.7% | 6.1% |
| Interquartile Range (IQR) | 1.1% | 3.3% |
| Standard Deviation (Sample) | 1.8% | 4.8% |
| Standard Deviation (Population) | 1.8% | 4.7% |
Similar Demographics by Vision Disability
Demographics Similar to Africans by Vision Disability
In terms of vision disability, the demographic groups most similar to Africans are Menominee (2.5%, a difference of 0.18%), Cree (2.5%, a difference of 0.20%), Mexican (2.5%, a difference of 0.24%), Immigrants from Dominica (2.5%, a difference of 0.37%), and Immigrants from Mexico (2.5%, a difference of 1.1%).
| Demographics | Rating | Rank | Vision Disability |
| Yaqui | 0.0 /100 | #293 | Tragic 2.5% |
| Ottawa | 0.0 /100 | #294 | Tragic 2.5% |
| Delaware | 0.0 /100 | #295 | Tragic 2.5% |
| Immigrants | Mexico | 0.0 /100 | #296 | Tragic 2.5% |
| Immigrants | Dominica | 0.0 /100 | #297 | Tragic 2.5% |
| Mexicans | 0.0 /100 | #298 | Tragic 2.5% |
| Cree | 0.0 /100 | #299 | Tragic 2.5% |
| Africans | 0.0 /100 | #300 | Tragic 2.5% |
| Menominee | 0.0 /100 | #301 | Tragic 2.5% |
| Spanish American Indians | 0.0 /100 | #302 | Tragic 2.6% |
| Immigrants | Cabo Verde | 0.0 /100 | #303 | Tragic 2.6% |
| Aleuts | 0.0 /100 | #304 | Tragic 2.6% |
| Hispanics or Latinos | 0.0 /100 | #305 | Tragic 2.6% |
| Iroquois | 0.0 /100 | #306 | Tragic 2.6% |
| Immigrants | Dominican Republic | 0.0 /100 | #307 | Tragic 2.6% |
Demographics Similar to Pima by Vision Disability
In terms of vision disability, the demographic groups most similar to Pima are Pueblo (3.3%, a difference of 0.030%), Choctaw (3.3%, a difference of 1.1%), Lumbee (3.4%, a difference of 1.6%), Kiowa (3.3%, a difference of 2.5%), and Houma (3.4%, a difference of 3.3%).
| Demographics | Rating | Rank | Vision Disability |
| Cajuns | 0.0 /100 | #333 | Tragic 3.1% |
| Cheyenne | 0.0 /100 | #334 | Tragic 3.1% |
| Navajo | 0.0 /100 | #335 | Tragic 3.1% |
| Alaskan Athabascans | 0.0 /100 | #336 | Tragic 3.1% |
| Dutch West Indians | 0.0 /100 | #337 | Tragic 3.2% |
| Chickasaw | 0.0 /100 | #338 | Tragic 3.2% |
| Tsimshian | 0.0 /100 | #339 | Tragic 3.2% |
| Creek | 0.0 /100 | #340 | Tragic 3.2% |
| Kiowa | 0.0 /100 | #341 | Tragic 3.3% |
| Choctaw | 0.0 /100 | #342 | Tragic 3.3% |
| Pima | 0.0 /100 | #343 | Tragic 3.3% |
| Pueblo | 0.0 /100 | #344 | Tragic 3.3% |
| Lumbee | 0.0 /100 | #345 | Tragic 3.4% |
| Houma | 0.0 /100 | #346 | Tragic 3.4% |
| Puerto Ricans | 0.0 /100 | #347 | Tragic 3.9% |