African vs Ghanaian Vision Disability
COMPARE
African
Ghanaian
Vision Disability
Vision Disability Comparison
Africans
Ghanaians
2.5%
VISION DISABILITY
0.0/ 100
METRIC RATING
300th/ 347
METRIC RANK
2.2%
VISION DISABILITY
21.8/ 100
METRIC RATING
197th/ 347
METRIC RANK
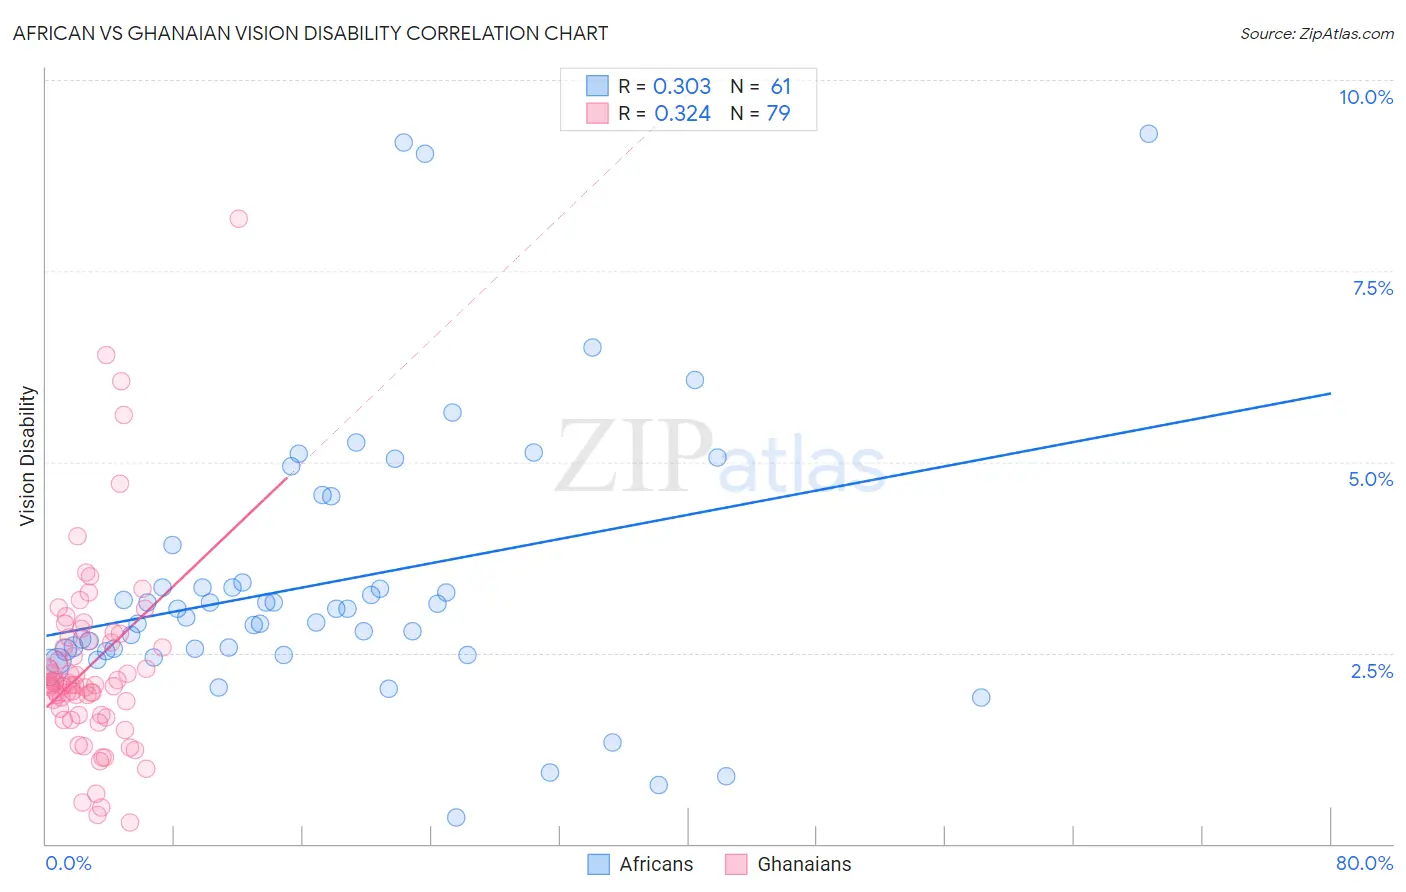
African vs Ghanaian Vision Disability Correlation Chart
The statistical analysis conducted on geographies consisting of 469,580,037 people shows a mild positive correlation between the proportion of Africans and percentage of population with vision disability in the United States with a correlation coefficient (R) of 0.303 and weighted average of 2.5%. Similarly, the statistical analysis conducted on geographies consisting of 190,620,307 people shows a mild positive correlation between the proportion of Ghanaians and percentage of population with vision disability in the United States with a correlation coefficient (R) of 0.324 and weighted average of 2.2%, a difference of 14.9%.
Vision Disability Correlation Summary
| Measurement | African | Ghanaian |
| Minimum | 0.34% | 0.27% |
| Maximum | 9.3% | 8.2% |
| Range | 9.0% | 7.9% |
| Mean | 3.4% | 2.3% |
| Median | 3.1% | 2.1% |
| Interquartile 25% (IQ1) | 2.5% | 1.7% |
| Interquartile 75% (IQ3) | 3.7% | 2.7% |
| Interquartile Range (IQR) | 1.1% | 1.0% |
| Standard Deviation (Sample) | 1.8% | 1.3% |
| Standard Deviation (Population) | 1.8% | 1.3% |
Similar Demographics by Vision Disability
Demographics Similar to Africans by Vision Disability
In terms of vision disability, the demographic groups most similar to Africans are Menominee (2.5%, a difference of 0.18%), Cree (2.5%, a difference of 0.20%), Mexican (2.5%, a difference of 0.24%), Immigrants from Dominica (2.5%, a difference of 0.37%), and Immigrants from Mexico (2.5%, a difference of 1.1%).
| Demographics | Rating | Rank | Vision Disability |
| Yaqui | 0.0 /100 | #293 | Tragic 2.5% |
| Ottawa | 0.0 /100 | #294 | Tragic 2.5% |
| Delaware | 0.0 /100 | #295 | Tragic 2.5% |
| Immigrants | Mexico | 0.0 /100 | #296 | Tragic 2.5% |
| Immigrants | Dominica | 0.0 /100 | #297 | Tragic 2.5% |
| Mexicans | 0.0 /100 | #298 | Tragic 2.5% |
| Cree | 0.0 /100 | #299 | Tragic 2.5% |
| Africans | 0.0 /100 | #300 | Tragic 2.5% |
| Menominee | 0.0 /100 | #301 | Tragic 2.5% |
| Spanish American Indians | 0.0 /100 | #302 | Tragic 2.6% |
| Immigrants | Cabo Verde | 0.0 /100 | #303 | Tragic 2.6% |
| Aleuts | 0.0 /100 | #304 | Tragic 2.6% |
| Hispanics or Latinos | 0.0 /100 | #305 | Tragic 2.6% |
| Iroquois | 0.0 /100 | #306 | Tragic 2.6% |
| Immigrants | Dominican Republic | 0.0 /100 | #307 | Tragic 2.6% |
Demographics Similar to Ghanaians by Vision Disability
In terms of vision disability, the demographic groups most similar to Ghanaians are Czechoslovakian (2.2%, a difference of 0.020%), Immigrants from El Salvador (2.2%, a difference of 0.070%), Immigrants from Grenada (2.2%, a difference of 0.11%), Immigrants from Thailand (2.2%, a difference of 0.16%), and Immigrants (2.2%, a difference of 0.17%).
| Demographics | Rating | Rank | Vision Disability |
| Immigrants | Costa Rica | 26.1 /100 | #190 | Fair 2.2% |
| Canadians | 25.8 /100 | #191 | Fair 2.2% |
| Europeans | 25.7 /100 | #192 | Fair 2.2% |
| British | 25.1 /100 | #193 | Fair 2.2% |
| Immigrants | Barbados | 24.0 /100 | #194 | Fair 2.2% |
| Immigrants | Immigrants | 23.7 /100 | #195 | Fair 2.2% |
| Immigrants | Grenada | 23.1 /100 | #196 | Fair 2.2% |
| Ghanaians | 21.8 /100 | #197 | Fair 2.2% |
| Czechoslovakians | 21.6 /100 | #198 | Fair 2.2% |
| Immigrants | El Salvador | 21.0 /100 | #199 | Fair 2.2% |
| Immigrants | Thailand | 20.1 /100 | #200 | Fair 2.2% |
| Slovaks | 18.8 /100 | #201 | Poor 2.2% |
| Immigrants | Zaire | 18.0 /100 | #202 | Poor 2.2% |
| Dutch | 17.1 /100 | #203 | Poor 2.2% |
| Immigrants | Guyana | 15.9 /100 | #204 | Poor 2.2% |