Immigrants from Dominican Republic vs Sri Lankan Disability Age 65 to 74
COMPARE
Immigrants from Dominican Republic
Sri Lankan
Disability Age 65 to 74
Disability Age 65 to 74 Comparison
Immigrants from Dominican Republic
Sri Lankans
27.0%
DISABILITY AGE 65 TO 74
0.0/ 100
METRIC RATING
300th/ 347
METRIC RANK
23.0%
DISABILITY AGE 65 TO 74
74.0/ 100
METRIC RATING
154th/ 347
METRIC RANK
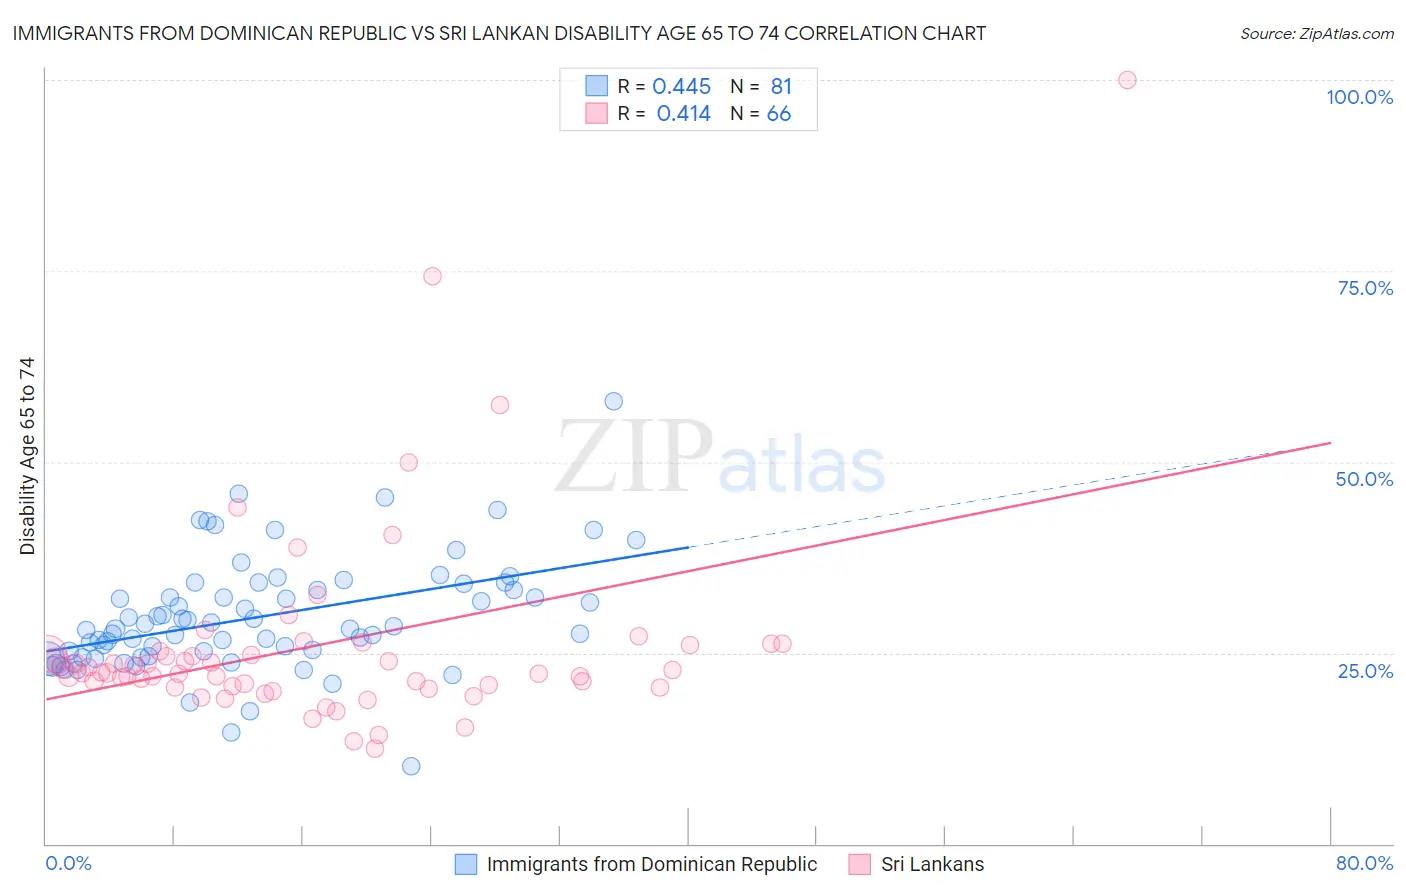
Immigrants from Dominican Republic vs Sri Lankan Disability Age 65 to 74 Correlation Chart
The statistical analysis conducted on geographies consisting of 274,603,138 people shows a moderate positive correlation between the proportion of Immigrants from Dominican Republic and percentage of population with a disability between the ages 65 and 75 in the United States with a correlation coefficient (R) of 0.445 and weighted average of 27.0%. Similarly, the statistical analysis conducted on geographies consisting of 439,297,030 people shows a moderate positive correlation between the proportion of Sri Lankans and percentage of population with a disability between the ages 65 and 75 in the United States with a correlation coefficient (R) of 0.414 and weighted average of 23.0%, a difference of 17.6%.
Disability Age 65 to 74 Correlation Summary
| Measurement | Immigrants from Dominican Republic | Sri Lankan |
| Minimum | 10.1% | 12.5% |
| Maximum | 57.9% | 100.0% |
| Range | 47.8% | 87.5% |
| Mean | 29.7% | 25.9% |
| Median | 28.2% | 22.4% |
| Interquartile 25% (IQ1) | 24.5% | 20.6% |
| Interquartile 75% (IQ3) | 33.7% | 25.1% |
| Interquartile Range (IQR) | 9.2% | 4.5% |
| Standard Deviation (Sample) | 7.5% | 13.4% |
| Standard Deviation (Population) | 7.5% | 13.3% |
Similar Demographics by Disability Age 65 to 74
Demographics Similar to Immigrants from Dominican Republic by Disability Age 65 to 74
In terms of disability age 65 to 74, the demographic groups most similar to Immigrants from Dominican Republic are Potawatomi (27.0%, a difference of 0.030%), Immigrants from Yemen (27.0%, a difference of 0.060%), Fijian (27.0%, a difference of 0.080%), Immigrants from Mexico (27.1%, a difference of 0.32%), and Central American Indian (27.1%, a difference of 0.33%).
| Demographics | Rating | Rank | Disability Age 65 to 74 |
| Immigrants | Central America | 0.0 /100 | #293 | Tragic 26.6% |
| Dominicans | 0.0 /100 | #294 | Tragic 26.7% |
| Hispanics or Latinos | 0.0 /100 | #295 | Tragic 26.7% |
| Bangladeshis | 0.0 /100 | #296 | Tragic 26.8% |
| Fijians | 0.0 /100 | #297 | Tragic 27.0% |
| Immigrants | Yemen | 0.0 /100 | #298 | Tragic 27.0% |
| Potawatomi | 0.0 /100 | #299 | Tragic 27.0% |
| Immigrants | Dominican Republic | 0.0 /100 | #300 | Tragic 27.0% |
| Immigrants | Mexico | 0.0 /100 | #301 | Tragic 27.1% |
| Central American Indians | 0.0 /100 | #302 | Tragic 27.1% |
| Tlingit-Haida | 0.0 /100 | #303 | Tragic 27.1% |
| Puget Sound Salish | 0.0 /100 | #304 | Tragic 27.2% |
| Mexicans | 0.0 /100 | #305 | Tragic 27.2% |
| Blacks/African Americans | 0.0 /100 | #306 | Tragic 27.3% |
| Ute | 0.0 /100 | #307 | Tragic 27.3% |
Demographics Similar to Sri Lankans by Disability Age 65 to 74
In terms of disability age 65 to 74, the demographic groups most similar to Sri Lankans are British (23.0%, a difference of 0.010%), Immigrants from Western Asia (23.0%, a difference of 0.010%), Slavic (23.0%, a difference of 0.090%), Czechoslovakian (23.0%, a difference of 0.12%), and Finnish (22.9%, a difference of 0.20%).
| Demographics | Rating | Rank | Disability Age 65 to 74 |
| Immigrants | Uzbekistan | 83.1 /100 | #147 | Excellent 22.8% |
| New Zealanders | 79.9 /100 | #148 | Good 22.9% |
| Swiss | 79.7 /100 | #149 | Good 22.9% |
| Canadians | 77.7 /100 | #150 | Good 22.9% |
| Immigrants | Morocco | 77.6 /100 | #151 | Good 22.9% |
| Finns | 76.5 /100 | #152 | Good 22.9% |
| Slavs | 75.2 /100 | #153 | Good 23.0% |
| Sri Lankans | 74.0 /100 | #154 | Good 23.0% |
| British | 73.9 /100 | #155 | Good 23.0% |
| Immigrants | Western Asia | 73.8 /100 | #156 | Good 23.0% |
| Czechoslovakians | 72.4 /100 | #157 | Good 23.0% |
| Immigrants | Vietnam | 69.1 /100 | #158 | Good 23.1% |
| South American Indians | 65.5 /100 | #159 | Good 23.1% |
| Koreans | 64.2 /100 | #160 | Good 23.1% |
| Immigrants | Cameroon | 63.8 /100 | #161 | Good 23.1% |