Afghan vs Bermudan Disability Age Over 75
COMPARE
Afghan
Bermudan
Disability Age Over 75
Disability Age Over 75 Comparison
Afghans
Bermudans
48.4%
DISABILITY AGE OVER 75
1.8/ 100
METRIC RATING
244th/ 347
METRIC RANK
46.9%
DISABILITY AGE OVER 75
85.6/ 100
METRIC RATING
143rd/ 347
METRIC RANK
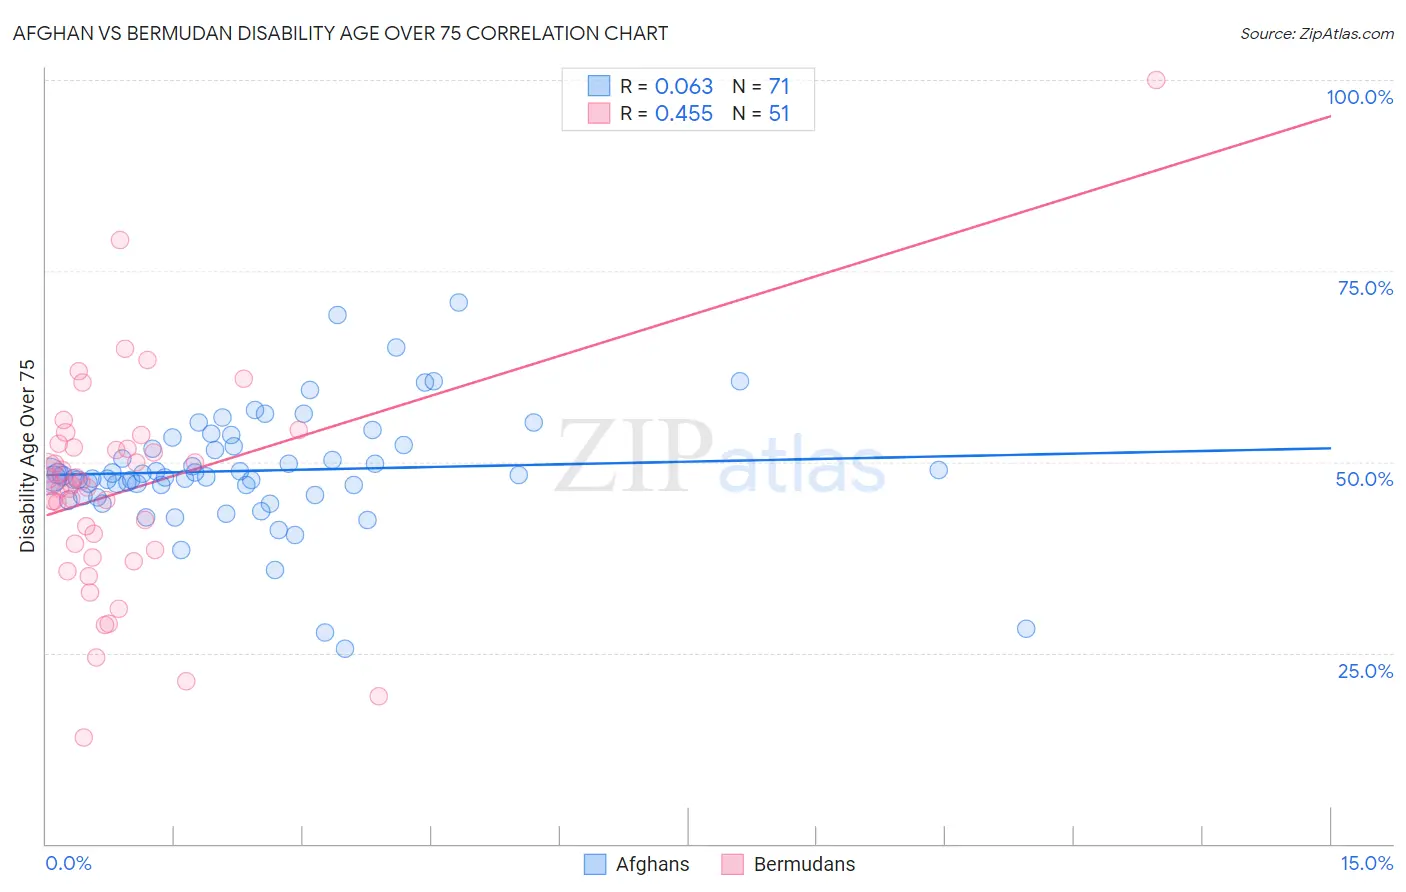
Afghan vs Bermudan Disability Age Over 75 Correlation Chart
The statistical analysis conducted on geographies consisting of 148,746,614 people shows a slight positive correlation between the proportion of Afghans and percentage of population with a disability over the age of 75 in the United States with a correlation coefficient (R) of 0.063 and weighted average of 48.4%. Similarly, the statistical analysis conducted on geographies consisting of 55,716,155 people shows a moderate positive correlation between the proportion of Bermudans and percentage of population with a disability over the age of 75 in the United States with a correlation coefficient (R) of 0.455 and weighted average of 46.9%, a difference of 3.3%.
Disability Age Over 75 Correlation Summary
| Measurement | Afghan | Bermudan |
| Minimum | 25.5% | 13.9% |
| Maximum | 70.8% | 100.0% |
| Range | 45.3% | 86.1% |
| Mean | 48.9% | 46.3% |
| Median | 48.1% | 47.0% |
| Interquartile 25% (IQ1) | 45.6% | 38.5% |
| Interquartile 75% (IQ3) | 52.3% | 52.0% |
| Interquartile Range (IQR) | 6.6% | 13.5% |
| Standard Deviation (Sample) | 7.8% | 14.3% |
| Standard Deviation (Population) | 7.7% | 14.2% |
Similar Demographics by Disability Age Over 75
Demographics Similar to Afghans by Disability Age Over 75
In terms of disability age over 75, the demographic groups most similar to Afghans are American (48.4%, a difference of 0.020%), Chippewa (48.4%, a difference of 0.060%), Iroquois (48.4%, a difference of 0.070%), Immigrants from Caribbean (48.4%, a difference of 0.090%), and Native Hawaiian (48.3%, a difference of 0.13%).
| Demographics | Rating | Rank | Disability Age Over 75 |
| Immigrants | St. Vincent and the Grenadines | 3.2 /100 | #237 | Tragic 48.2% |
| Nicaraguans | 3.0 /100 | #238 | Tragic 48.3% |
| Immigrants | Thailand | 2.8 /100 | #239 | Tragic 48.3% |
| Tongans | 2.3 /100 | #240 | Tragic 48.3% |
| Native Hawaiians | 2.2 /100 | #241 | Tragic 48.3% |
| French American Indians | 2.2 /100 | #242 | Tragic 48.3% |
| Immigrants | Caribbean | 2.1 /100 | #243 | Tragic 48.4% |
| Afghans | 1.8 /100 | #244 | Tragic 48.4% |
| Americans | 1.7 /100 | #245 | Tragic 48.4% |
| Chippewa | 1.6 /100 | #246 | Tragic 48.4% |
| Iroquois | 1.6 /100 | #247 | Tragic 48.4% |
| Sri Lankans | 1.4 /100 | #248 | Tragic 48.5% |
| Iraqis | 1.0 /100 | #249 | Tragic 48.6% |
| West Indians | 0.8 /100 | #250 | Tragic 48.6% |
| Koreans | 0.8 /100 | #251 | Tragic 48.6% |
Demographics Similar to Bermudans by Disability Age Over 75
In terms of disability age over 75, the demographic groups most similar to Bermudans are Venezuelan (46.9%, a difference of 0.020%), Peruvian (46.8%, a difference of 0.040%), Costa Rican (46.9%, a difference of 0.050%), Guyanese (46.9%, a difference of 0.060%), and Lebanese (46.8%, a difference of 0.070%).
| Demographics | Rating | Rank | Disability Age Over 75 |
| Immigrants | Venezuela | 88.6 /100 | #136 | Excellent 46.8% |
| Immigrants | Uganda | 88.5 /100 | #137 | Excellent 46.8% |
| Immigrants | Bosnia and Herzegovina | 88.5 /100 | #138 | Excellent 46.8% |
| Yugoslavians | 88.5 /100 | #139 | Excellent 46.8% |
| Immigrants | Costa Rica | 87.4 /100 | #140 | Excellent 46.8% |
| Lebanese | 87.0 /100 | #141 | Excellent 46.8% |
| Peruvians | 86.5 /100 | #142 | Excellent 46.8% |
| Bermudans | 85.6 /100 | #143 | Excellent 46.9% |
| Venezuelans | 85.0 /100 | #144 | Excellent 46.9% |
| Costa Ricans | 84.5 /100 | #145 | Excellent 46.9% |
| Guyanese | 84.3 /100 | #146 | Excellent 46.9% |
| Immigrants | Peru | 84.1 /100 | #147 | Excellent 46.9% |
| Asians | 81.6 /100 | #148 | Excellent 46.9% |
| Welsh | 81.3 /100 | #149 | Excellent 47.0% |
| Immigrants | Russia | 79.3 /100 | #150 | Good 47.0% |