Afghan vs Immigrants from Mexico Cognitive Disability
COMPARE
Afghan
Immigrants from Mexico
Cognitive Disability
Cognitive Disability Comparison
Afghans
Immigrants from Mexico
17.3%
COGNITIVE DISABILITY
38.2/ 100
METRIC RATING
185th/ 347
METRIC RANK
17.8%
COGNITIVE DISABILITY
1.8/ 100
METRIC RATING
237th/ 347
METRIC RANK
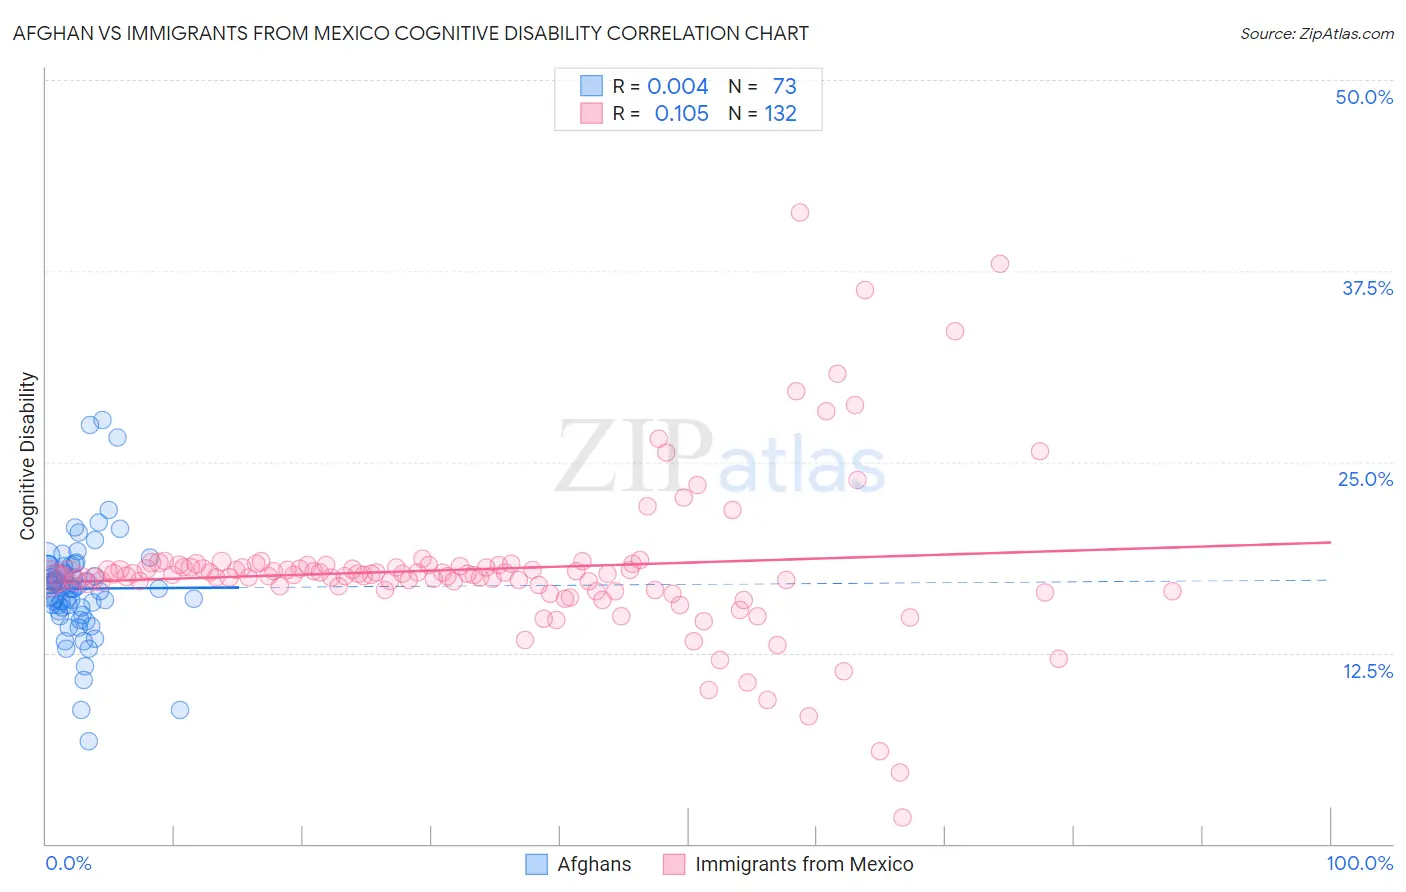
Afghan vs Immigrants from Mexico Cognitive Disability Correlation Chart
The statistical analysis conducted on geographies consisting of 148,870,382 people shows no correlation between the proportion of Afghans and percentage of population with cognitive disability in the United States with a correlation coefficient (R) of 0.004 and weighted average of 17.3%. Similarly, the statistical analysis conducted on geographies consisting of 513,604,710 people shows a poor positive correlation between the proportion of Immigrants from Mexico and percentage of population with cognitive disability in the United States with a correlation coefficient (R) of 0.105 and weighted average of 17.8%, a difference of 2.5%.
Cognitive Disability Correlation Summary
| Measurement | Afghan | Immigrants from Mexico |
| Minimum | 6.7% | 1.8% |
| Maximum | 27.8% | 41.3% |
| Range | 21.0% | 39.6% |
| Mean | 16.7% | 18.0% |
| Median | 16.7% | 17.6% |
| Interquartile 25% (IQ1) | 15.3% | 16.7% |
| Interquartile 75% (IQ3) | 18.2% | 18.2% |
| Interquartile Range (IQR) | 2.9% | 1.4% |
| Standard Deviation (Sample) | 3.5% | 5.2% |
| Standard Deviation (Population) | 3.5% | 5.2% |
Similar Demographics by Cognitive Disability
Demographics Similar to Afghans by Cognitive Disability
In terms of cognitive disability, the demographic groups most similar to Afghans are Crow (17.3%, a difference of 0.030%), Spaniard (17.3%, a difference of 0.060%), Cambodian (17.3%, a difference of 0.070%), Immigrants from Guyana (17.3%, a difference of 0.14%), and Arab (17.3%, a difference of 0.14%).
| Demographics | Rating | Rank | Cognitive Disability |
| Spanish | 48.9 /100 | #178 | Average 17.3% |
| Sioux | 48.6 /100 | #179 | Average 17.3% |
| Pakistanis | 43.9 /100 | #180 | Average 17.3% |
| Immigrants | Guyana | 42.9 /100 | #181 | Average 17.3% |
| Arabs | 42.8 /100 | #182 | Average 17.3% |
| Spaniards | 40.3 /100 | #183 | Average 17.3% |
| Crow | 39.1 /100 | #184 | Fair 17.3% |
| Afghans | 38.2 /100 | #185 | Fair 17.3% |
| Cambodians | 35.9 /100 | #186 | Fair 17.3% |
| Immigrants | Fiji | 33.7 /100 | #187 | Fair 17.4% |
| Immigrants | France | 29.8 /100 | #188 | Fair 17.4% |
| Immigrants | Western Asia | 29.5 /100 | #189 | Fair 17.4% |
| Immigrants | Spain | 27.7 /100 | #190 | Fair 17.4% |
| Immigrants | Nonimmigrants | 27.4 /100 | #191 | Fair 17.4% |
| Immigrants | Haiti | 27.1 /100 | #192 | Fair 17.4% |
Demographics Similar to Immigrants from Mexico by Cognitive Disability
In terms of cognitive disability, the demographic groups most similar to Immigrants from Mexico are Immigrants from Iraq (17.8%, a difference of 0.010%), Cheyenne (17.8%, a difference of 0.040%), Osage (17.8%, a difference of 0.070%), Spanish American Indian (17.8%, a difference of 0.070%), and Guatemalan (17.8%, a difference of 0.090%).
| Demographics | Rating | Rank | Cognitive Disability |
| Mongolians | 2.2 /100 | #230 | Tragic 17.7% |
| Guatemalans | 2.1 /100 | #231 | Tragic 17.8% |
| Tongans | 2.1 /100 | #232 | Tragic 17.8% |
| Panamanians | 2.1 /100 | #233 | Tragic 17.8% |
| Osage | 2.0 /100 | #234 | Tragic 17.8% |
| Spanish American Indians | 2.0 /100 | #235 | Tragic 17.8% |
| Immigrants | Iraq | 1.8 /100 | #236 | Tragic 17.8% |
| Immigrants | Mexico | 1.8 /100 | #237 | Tragic 17.8% |
| Cheyenne | 1.7 /100 | #238 | Tragic 17.8% |
| Cajuns | 1.4 /100 | #239 | Tragic 17.8% |
| Iraqis | 1.4 /100 | #240 | Tragic 17.8% |
| Mexicans | 1.1 /100 | #241 | Tragic 17.8% |
| Paiute | 1.1 /100 | #242 | Tragic 17.8% |
| Immigrants | Bangladesh | 1.0 /100 | #243 | Tragic 17.8% |
| Jamaicans | 0.9 /100 | #244 | Tragic 17.9% |