Afghan vs Jordanian Cognitive Disability
COMPARE
Afghan
Jordanian
Cognitive Disability
Cognitive Disability Comparison
Afghans
Jordanians
17.3%
COGNITIVE DISABILITY
38.2/ 100
METRIC RATING
185th/ 347
METRIC RANK
16.8%
COGNITIVE DISABILITY
98.2/ 100
METRIC RATING
99th/ 347
METRIC RANK
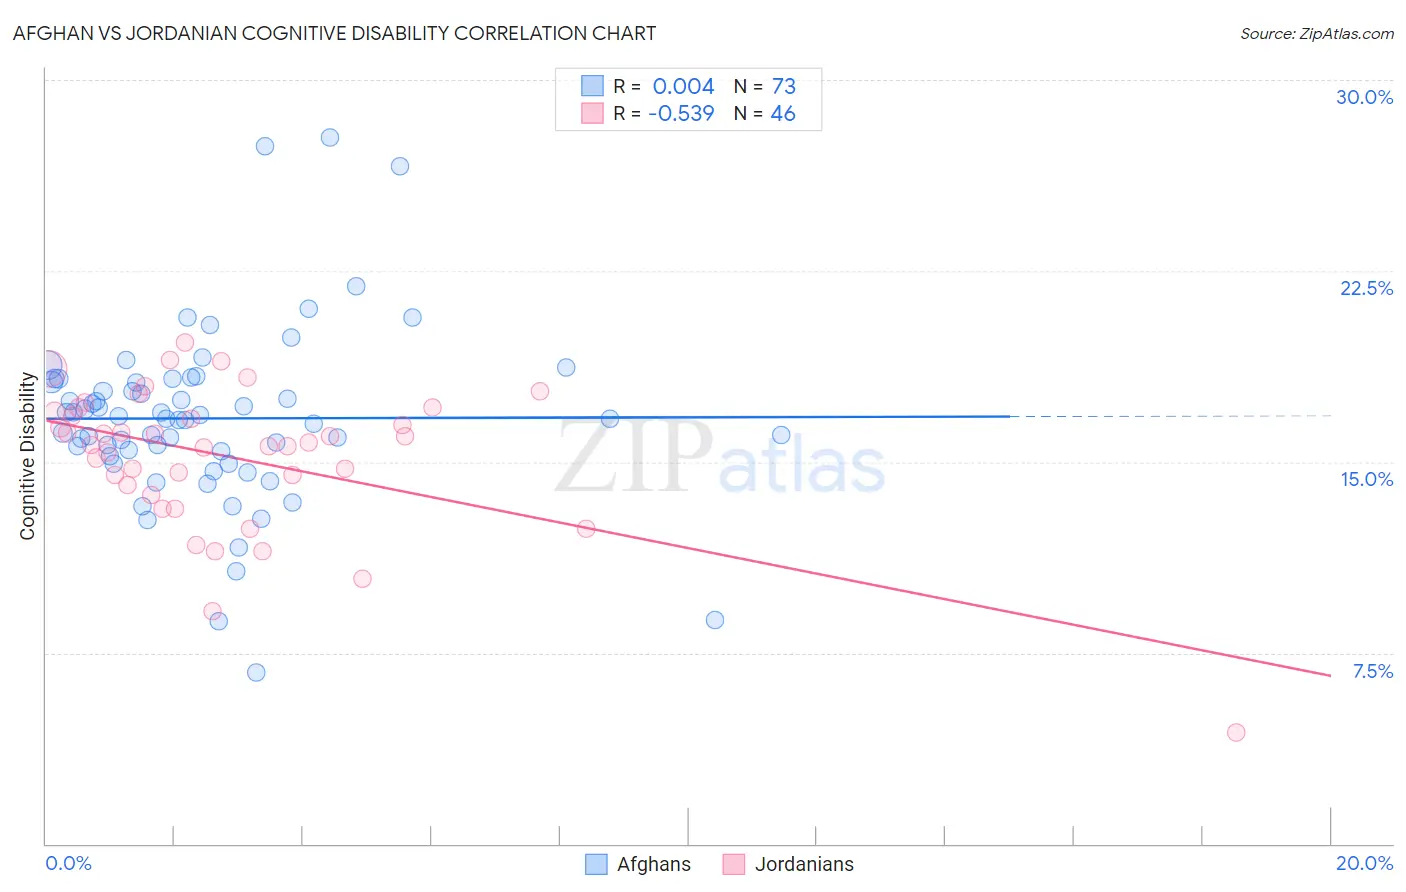
Afghan vs Jordanian Cognitive Disability Correlation Chart
The statistical analysis conducted on geographies consisting of 148,870,382 people shows no correlation between the proportion of Afghans and percentage of population with cognitive disability in the United States with a correlation coefficient (R) of 0.004 and weighted average of 17.3%. Similarly, the statistical analysis conducted on geographies consisting of 166,416,373 people shows a substantial negative correlation between the proportion of Jordanians and percentage of population with cognitive disability in the United States with a correlation coefficient (R) of -0.539 and weighted average of 16.8%, a difference of 3.3%.
Cognitive Disability Correlation Summary
| Measurement | Afghan | Jordanian |
| Minimum | 6.7% | 4.3% |
| Maximum | 27.8% | 19.7% |
| Range | 21.0% | 15.3% |
| Mean | 16.7% | 15.2% |
| Median | 16.7% | 15.7% |
| Interquartile 25% (IQ1) | 15.3% | 14.1% |
| Interquartile 75% (IQ3) | 18.2% | 16.9% |
| Interquartile Range (IQR) | 2.9% | 2.8% |
| Standard Deviation (Sample) | 3.5% | 2.9% |
| Standard Deviation (Population) | 3.5% | 2.8% |
Similar Demographics by Cognitive Disability
Demographics Similar to Afghans by Cognitive Disability
In terms of cognitive disability, the demographic groups most similar to Afghans are Crow (17.3%, a difference of 0.030%), Spaniard (17.3%, a difference of 0.060%), Cambodian (17.3%, a difference of 0.070%), Immigrants from Guyana (17.3%, a difference of 0.14%), and Arab (17.3%, a difference of 0.14%).
| Demographics | Rating | Rank | Cognitive Disability |
| Spanish | 48.9 /100 | #178 | Average 17.3% |
| Sioux | 48.6 /100 | #179 | Average 17.3% |
| Pakistanis | 43.9 /100 | #180 | Average 17.3% |
| Immigrants | Guyana | 42.9 /100 | #181 | Average 17.3% |
| Arabs | 42.8 /100 | #182 | Average 17.3% |
| Spaniards | 40.3 /100 | #183 | Average 17.3% |
| Crow | 39.1 /100 | #184 | Fair 17.3% |
| Afghans | 38.2 /100 | #185 | Fair 17.3% |
| Cambodians | 35.9 /100 | #186 | Fair 17.3% |
| Immigrants | Fiji | 33.7 /100 | #187 | Fair 17.4% |
| Immigrants | France | 29.8 /100 | #188 | Fair 17.4% |
| Immigrants | Western Asia | 29.5 /100 | #189 | Fair 17.4% |
| Immigrants | Spain | 27.7 /100 | #190 | Fair 17.4% |
| Immigrants | Nonimmigrants | 27.4 /100 | #191 | Fair 17.4% |
| Immigrants | Haiti | 27.1 /100 | #192 | Fair 17.4% |
Demographics Similar to Jordanians by Cognitive Disability
In terms of cognitive disability, the demographic groups most similar to Jordanians are Immigrants from Russia (16.8%, a difference of 0.030%), Immigrants from Asia (16.8%, a difference of 0.040%), Irish (16.8%, a difference of 0.060%), Immigrants from Lebanon (16.8%, a difference of 0.090%), and Dutch (16.8%, a difference of 0.11%).
| Demographics | Rating | Rank | Cognitive Disability |
| Immigrants | South America | 98.8 /100 | #92 | Exceptional 16.7% |
| Immigrants | Southern Europe | 98.7 /100 | #93 | Exceptional 16.7% |
| Asians | 98.7 /100 | #94 | Exceptional 16.7% |
| English | 98.6 /100 | #95 | Exceptional 16.8% |
| Finns | 98.5 /100 | #96 | Exceptional 16.8% |
| Dutch | 98.5 /100 | #97 | Exceptional 16.8% |
| Immigrants | Lebanon | 98.4 /100 | #98 | Exceptional 16.8% |
| Jordanians | 98.2 /100 | #99 | Exceptional 16.8% |
| Immigrants | Russia | 98.2 /100 | #100 | Exceptional 16.8% |
| Immigrants | Asia | 98.1 /100 | #101 | Exceptional 16.8% |
| Irish | 98.1 /100 | #102 | Exceptional 16.8% |
| Paraguayans | 98.0 /100 | #103 | Exceptional 16.8% |
| Palestinians | 98.0 /100 | #104 | Exceptional 16.8% |
| Immigrants | Eastern Asia | 97.9 /100 | #105 | Exceptional 16.8% |
| Northern Europeans | 97.8 /100 | #106 | Exceptional 16.8% |