South American Indian vs Immigrants from Eritrea Disability Age Under 5
COMPARE
South American Indian
Immigrants from Eritrea
Disability Age Under 5
Disability Age Under 5 Comparison
South American Indians
Immigrants from Eritrea
1.3%
DISABILITY AGE UNDER 5
3.3/ 100
METRIC RATING
236th/ 347
METRIC RANK
1.2%
DISABILITY AGE UNDER 5
92.3/ 100
METRIC RATING
120th/ 347
METRIC RANK
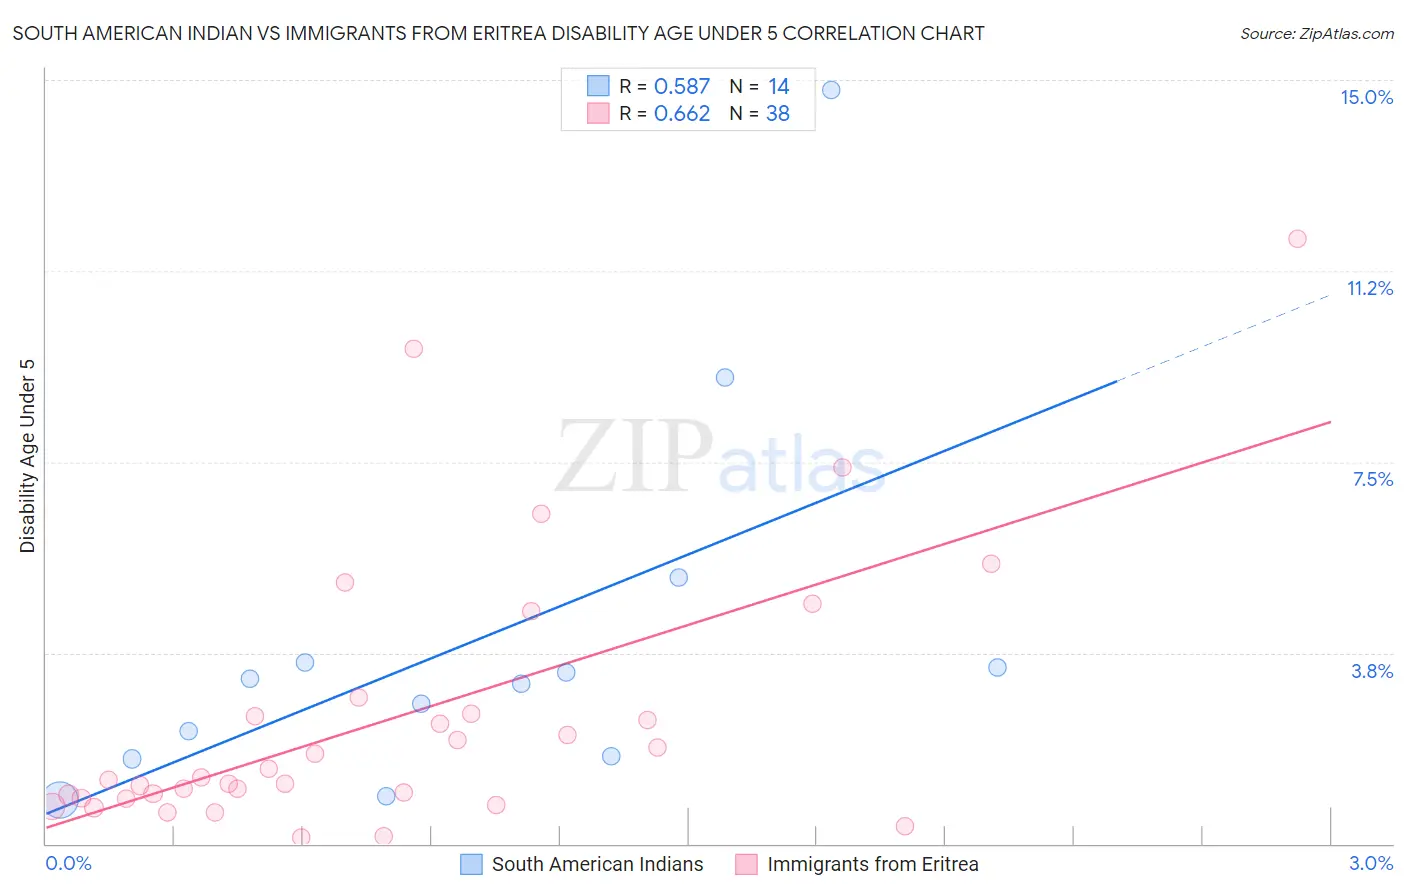
South American Indian vs Immigrants from Eritrea Disability Age Under 5 Correlation Chart
The statistical analysis conducted on geographies consisting of 114,062,078 people shows a substantial positive correlation between the proportion of South American Indians and percentage of population with a disability under the age of 5 in the United States with a correlation coefficient (R) of 0.587 and weighted average of 1.3%. Similarly, the statistical analysis conducted on geographies consisting of 83,045,711 people shows a significant positive correlation between the proportion of Immigrants from Eritrea and percentage of population with a disability under the age of 5 in the United States with a correlation coefficient (R) of 0.662 and weighted average of 1.2%, a difference of 14.0%.
Disability Age Under 5 Correlation Summary
| Measurement | South American Indian | Immigrants from Eritrea |
| Minimum | 0.86% | 0.12% |
| Maximum | 14.8% | 11.9% |
| Range | 13.9% | 11.8% |
| Mean | 4.0% | 2.5% |
| Median | 3.2% | 1.3% |
| Interquartile 25% (IQ1) | 1.7% | 0.90% |
| Interquartile 75% (IQ3) | 3.6% | 2.5% |
| Interquartile Range (IQR) | 1.8% | 1.6% |
| Standard Deviation (Sample) | 3.7% | 2.7% |
| Standard Deviation (Population) | 3.6% | 2.6% |
Similar Demographics by Disability Age Under 5
Demographics Similar to South American Indians by Disability Age Under 5
In terms of disability age under 5, the demographic groups most similar to South American Indians are Central American Indian (1.3%, a difference of 0.20%), Basque (1.3%, a difference of 0.24%), Pueblo (1.3%, a difference of 0.27%), Tongan (1.3%, a difference of 0.53%), and French American Indian (1.3%, a difference of 0.65%).
| Demographics | Rating | Rank | Disability Age Under 5 |
| Immigrants | Costa Rica | 5.5 /100 | #229 | Tragic 1.3% |
| Lebanese | 5.3 /100 | #230 | Tragic 1.3% |
| Immigrants | Northern Europe | 4.7 /100 | #231 | Tragic 1.3% |
| French American Indians | 4.5 /100 | #232 | Tragic 1.3% |
| Tongans | 4.2 /100 | #233 | Tragic 1.3% |
| Pueblo | 3.8 /100 | #234 | Tragic 1.3% |
| Central American Indians | 3.6 /100 | #235 | Tragic 1.3% |
| South American Indians | 3.3 /100 | #236 | Tragic 1.3% |
| Basques | 3.0 /100 | #237 | Tragic 1.3% |
| Spanish American Indians | 2.4 /100 | #238 | Tragic 1.3% |
| Immigrants | Austria | 2.3 /100 | #239 | Tragic 1.3% |
| Native Hawaiians | 2.2 /100 | #240 | Tragic 1.3% |
| Maltese | 2.2 /100 | #241 | Tragic 1.3% |
| Lumbee | 2.1 /100 | #242 | Tragic 1.3% |
| Immigrants | Cameroon | 1.7 /100 | #243 | Tragic 1.4% |
Demographics Similar to Immigrants from Eritrea by Disability Age Under 5
In terms of disability age under 5, the demographic groups most similar to Immigrants from Eritrea are Bhutanese (1.2%, a difference of 0.070%), Immigrants from Senegal (1.2%, a difference of 0.28%), Immigrants from Venezuela (1.2%, a difference of 0.41%), Immigrants from Philippines (1.2%, a difference of 0.44%), and Aleut (1.2%, a difference of 0.47%).
| Demographics | Rating | Rank | Disability Age Under 5 |
| Immigrants | Oceania | 94.2 /100 | #113 | Exceptional 1.2% |
| Belizeans | 93.9 /100 | #114 | Exceptional 1.2% |
| Immigrants | Caribbean | 93.8 /100 | #115 | Exceptional 1.2% |
| Immigrants | Northern Africa | 93.8 /100 | #116 | Exceptional 1.2% |
| Immigrants | Philippines | 93.5 /100 | #117 | Exceptional 1.2% |
| Immigrants | Venezuela | 93.4 /100 | #118 | Exceptional 1.2% |
| Bhutanese | 92.5 /100 | #119 | Exceptional 1.2% |
| Immigrants | Eritrea | 92.3 /100 | #120 | Exceptional 1.2% |
| Immigrants | Senegal | 91.4 /100 | #121 | Exceptional 1.2% |
| Aleuts | 90.7 /100 | #122 | Exceptional 1.2% |
| Zimbabweans | 90.6 /100 | #123 | Exceptional 1.2% |
| Immigrants | Cambodia | 90.5 /100 | #124 | Exceptional 1.2% |
| Japanese | 90.3 /100 | #125 | Exceptional 1.2% |
| Central Americans | 89.7 /100 | #126 | Excellent 1.2% |
| Immigrants | Romania | 88.4 /100 | #127 | Excellent 1.2% |