Afghan vs Central American Indian Vision Disability
COMPARE
Afghan
Central American Indian
Vision Disability
Vision Disability Comparison
Afghans
Central American Indians
2.0%
VISION DISABILITY
99.5/ 100
METRIC RATING
50th/ 347
METRIC RANK
3.0%
VISION DISABILITY
0.0/ 100
METRIC RATING
331st/ 347
METRIC RANK
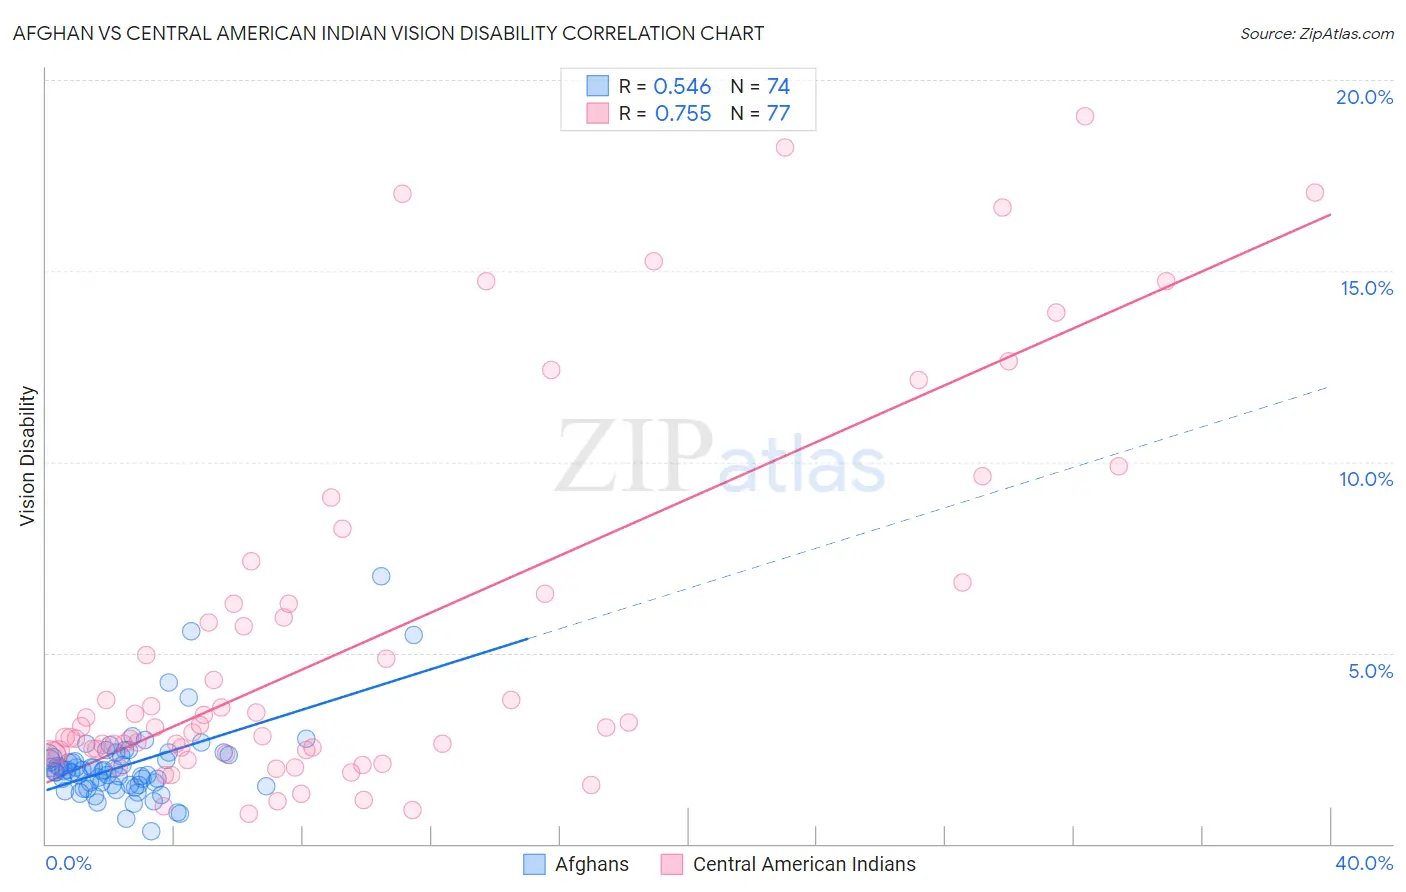
Afghan vs Central American Indian Vision Disability Correlation Chart
The statistical analysis conducted on geographies consisting of 148,842,568 people shows a substantial positive correlation between the proportion of Afghans and percentage of population with vision disability in the United States with a correlation coefficient (R) of 0.546 and weighted average of 2.0%. Similarly, the statistical analysis conducted on geographies consisting of 326,060,213 people shows a strong positive correlation between the proportion of Central American Indians and percentage of population with vision disability in the United States with a correlation coefficient (R) of 0.755 and weighted average of 3.0%, a difference of 53.5%.
Vision Disability Correlation Summary
| Measurement | Afghan | Central American Indian |
| Minimum | 0.32% | 0.79% |
| Maximum | 7.0% | 19.1% |
| Range | 6.7% | 18.3% |
| Mean | 2.1% | 5.3% |
| Median | 1.9% | 3.0% |
| Interquartile 25% (IQ1) | 1.5% | 2.4% |
| Interquartile 75% (IQ3) | 2.3% | 6.4% |
| Interquartile Range (IQR) | 0.76% | 4.0% |
| Standard Deviation (Sample) | 1.0% | 4.8% |
| Standard Deviation (Population) | 1.0% | 4.8% |
Similar Demographics by Vision Disability
Demographics Similar to Afghans by Vision Disability
In terms of vision disability, the demographic groups most similar to Afghans are Latvian (2.0%, a difference of 0.060%), Tongan (2.0%, a difference of 0.090%), Israeli (2.0%, a difference of 0.13%), Immigrants from Serbia (2.0%, a difference of 0.40%), and Immigrants from Belarus (2.0%, a difference of 0.51%).
| Demographics | Rating | Rank | Vision Disability |
| Eastern Europeans | 99.7 /100 | #43 | Exceptional 2.0% |
| Immigrants | Indonesia | 99.7 /100 | #44 | Exceptional 2.0% |
| Ethiopians | 99.7 /100 | #45 | Exceptional 2.0% |
| Immigrants | Sweden | 99.7 /100 | #46 | Exceptional 2.0% |
| Immigrants | Bulgaria | 99.7 /100 | #47 | Exceptional 2.0% |
| Israelis | 99.6 /100 | #48 | Exceptional 2.0% |
| Latvians | 99.5 /100 | #49 | Exceptional 2.0% |
| Afghans | 99.5 /100 | #50 | Exceptional 2.0% |
| Tongans | 99.5 /100 | #51 | Exceptional 2.0% |
| Immigrants | Serbia | 99.4 /100 | #52 | Exceptional 2.0% |
| Immigrants | Belarus | 99.3 /100 | #53 | Exceptional 2.0% |
| Macedonians | 99.3 /100 | #54 | Exceptional 2.0% |
| Laotians | 99.3 /100 | #55 | Exceptional 2.0% |
| Jordanians | 99.2 /100 | #56 | Exceptional 2.0% |
| Somalis | 99.2 /100 | #57 | Exceptional 2.0% |
Demographics Similar to Central American Indians by Vision Disability
In terms of vision disability, the demographic groups most similar to Central American Indians are Seminole (3.1%, a difference of 0.43%), Cajun (3.1%, a difference of 0.45%), Colville (3.0%, a difference of 0.64%), Cheyenne (3.1%, a difference of 1.5%), and Apache (3.0%, a difference of 1.8%).
| Demographics | Rating | Rank | Vision Disability |
| Hopi | 0.0 /100 | #324 | Tragic 2.9% |
| Cherokee | 0.0 /100 | #325 | Tragic 2.9% |
| Spanish Americans | 0.0 /100 | #326 | Tragic 2.9% |
| Natives/Alaskans | 0.0 /100 | #327 | Tragic 3.0% |
| Yuman | 0.0 /100 | #328 | Tragic 3.0% |
| Apache | 0.0 /100 | #329 | Tragic 3.0% |
| Colville | 0.0 /100 | #330 | Tragic 3.0% |
| Central American Indians | 0.0 /100 | #331 | Tragic 3.0% |
| Seminole | 0.0 /100 | #332 | Tragic 3.1% |
| Cajuns | 0.0 /100 | #333 | Tragic 3.1% |
| Cheyenne | 0.0 /100 | #334 | Tragic 3.1% |
| Navajo | 0.0 /100 | #335 | Tragic 3.1% |
| Alaskan Athabascans | 0.0 /100 | #336 | Tragic 3.1% |
| Dutch West Indians | 0.0 /100 | #337 | Tragic 3.2% |
| Chickasaw | 0.0 /100 | #338 | Tragic 3.2% |