Afghan vs Okinawan Vision Disability
COMPARE
Afghan
Okinawan
Vision Disability
Vision Disability Comparison
Afghans
Okinawans
2.0%
VISION DISABILITY
99.5/ 100
METRIC RATING
50th/ 347
METRIC RANK
1.8%
VISION DISABILITY
100.0/ 100
METRIC RATING
5th/ 347
METRIC RANK
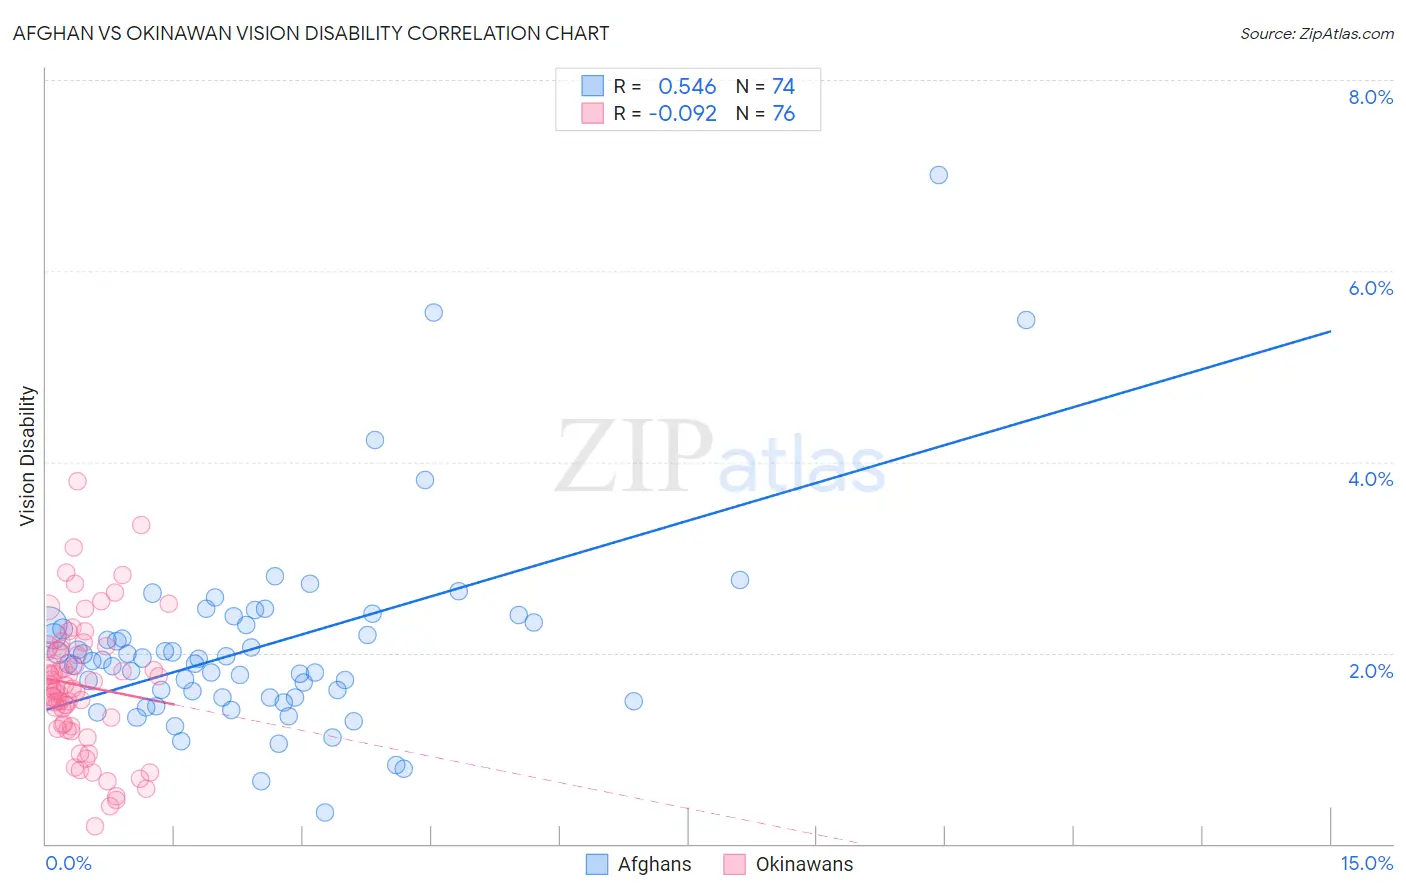
Afghan vs Okinawan Vision Disability Correlation Chart
The statistical analysis conducted on geographies consisting of 148,842,568 people shows a substantial positive correlation between the proportion of Afghans and percentage of population with vision disability in the United States with a correlation coefficient (R) of 0.546 and weighted average of 2.0%. Similarly, the statistical analysis conducted on geographies consisting of 73,755,744 people shows a slight negative correlation between the proportion of Okinawans and percentage of population with vision disability in the United States with a correlation coefficient (R) of -0.092 and weighted average of 1.8%, a difference of 11.9%.
Vision Disability Correlation Summary
| Measurement | Afghan | Okinawan |
| Minimum | 0.32% | 0.19% |
| Maximum | 7.0% | 3.8% |
| Range | 6.7% | 3.6% |
| Mean | 2.1% | 1.7% |
| Median | 1.9% | 1.6% |
| Interquartile 25% (IQ1) | 1.5% | 1.2% |
| Interquartile 75% (IQ3) | 2.3% | 2.0% |
| Interquartile Range (IQR) | 0.76% | 0.80% |
| Standard Deviation (Sample) | 1.0% | 0.69% |
| Standard Deviation (Population) | 1.0% | 0.69% |
Similar Demographics by Vision Disability
Demographics Similar to Afghans by Vision Disability
In terms of vision disability, the demographic groups most similar to Afghans are Latvian (2.0%, a difference of 0.060%), Tongan (2.0%, a difference of 0.090%), Israeli (2.0%, a difference of 0.13%), Immigrants from Serbia (2.0%, a difference of 0.40%), and Immigrants from Belarus (2.0%, a difference of 0.51%).
| Demographics | Rating | Rank | Vision Disability |
| Eastern Europeans | 99.7 /100 | #43 | Exceptional 2.0% |
| Immigrants | Indonesia | 99.7 /100 | #44 | Exceptional 2.0% |
| Ethiopians | 99.7 /100 | #45 | Exceptional 2.0% |
| Immigrants | Sweden | 99.7 /100 | #46 | Exceptional 2.0% |
| Immigrants | Bulgaria | 99.7 /100 | #47 | Exceptional 2.0% |
| Israelis | 99.6 /100 | #48 | Exceptional 2.0% |
| Latvians | 99.5 /100 | #49 | Exceptional 2.0% |
| Afghans | 99.5 /100 | #50 | Exceptional 2.0% |
| Tongans | 99.5 /100 | #51 | Exceptional 2.0% |
| Immigrants | Serbia | 99.4 /100 | #52 | Exceptional 2.0% |
| Immigrants | Belarus | 99.3 /100 | #53 | Exceptional 2.0% |
| Macedonians | 99.3 /100 | #54 | Exceptional 2.0% |
| Laotians | 99.3 /100 | #55 | Exceptional 2.0% |
| Jordanians | 99.2 /100 | #56 | Exceptional 2.0% |
| Somalis | 99.2 /100 | #57 | Exceptional 2.0% |
Demographics Similar to Okinawans by Vision Disability
In terms of vision disability, the demographic groups most similar to Okinawans are Immigrants from Iran (1.8%, a difference of 0.59%), Immigrants from South Central Asia (1.8%, a difference of 0.65%), Iranian (1.8%, a difference of 0.80%), Immigrants from Singapore (1.8%, a difference of 1.5%), and Immigrants from Hong Kong (1.8%, a difference of 1.7%).
| Demographics | Rating | Rank | Vision Disability |
| Immigrants | India | 100.0 /100 | #1 | Exceptional 1.7% |
| Filipinos | 100.0 /100 | #2 | Exceptional 1.7% |
| Immigrants | Taiwan | 100.0 /100 | #3 | Exceptional 1.7% |
| Thais | 100.0 /100 | #4 | Exceptional 1.7% |
| Okinawans | 100.0 /100 | #5 | Exceptional 1.8% |
| Immigrants | Iran | 100.0 /100 | #6 | Exceptional 1.8% |
| Immigrants | South Central Asia | 100.0 /100 | #7 | Exceptional 1.8% |
| Iranians | 100.0 /100 | #8 | Exceptional 1.8% |
| Immigrants | Singapore | 100.0 /100 | #9 | Exceptional 1.8% |
| Immigrants | Hong Kong | 100.0 /100 | #10 | Exceptional 1.8% |
| Immigrants | Israel | 100.0 /100 | #11 | Exceptional 1.8% |
| Immigrants | Korea | 100.0 /100 | #12 | Exceptional 1.8% |
| Immigrants | Eastern Asia | 100.0 /100 | #13 | Exceptional 1.8% |
| Immigrants | China | 100.0 /100 | #14 | Exceptional 1.8% |
| Immigrants | Bolivia | 100.0 /100 | #15 | Exceptional 1.8% |