Zip Codes with the Highest Percentage of Population Employed in Administrative & Support Services in Aspen, CO
RELATED REPORTS & OPTIONS
Administrative & Support Services
Aspen
Compare Zip Codes
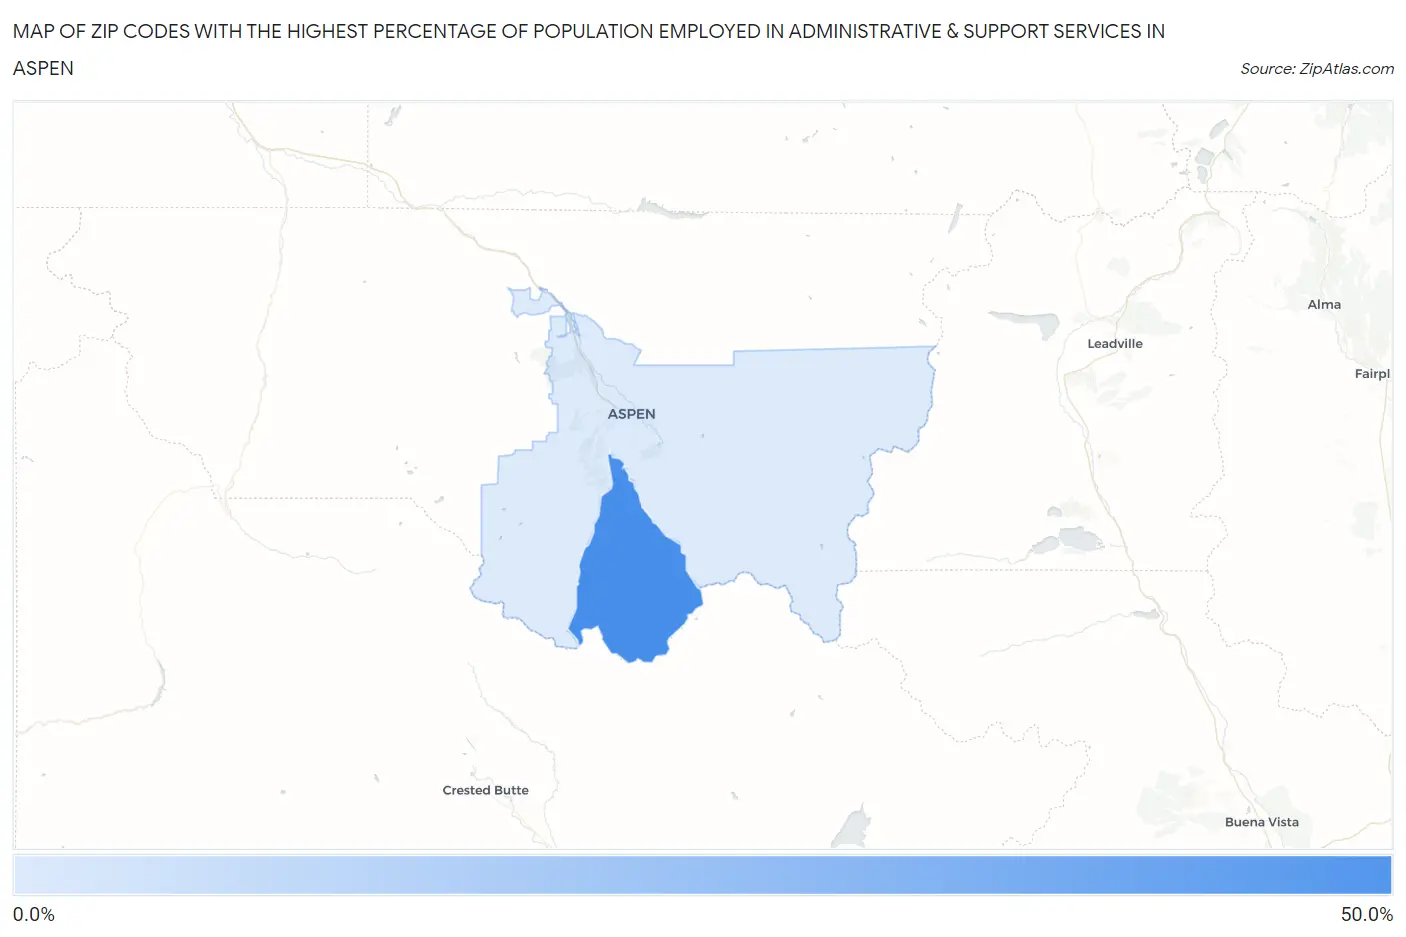
Map of Zip Codes with the Highest Percentage of Population Employed in Administrative & Support Services in Aspen
5.0%
40.2%
Zip Codes with the Highest Percentage of Population Employed in Administrative & Support Services in Aspen, CO
| Zip Code | % Employed | vs State | vs National | |
| 1. | 81612 | 40.2% | 4.1%(+36.1)#1 | 4.1%(+36.1)#83 |
| 2. | 81611 | 5.0% | 4.1%(+0.895)#111 | 4.1%(+0.837)#7,147 |
1
Common Questions
What are the Top Zip Codes with the Highest Percentage of Population Employed in Administrative & Support Services in Aspen, CO?
Top Zip Codes with the Highest Percentage of Population Employed in Administrative & Support Services in Aspen, CO are:
What zip code has the Highest Percentage of Population Employed in Administrative & Support Services in Aspen, CO?
81612 has the Highest Percentage of Population Employed in Administrative & Support Services in Aspen, CO with 40.2%.
What is the Percentage of Population Employed in Administrative & Support Services in Aspen, CO?
Percentage of Population Employed in Administrative & Support Services in Aspen is 4.2%.
What is the Percentage of Population Employed in Administrative & Support Services in Colorado?
Percentage of Population Employed in Administrative & Support Services in Colorado is 4.1%.
What is the Percentage of Population Employed in Administrative & Support Services in the United States?
Percentage of Population Employed in Administrative & Support Services in the United States is 4.1%.