Lyman, WY Map & Demographics
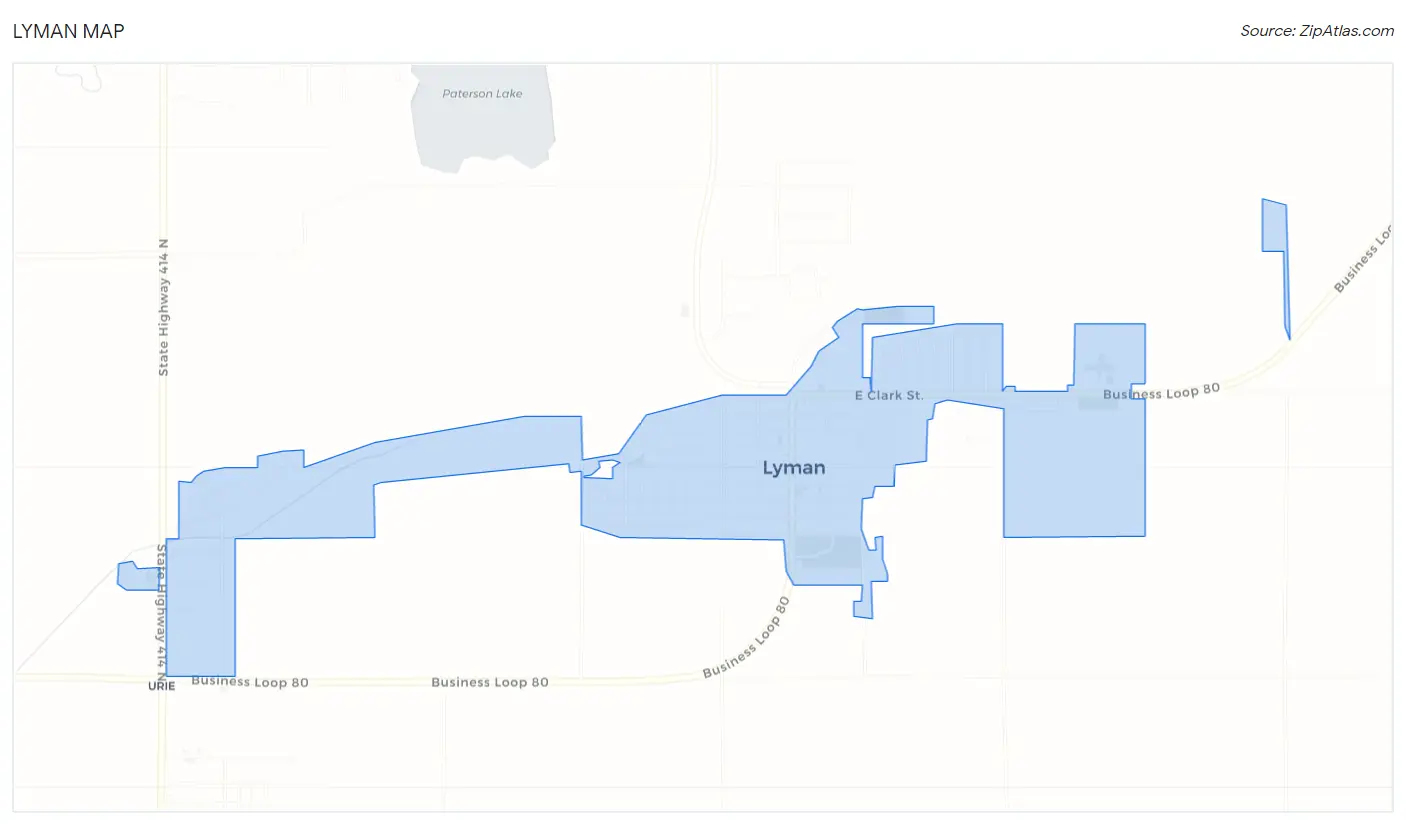
Lyman Map
Lyman Overview
$36,294
PER CAPITA INCOME
$120,500
AVG FAMILY INCOME
$100,875
AVG HOUSEHOLD INCOME
82.8%
WAGE / INCOME GAP [ % ]
17.2¢/ $1
WAGE / INCOME GAP [ $ ]
0.35
INEQUALITY / GINI INDEX
1,736
TOTAL POPULATION
889
MALE POPULATION
847
FEMALE POPULATION
104.96
MALES / 100 FEMALES
95.28
FEMALES / 100 MALES
35.8
MEDIAN AGE
3.4
AVG FAMILY SIZE
2.9
AVG HOUSEHOLD SIZE
687
LABOR FORCE [ PEOPLE ]
56.8%
PERCENT IN LABOR FORCE
4.2%
UNEMPLOYMENT RATE
Lyman Zip Codes
Lyman Area Codes
Income in Lyman
Income Overview in Lyman
Per Capita Income in Lyman is $36,294, while median incomes of families and households are $120,500 and $100,875 respectively.
| Characteristic | Number | Measure |
| Per Capita Income | 1,736 | $36,294 |
| Median Family Income | 452 | $120,500 |
| Mean Family Income | 452 | $123,941 |
| Median Household Income | 593 | $100,875 |
| Mean Household Income | 593 | $105,143 |
| Income Deficit | 452 | $0 |
| Wage / Income Gap (%) | 1,736 | 82.85% |
| Wage / Income Gap ($) | 1,736 | 17.15¢ per $1 |
| Gini / Inequality Index | 1,736 | 0.35 |
Earnings by Sex in Lyman
Average Earnings in Lyman are $38,333, $95,446 for men and $16,369 for women, a difference of 82.9%.
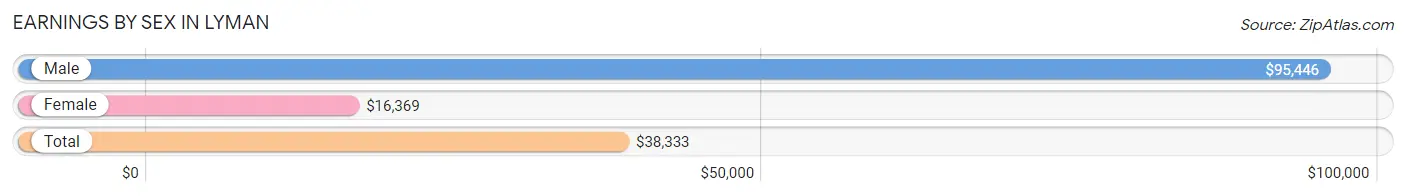
| Sex | Number | Average Earnings |
| Male | 485 (58.7%) | $95,446 |
| Female | 341 (41.3%) | $16,369 |
| Total | 826 (100.0%) | $38,333 |
Earnings by Sex by Income Bracket in Lyman
The most common earnings brackets in Lyman are $100,000+ for men (222 | 45.8%) and $20,000 to $22,499 for women (73 | 21.4%).
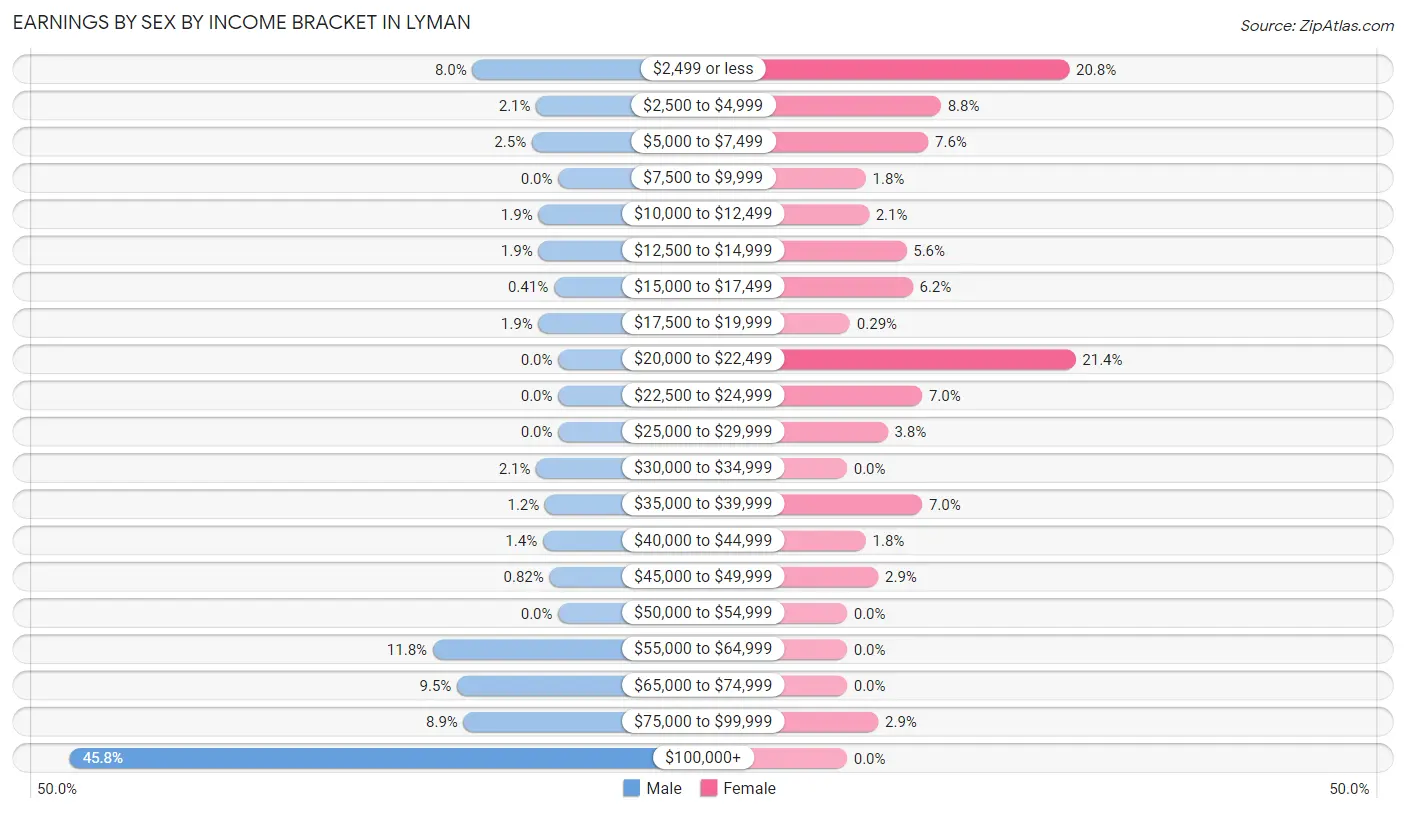
| Income | Male | Female |
| $2,499 or less | 39 (8.0%) | 71 (20.8%) |
| $2,500 to $4,999 | 10 (2.1%) | 30 (8.8%) |
| $5,000 to $7,499 | 12 (2.5%) | 26 (7.6%) |
| $7,500 to $9,999 | 0 (0.0%) | 6 (1.8%) |
| $10,000 to $12,499 | 9 (1.9%) | 7 (2.1%) |
| $12,500 to $14,999 | 9 (1.9%) | 19 (5.6%) |
| $15,000 to $17,499 | 2 (0.4%) | 21 (6.2%) |
| $17,500 to $19,999 | 9 (1.9%) | 1 (0.3%) |
| $20,000 to $22,499 | 0 (0.0%) | 73 (21.4%) |
| $22,500 to $24,999 | 0 (0.0%) | 24 (7.0%) |
| $25,000 to $29,999 | 0 (0.0%) | 13 (3.8%) |
| $30,000 to $34,999 | 10 (2.1%) | 0 (0.0%) |
| $35,000 to $39,999 | 6 (1.2%) | 24 (7.0%) |
| $40,000 to $44,999 | 7 (1.4%) | 6 (1.8%) |
| $45,000 to $49,999 | 4 (0.8%) | 10 (2.9%) |
| $50,000 to $54,999 | 0 (0.0%) | 0 (0.0%) |
| $55,000 to $64,999 | 57 (11.7%) | 0 (0.0%) |
| $65,000 to $74,999 | 46 (9.5%) | 0 (0.0%) |
| $75,000 to $99,999 | 43 (8.9%) | 10 (2.9%) |
| $100,000+ | 222 (45.8%) | 0 (0.0%) |
| Total | 485 (100.0%) | 341 (100.0%) |
Earnings by Sex by Educational Attainment in Lyman
Average earnings in Lyman are $101,042 for men and $21,182 for women, a difference of 79.0%. Men with an educational attainment of graduate degree enjoy the highest average annual earnings of $113,750, while those with less than high school education earn the least with $56,250. Women with an educational attainment of bachelor's degree earn the most with the average annual earnings of $23,636, while those with college or associate's degree education have the smallest earnings of $20,942.
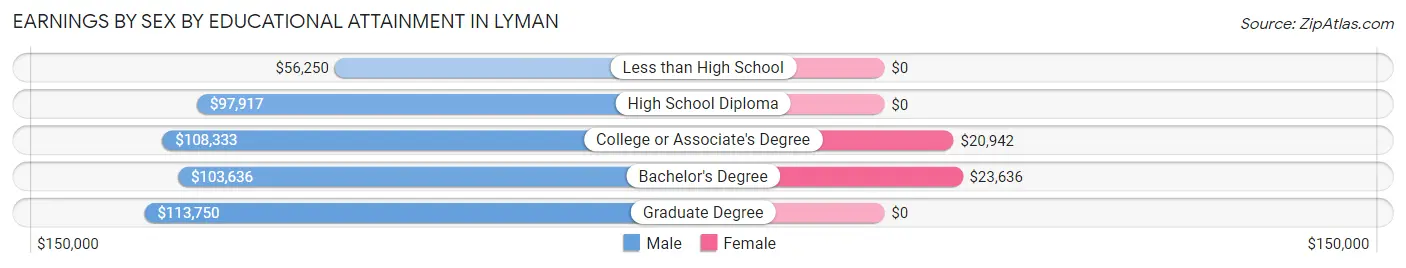
| Educational Attainment | Male Income | Female Income |
| Less than High School | $56,250 | $0 |
| High School Diploma | $97,917 | $0 |
| College or Associate's Degree | $108,333 | $20,942 |
| Bachelor's Degree | $103,636 | $23,636 |
| Graduate Degree | $113,750 | $0 |
| Total | $101,042 | $21,182 |
Family Income in Lyman
Family Income Brackets in Lyman
According to the Lyman family income data, there are 154 families falling into the $100,000 to $149,999 income range, which is the most common income bracket and makes up 34.1% of all families.
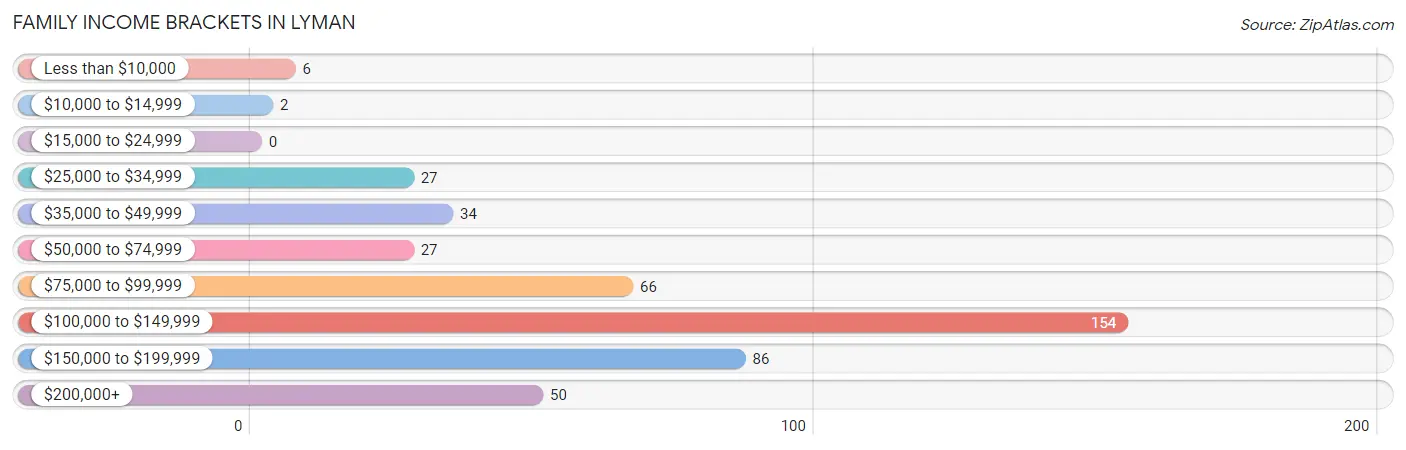
| Income Bracket | # Families | % Families |
| Less than $10,000 | 6 | 1.3% |
| $10,000 to $14,999 | 2 | 0.4% |
| $15,000 to $24,999 | 0 | 0.0% |
| $25,000 to $34,999 | 27 | 6.0% |
| $35,000 to $49,999 | 34 | 7.5% |
| $50,000 to $74,999 | 27 | 6.0% |
| $75,000 to $99,999 | 66 | 14.6% |
| $100,000 to $149,999 | 154 | 34.1% |
| $150,000 to $199,999 | 86 | 19.0% |
| $200,000+ | 50 | 11.1% |
Family Income by Famaliy Size in Lyman
5-person families (96 | 21.2%) account for the highest median family income in Lyman with $153,750 per family, while 2-person families (159 | 35.2%) have the highest median income of $48,177 per family member.
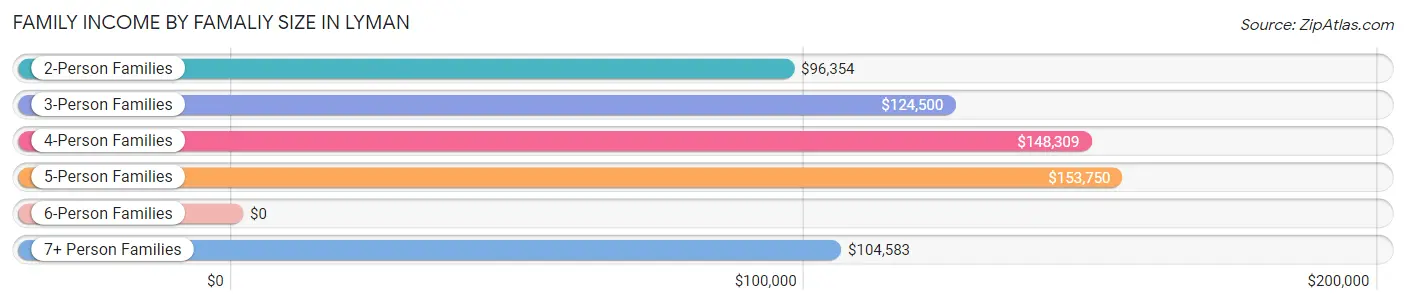
| Income Bracket | # Families | Median Income |
| 2-Person Families | 159 (35.2%) | $96,354 |
| 3-Person Families | 74 (16.4%) | $124,500 |
| 4-Person Families | 97 (21.5%) | $148,309 |
| 5-Person Families | 96 (21.2%) | $153,750 |
| 6-Person Families | 7 (1.5%) | $0 |
| 7+ Person Families | 19 (4.2%) | $104,583 |
| Total | 452 (100.0%) | $120,500 |
Family Income by Number of Earners in Lyman
The median family income in Lyman is $120,500, with families comprising 2 earners (175) having the highest median family income of $141,750, while families with no earners (32) have the lowest median family income of $88,333, accounting for 38.7% and 7.1% of families, respectively.
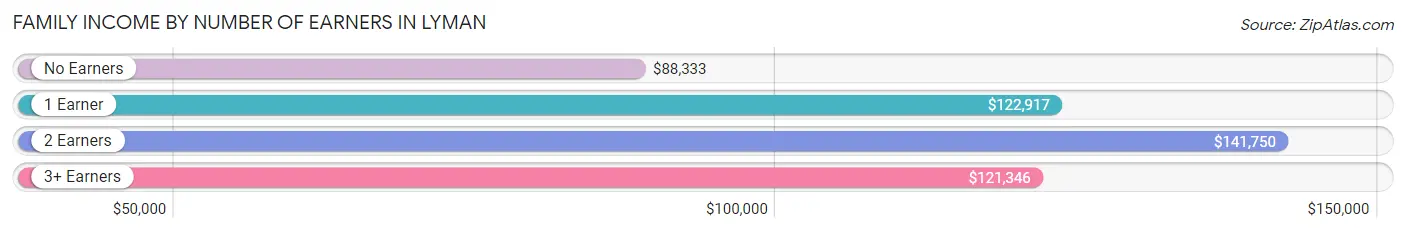
| Number of Earners | # Families | Median Income |
| No Earners | 32 (7.1%) | $88,333 |
| 1 Earner | 195 (43.1%) | $122,917 |
| 2 Earners | 175 (38.7%) | $141,750 |
| 3+ Earners | 50 (11.1%) | $121,346 |
| Total | 452 (100.0%) | $120,500 |
Household Income in Lyman
Household Income Brackets in Lyman
With 164 households falling in the category, the $100,000 to $149,999 income range is the most frequent in Lyman, accounting for 27.7% of all households. In contrast, only 16 households (2.7%) fall into the less than $10,000 income bracket, making it the least populous group.
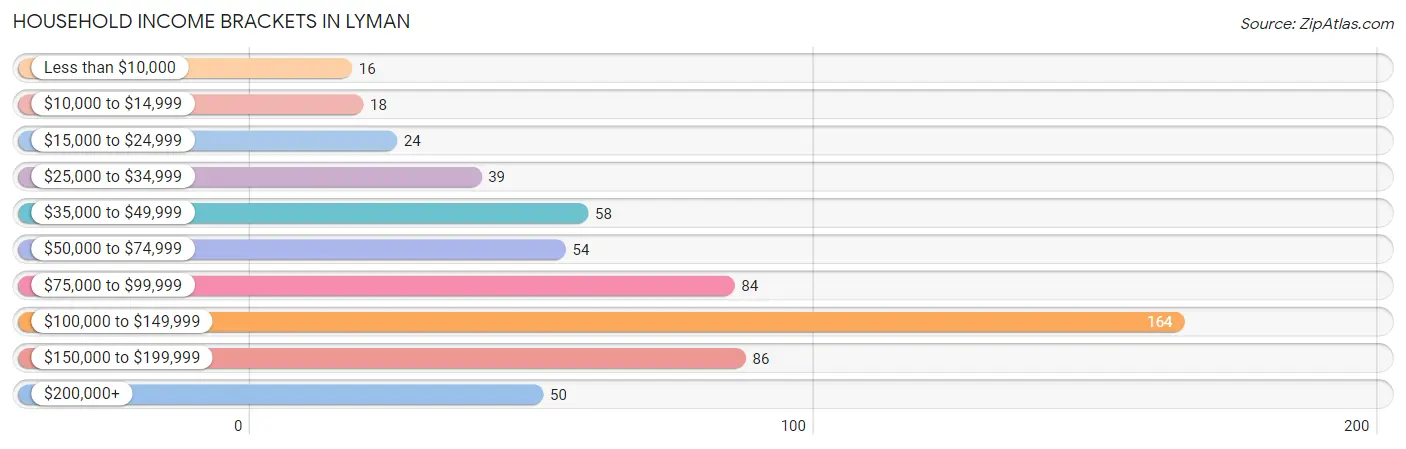
| Income Bracket | # Households | % Households |
| Less than $10,000 | 16 | 2.7% |
| $10,000 to $14,999 | 18 | 3.0% |
| $15,000 to $24,999 | 24 | 4.0% |
| $25,000 to $34,999 | 39 | 6.6% |
| $35,000 to $49,999 | 58 | 9.8% |
| $50,000 to $74,999 | 54 | 9.1% |
| $75,000 to $99,999 | 84 | 14.2% |
| $100,000 to $149,999 | 164 | 27.7% |
| $150,000 to $199,999 | 86 | 14.5% |
| $200,000+ | 50 | 8.4% |
Household Income by Householder Age in Lyman
The median household income in Lyman is $100,875, with the highest median household income of $142,778 found in the 25 to 44 years age bracket for the primary householder. A total of 230 households (38.8%) fall into this category. Meanwhile, the 15 to 24 years age bracket for the primary householder has the lowest median household income of $41,458, with 19 households (3.2%) in this group.
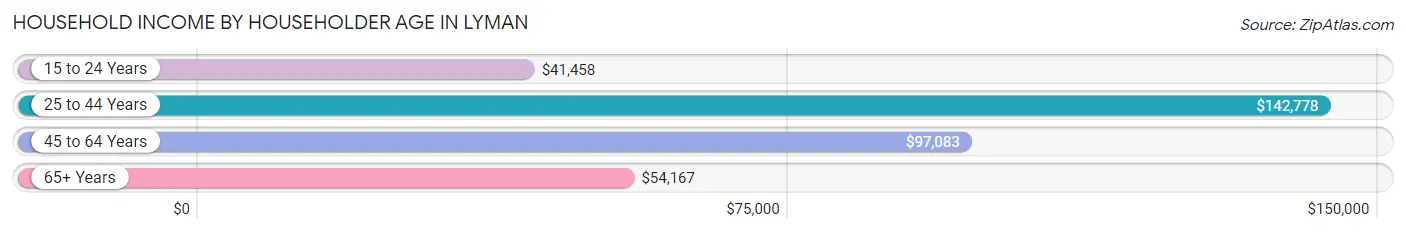
| Income Bracket | # Households | Median Income |
| 15 to 24 Years | 19 (3.2%) | $41,458 |
| 25 to 44 Years | 230 (38.8%) | $142,778 |
| 45 to 64 Years | 204 (34.4%) | $97,083 |
| 65+ Years | 140 (23.6%) | $54,167 |
| Total | 593 (100.0%) | $100,875 |
Poverty in Lyman
Income Below Poverty by Sex and Age in Lyman
With 7.3% poverty level for males and 6.5% for females among the residents of Lyman, 18 to 24 year old males and 18 to 24 year old females are the most vulnerable to poverty, with 18 males (45.0%) and 27 females (47.4%) in their respective age groups living below the poverty level.
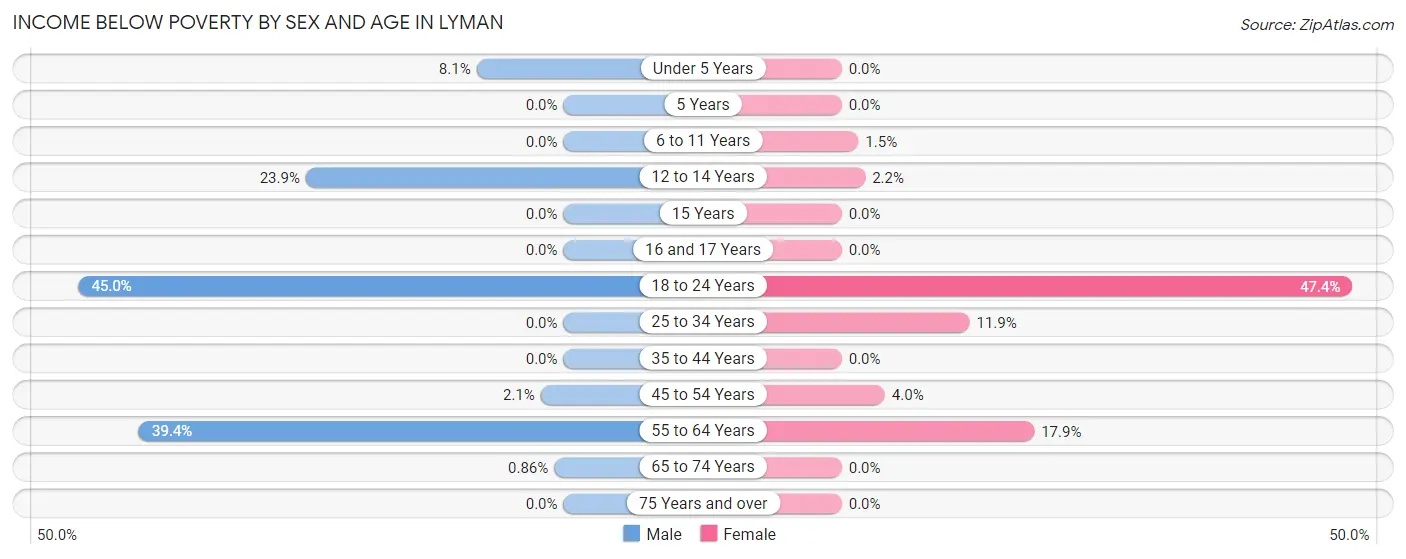
| Age Bracket | Male | Female |
| Under 5 Years | 5 (8.1%) | 0 (0.0%) |
| 5 Years | 0 (0.0%) | 0 (0.0%) |
| 6 to 11 Years | 0 (0.0%) | 1 (1.5%) |
| 12 to 14 Years | 11 (23.9%) | 1 (2.2%) |
| 15 Years | 0 (0.0%) | 0 (0.0%) |
| 16 and 17 Years | 0 (0.0%) | 0 (0.0%) |
| 18 to 24 Years | 18 (45.0%) | 27 (47.4%) |
| 25 to 34 Years | 0 (0.0%) | 7 (11.9%) |
| 35 to 44 Years | 0 (0.0%) | 0 (0.0%) |
| 45 to 54 Years | 3 (2.1%) | 4 (4.0%) |
| 55 to 64 Years | 26 (39.4%) | 15 (17.9%) |
| 65 to 74 Years | 1 (0.9%) | 0 (0.0%) |
| 75 Years and over | 0 (0.0%) | 0 (0.0%) |
| Total | 64 (7.3%) | 55 (6.5%) |
Income Above Poverty by Sex and Age in Lyman
According to the poverty statistics in Lyman, males aged 6 to 11 years and females aged under 5 years are the age groups that are most secure financially, with 100.0% of males and 100.0% of females in these age groups living above the poverty line.
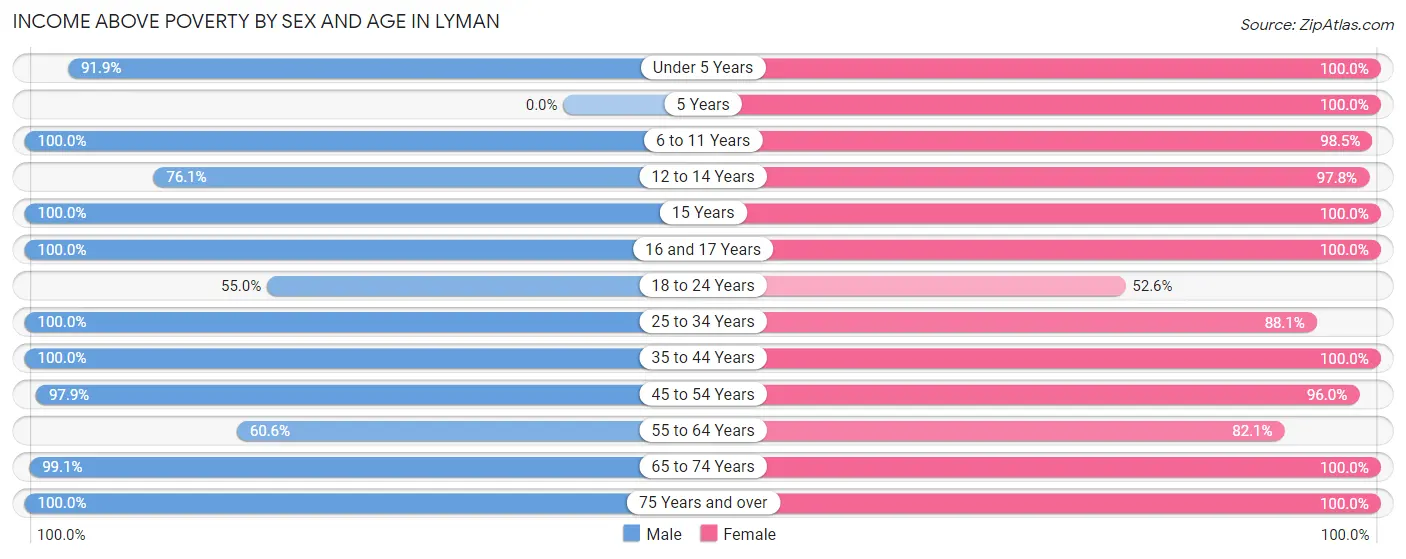
| Age Bracket | Male | Female |
| Under 5 Years | 57 (91.9%) | 40 (100.0%) |
| 5 Years | 0 (0.0%) | 20 (100.0%) |
| 6 to 11 Years | 137 (100.0%) | 64 (98.5%) |
| 12 to 14 Years | 35 (76.1%) | 45 (97.8%) |
| 15 Years | 7 (100.0%) | 89 (100.0%) |
| 16 and 17 Years | 19 (100.0%) | 47 (100.0%) |
| 18 to 24 Years | 22 (55.0%) | 30 (52.6%) |
| 25 to 34 Years | 80 (100.0%) | 52 (88.1%) |
| 35 to 44 Years | 136 (100.0%) | 172 (100.0%) |
| 45 to 54 Years | 139 (97.9%) | 96 (96.0%) |
| 55 to 64 Years | 40 (60.6%) | 69 (82.1%) |
| 65 to 74 Years | 115 (99.1%) | 48 (100.0%) |
| 75 Years and over | 24 (100.0%) | 20 (100.0%) |
| Total | 811 (92.7%) | 792 (93.5%) |
Income Below Poverty Among Married-Couple Families in Lyman
The poverty statistics for married-couple families in Lyman show that 2.5% or 10 of the total 401 families live below the poverty line. Families with 1 or 2 children have the highest poverty rate of 5.6%, comprising of 9 families. On the other hand, families with 3 or 4 children have the lowest poverty rate of 0.0%, which includes 0 families.
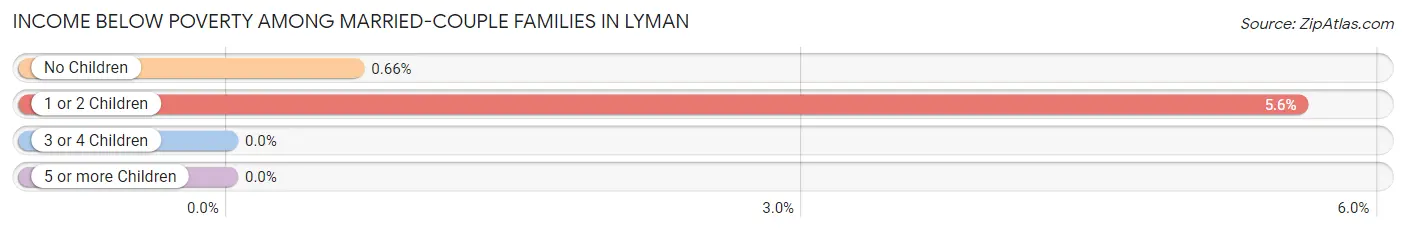
| Children | Above Poverty | Below Poverty |
| No Children | 150 (99.3%) | 1 (0.7%) |
| 1 or 2 Children | 152 (94.4%) | 9 (5.6%) |
| 3 or 4 Children | 70 (100.0%) | 0 (0.0%) |
| 5 or more Children | 19 (100.0%) | 0 (0.0%) |
| Total | 391 (97.5%) | 10 (2.5%) |
Income Below Poverty Among Single-Parent Households in Lyman
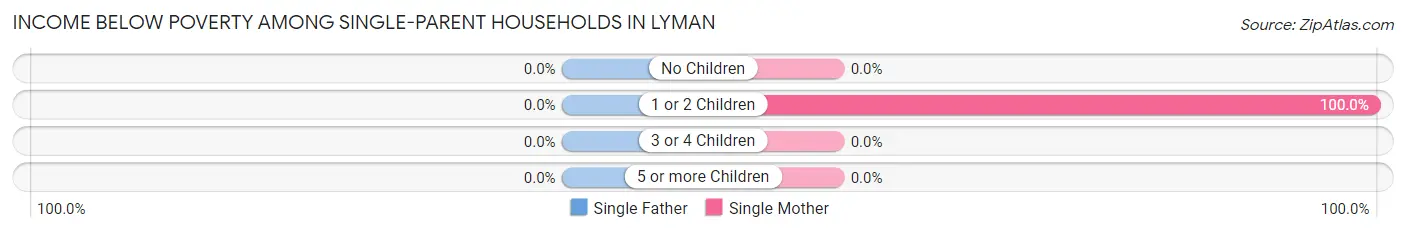
| Children | Single Father | Single Mother |
| No Children | 0 (0.0%) | 0 (0.0%) |
| 1 or 2 Children | 0 (0.0%) | 5 (100.0%) |
| 3 or 4 Children | 0 (0.0%) | 0 (0.0%) |
| 5 or more Children | 0 (0.0%) | 0 (0.0%) |
| Total | 0 (0.0%) | 5 (41.7%) |
Income Below Poverty Among Married-Couple vs Single-Parent Households in Lyman
The poverty data for Lyman shows that 10 of the married-couple family households (2.5%) and 5 of the single-parent households (9.8%) are living below the poverty level. Within the married-couple family households, those with 1 or 2 children have the highest poverty rate, with 9 households (5.6%) falling below the poverty line. Among the single-parent households, those with 1 or 2 children have the highest poverty rate, with 5 household (45.5%) living below poverty.
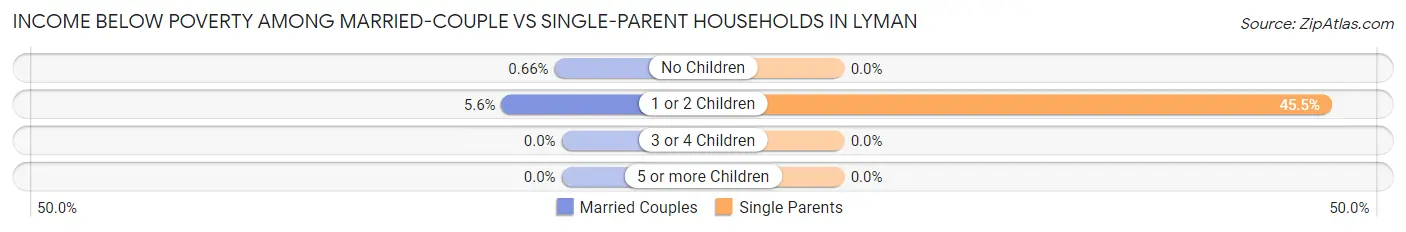
| Children | Married-Couple Families | Single-Parent Households |
| No Children | 1 (0.7%) | 0 (0.0%) |
| 1 or 2 Children | 9 (5.6%) | 5 (45.5%) |
| 3 or 4 Children | 0 (0.0%) | 0 (0.0%) |
| 5 or more Children | 0 (0.0%) | 0 (0.0%) |
| Total | 10 (2.5%) | 5 (9.8%) |
Race in Lyman
The most populous races in Lyman are White / Caucasian (1,579 | 91.0%), Hispanic or Latino (142 | 8.2%), and Two or more Races (141 | 8.1%).
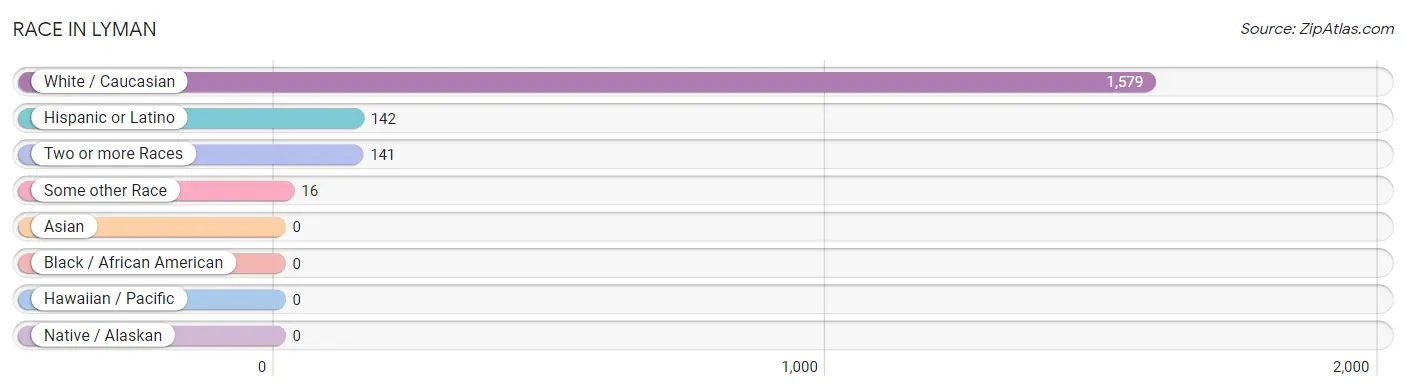
| Race | # Population | % Population |
| Asian | 0 | 0.0% |
| Black / African American | 0 | 0.0% |
| Hawaiian / Pacific | 0 | 0.0% |
| Hispanic or Latino | 142 | 8.2% |
| Native / Alaskan | 0 | 0.0% |
| White / Caucasian | 1,579 | 91.0% |
| Two or more Races | 141 | 8.1% |
| Some other Race | 16 | 0.9% |
| Total | 1,736 | 100.0% |
Ancestry in Lyman
The most populous ancestries reported in Lyman are English (749 | 43.1%), German (294 | 16.9%), Scottish (177 | 10.2%), Irish (153 | 8.8%), and Mexican (130 | 7.5%), together accounting for 86.6% of all Lyman residents.
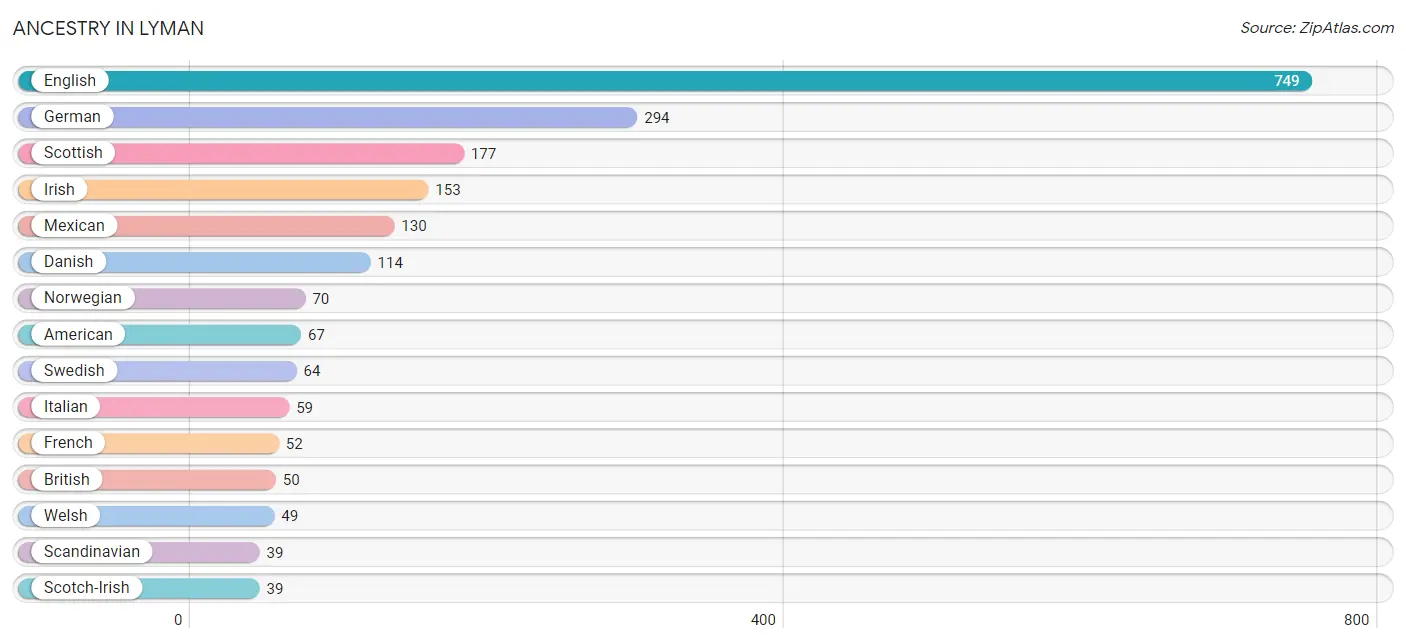
| Ancestry | # Population | % Population |
| American | 67 | 3.9% |
| Apache | 14 | 0.8% |
| Blackfeet | 26 | 1.5% |
| British | 50 | 2.9% |
| Central American | 6 | 0.4% |
| Cherokee | 33 | 1.9% |
| Chippewa | 14 | 0.8% |
| Danish | 114 | 6.6% |
| Dutch | 29 | 1.7% |
| English | 749 | 43.1% |
| European | 36 | 2.1% |
| Finnish | 12 | 0.7% |
| French | 52 | 3.0% |
| German | 294 | 16.9% |
| Greek | 12 | 0.7% |
| Hungarian | 3 | 0.2% |
| Indian (Asian) | 2 | 0.1% |
| Irish | 153 | 8.8% |
| Italian | 59 | 3.4% |
| Korean | 2 | 0.1% |
| Mexican | 130 | 7.5% |
| Native Hawaiian | 2 | 0.1% |
| Navajo | 2 | 0.1% |
| Norwegian | 70 | 4.0% |
| Panamanian | 6 | 0.4% |
| Polish | 25 | 1.4% |
| Portuguese | 12 | 0.7% |
| Russian | 24 | 1.4% |
| Scandinavian | 39 | 2.2% |
| Scotch-Irish | 39 | 2.2% |
| Scottish | 177 | 10.2% |
| Seminole | 2 | 0.1% |
| Shoshone | 18 | 1.0% |
| Slovene | 6 | 0.4% |
| Spanish | 6 | 0.4% |
| Swedish | 64 | 3.7% |
| Swiss | 13 | 0.7% |
| Ukrainian | 6 | 0.4% |
| Ute | 8 | 0.5% |
| Welsh | 49 | 2.8% |
| Yugoslavian | 2 | 0.1% | View All 41 Rows |
Immigrants in Lyman
The most numerous immigrant groups reported in Lyman came from Central America (11 | 0.6%), Latin America (11 | 0.6%), Mexico (11 | 0.6%), Canada (6 | 0.4%), and Europe (2 | 0.1%), together accounting for 2.4% of all Lyman residents.
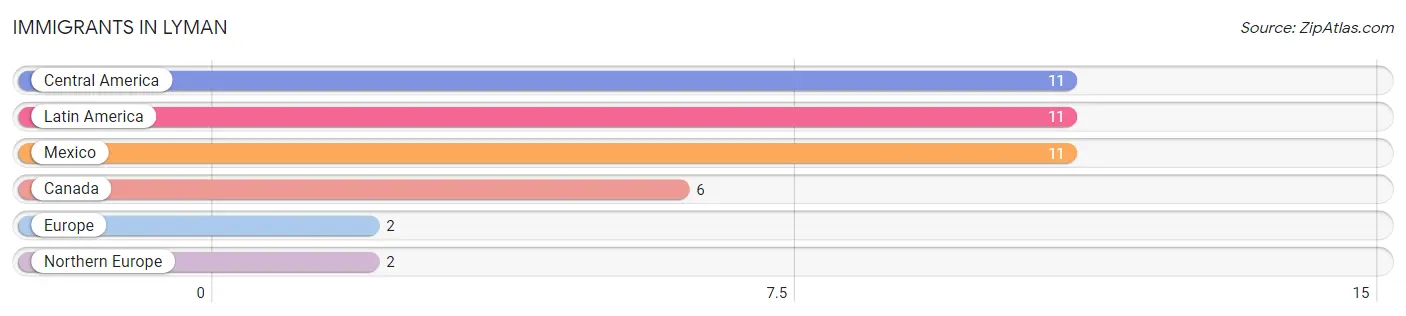
| Immigration Origin | # Population | % Population |
| Canada | 6 | 0.4% |
| Central America | 11 | 0.6% |
| Europe | 2 | 0.1% |
| Latin America | 11 | 0.6% |
| Mexico | 11 | 0.6% |
| Northern Europe | 2 | 0.1% | View All 6 Rows |
Sex and Age in Lyman
Sex and Age in Lyman
The most populous age groups in Lyman are 5 to 9 Years (99 | 11.1%) for men and 15 to 19 Years (164 | 19.4%) for women.
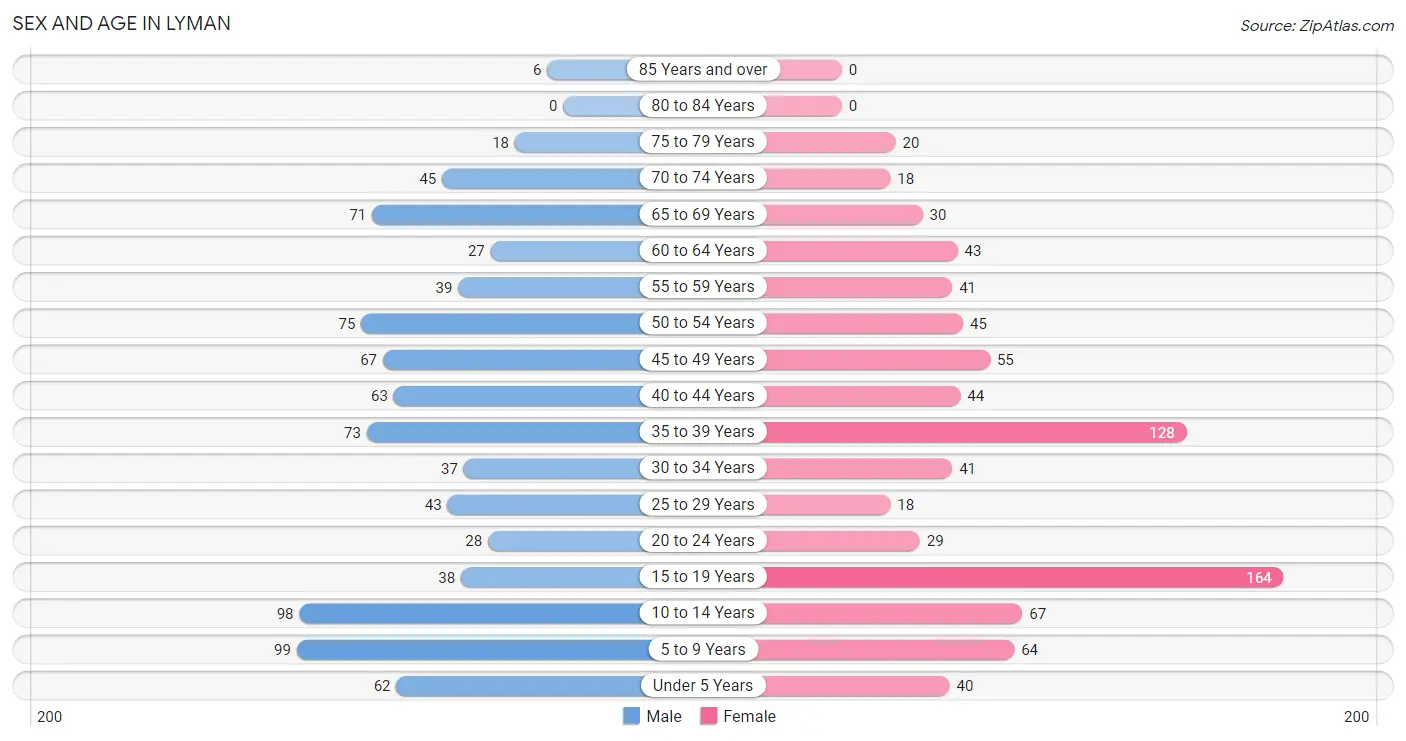
| Age Bracket | Male | Female |
| Under 5 Years | 62 (7.0%) | 40 (4.7%) |
| 5 to 9 Years | 99 (11.1%) | 64 (7.6%) |
| 10 to 14 Years | 98 (11.0%) | 67 (7.9%) |
| 15 to 19 Years | 38 (4.3%) | 164 (19.4%) |
| 20 to 24 Years | 28 (3.2%) | 29 (3.4%) |
| 25 to 29 Years | 43 (4.8%) | 18 (2.1%) |
| 30 to 34 Years | 37 (4.2%) | 41 (4.8%) |
| 35 to 39 Years | 73 (8.2%) | 128 (15.1%) |
| 40 to 44 Years | 63 (7.1%) | 44 (5.2%) |
| 45 to 49 Years | 67 (7.5%) | 55 (6.5%) |
| 50 to 54 Years | 75 (8.4%) | 45 (5.3%) |
| 55 to 59 Years | 39 (4.4%) | 41 (4.8%) |
| 60 to 64 Years | 27 (3.0%) | 43 (5.1%) |
| 65 to 69 Years | 71 (8.0%) | 30 (3.5%) |
| 70 to 74 Years | 45 (5.1%) | 18 (2.1%) |
| 75 to 79 Years | 18 (2.0%) | 20 (2.4%) |
| 80 to 84 Years | 0 (0.0%) | 0 (0.0%) |
| 85 Years and over | 6 (0.7%) | 0 (0.0%) |
| Total | 889 (100.0%) | 847 (100.0%) |
Families and Households in Lyman
Median Family Size in Lyman
The median family size in Lyman is 3.42 persons per family, with single female/mother families (12 | 2.6%) accounting for the largest median family size of 4.5 persons per family. On the other hand, single male/father families (39 | 8.6%) represent the smallest median family size with 1.54 persons per family.
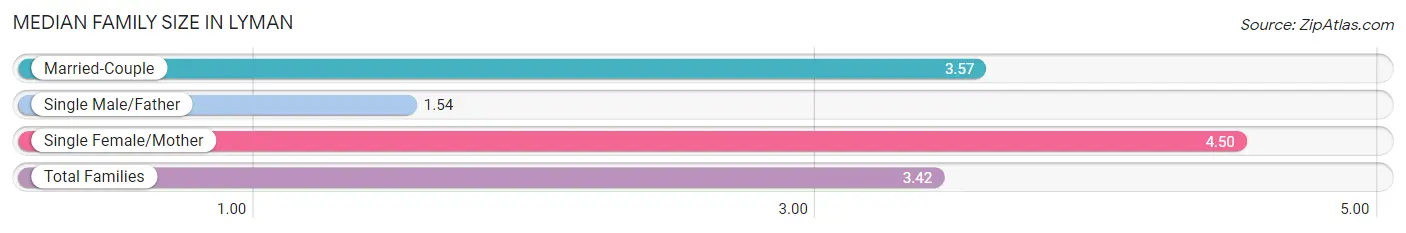
| Family Type | # Families | Family Size |
| Married-Couple | 401 (88.7%) | 3.57 |
| Single Male/Father | 39 (8.6%) | 1.54 |
| Single Female/Mother | 12 (2.6%) | 4.50 |
| Total Families | 452 (100.0%) | 3.42 |
Median Household Size in Lyman
The median household size in Lyman is 2.93 persons per household, with single female/mother households (12 | 2.0%) accounting for the largest median household size of 6.42 persons per household. non-family households (141 | 23.8%) represent the smallest median household size with 1.09 persons per household.
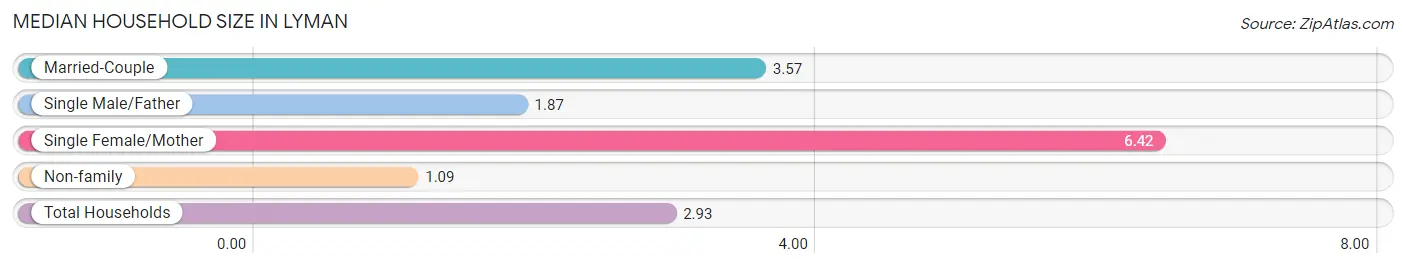
| Household Type | # Households | Household Size |
| Married-Couple | 401 (67.6%) | 3.57 |
| Single Male/Father | 39 (6.6%) | 1.87 |
| Single Female/Mother | 12 (2.0%) | 6.42 |
| Non-family | 141 (23.8%) | 1.09 |
| Total Households | 593 (100.0%) | 2.93 |
Household Size by Marriage Status in Lyman
Out of a total of 593 households in Lyman, 452 (76.2%) are family households, while 141 (23.8%) are nonfamily households. The most numerous type of family households are 2-person households, comprising 150, and the most common type of nonfamily households are 1-person households, comprising 135.
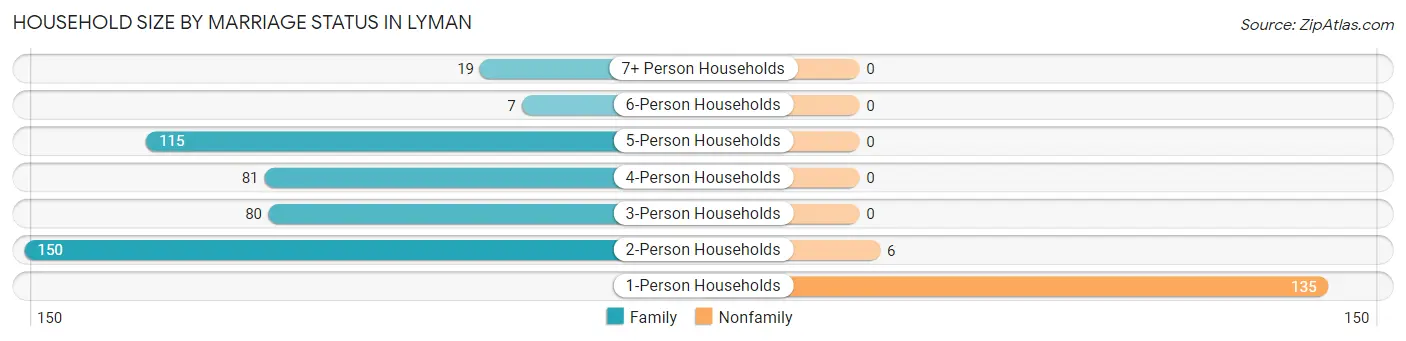
| Household Size | Family Households | Nonfamily Households |
| 1-Person Households | - | 135 (22.8%) |
| 2-Person Households | 150 (25.3%) | 6 (1.0%) |
| 3-Person Households | 80 (13.5%) | 0 (0.0%) |
| 4-Person Households | 81 (13.7%) | 0 (0.0%) |
| 5-Person Households | 115 (19.4%) | 0 (0.0%) |
| 6-Person Households | 7 (1.2%) | 0 (0.0%) |
| 7+ Person Households | 19 (3.2%) | 0 (0.0%) |
| Total | 452 (76.2%) | 141 (23.8%) |
Female Fertility in Lyman
Fertility by Age in Lyman
Average fertility rate in Lyman is 46.0 births per 1,000 women. Women in the age bracket of 20 to 34 years have the highest fertility rate with 136.0 births per 1,000 women. Women in the age bracket of 20 to 34 years acount for 54.5% of all women with births.
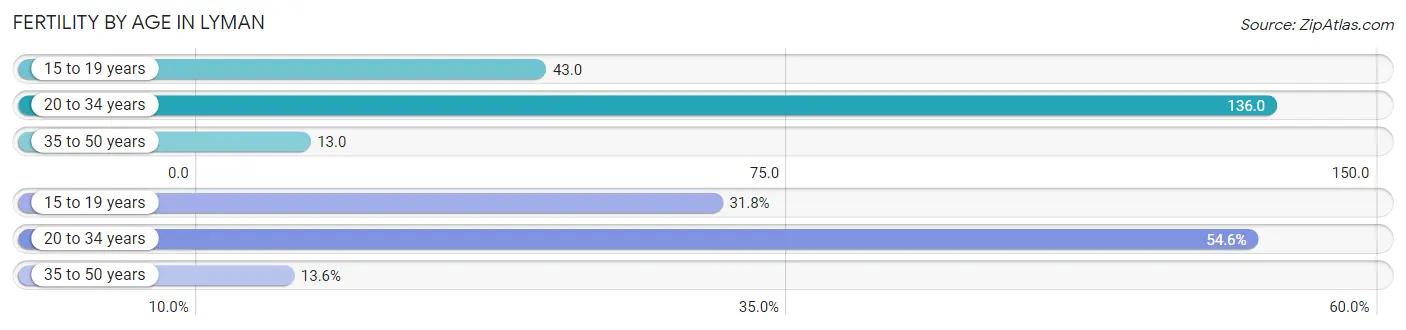
| Age Bracket | Women with Births | Births / 1,000 Women |
| 15 to 19 years | 7 (31.8%) | 43.0 |
| 20 to 34 years | 12 (54.5%) | 136.0 |
| 35 to 50 years | 3 (13.6%) | 13.0 |
| Total | 22 (100.0%) | 46.0 |
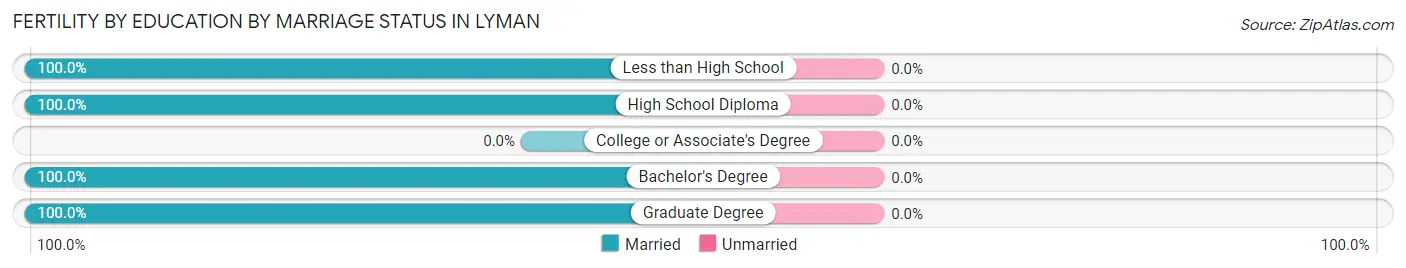
Fertility by Age by Marriage Status in Lyman
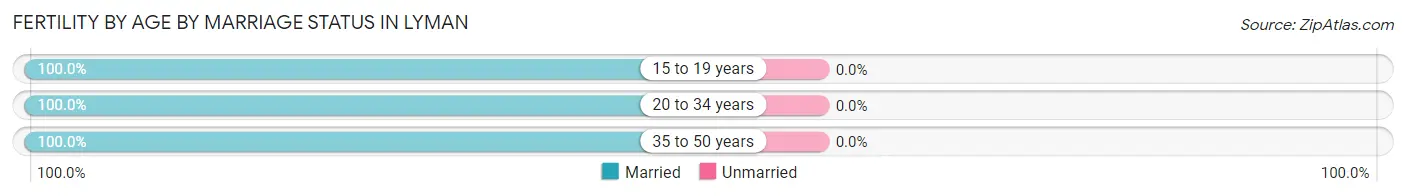
| Age Bracket | Married | Unmarried |
| 15 to 19 years | 7 (100.0%) | 0 (0.0%) |
| 20 to 34 years | 12 (100.0%) | 0 (0.0%) |
| 35 to 50 years | 3 (100.0%) | 0 (0.0%) |
| Total | 22 (100.0%) | 0 (0.0%) |
Fertility by Education in Lyman
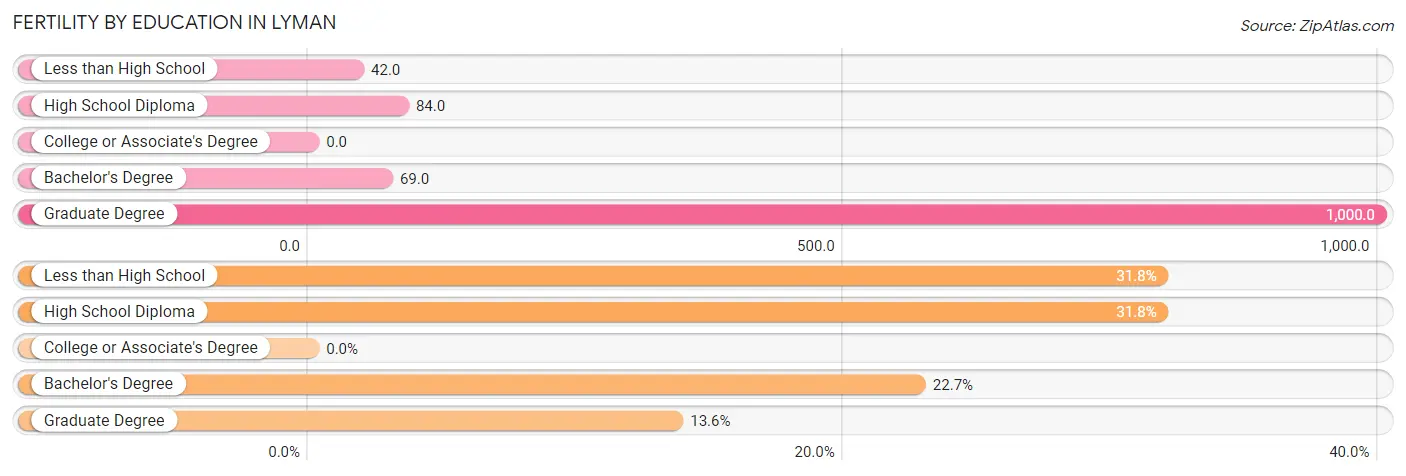
| Educational Attainment | Women with Births | Births / 1,000 Women |
| Less than High School | 7 (31.8%) | 42.0 |
| High School Diploma | 7 (31.8%) | 84.0 |
| College or Associate's Degree | 0 (0.0%) | 0.0 |
| Bachelor's Degree | 5 (22.7%) | 69.0 |
| Graduate Degree | 3 (13.6%) | 1,000.0 |
| Total | 22 (100.0%) | 46.0 |
Fertility by Education by Marriage Status in Lyman
| Educational Attainment | Married | Unmarried |
| Less than High School | 7 (100.0%) | 0 (0.0%) |
| High School Diploma | 7 (100.0%) | 0 (0.0%) |
| College or Associate's Degree | 0 (0.0%) | 0 (0.0%) |
| Bachelor's Degree | 5 (100.0%) | 0 (0.0%) |
| Graduate Degree | 3 (100.0%) | 0 (0.0%) |
| Total | 22 (100.0%) | 0 (0.0%) |
Employment Characteristics in Lyman
Employment by Class of Employer in Lyman
Among the 645 employed individuals in Lyman, private company employees (453 | 70.2%), self-employed (not incorporated) (76 | 11.8%), and local government employees (54 | 8.4%) make up the most common classes of employment.
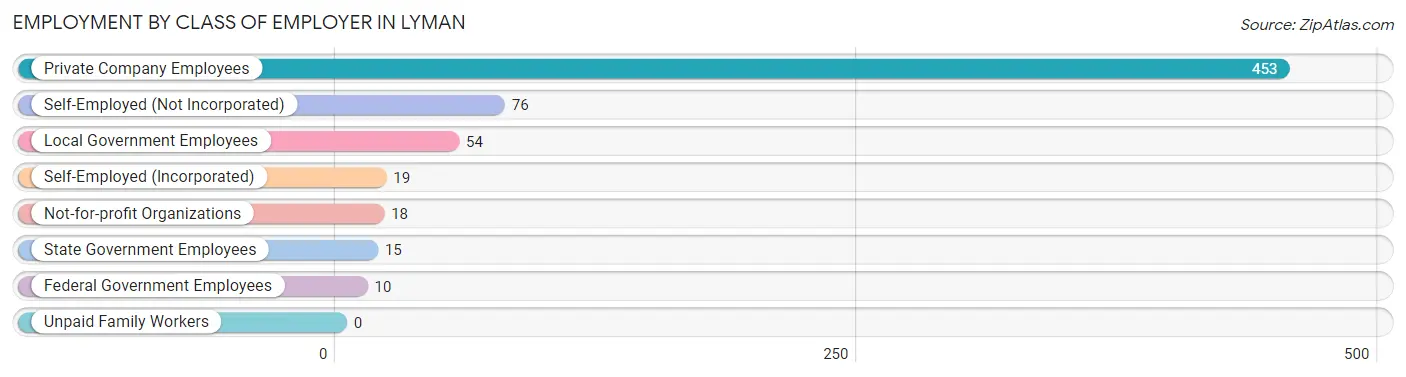
| Employer Class | # Employees | % Employees |
| Private Company Employees | 453 | 70.2% |
| Self-Employed (Incorporated) | 19 | 2.9% |
| Self-Employed (Not Incorporated) | 76 | 11.8% |
| Not-for-profit Organizations | 18 | 2.8% |
| Local Government Employees | 54 | 8.4% |
| State Government Employees | 15 | 2.3% |
| Federal Government Employees | 10 | 1.5% |
| Unpaid Family Workers | 0 | 0.0% |
| Total | 645 | 100.0% |
Employment Status by Age in Lyman
According to the labor force statistics for Lyman, out of the total population over 16 years of age (1,210), 56.8% or 687 individuals are in the labor force, with 4.2% or 29 of them unemployed. The age group with the highest labor force participation rate is 30 to 34 years, with 88.5% or 69 individuals in the labor force. Within the labor force, the 20 to 24 years age range has the highest percentage of unemployed individuals, with 22.5% or 9 of them being unemployed.
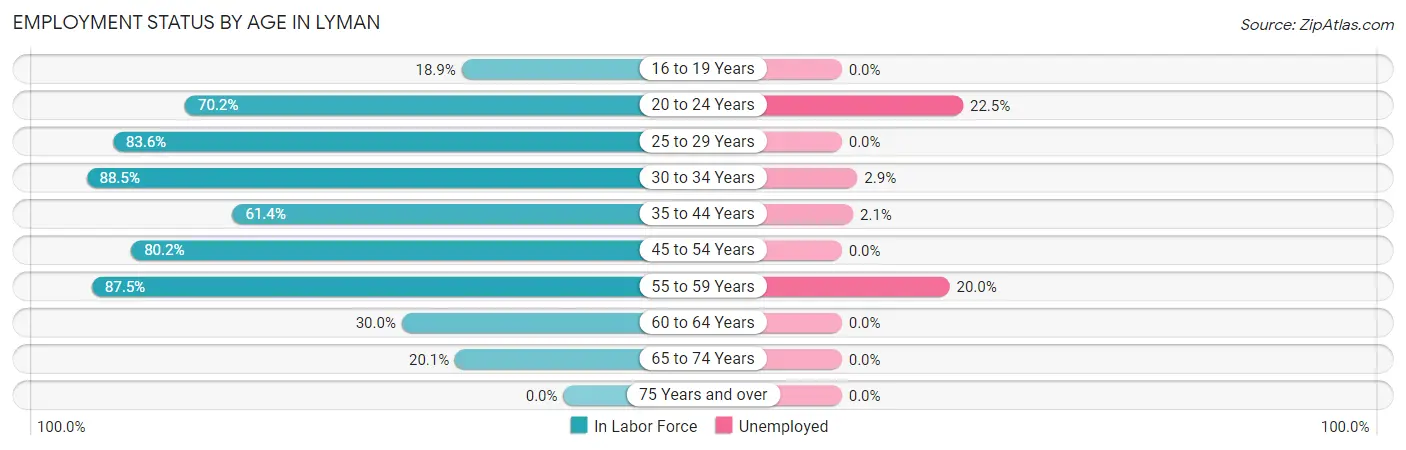
| Age Bracket | In Labor Force | Unemployed |
| 16 to 19 Years | 20 (18.9%) | 0 (0.0%) |
| 20 to 24 Years | 40 (70.2%) | 9 (22.5%) |
| 25 to 29 Years | 51 (83.6%) | 0 (0.0%) |
| 30 to 34 Years | 69 (88.5%) | 2 (2.9%) |
| 35 to 44 Years | 189 (61.4%) | 4 (2.1%) |
| 45 to 54 Years | 194 (80.2%) | 0 (0.0%) |
| 55 to 59 Years | 70 (87.5%) | 14 (20.0%) |
| 60 to 64 Years | 21 (30.0%) | 0 (0.0%) |
| 65 to 74 Years | 33 (20.1%) | 0 (0.0%) |
| 75 Years and over | 0 (0.0%) | 0 (0.0%) |
| Total | 687 (56.8%) | 29 (4.2%) |
Employment Status by Educational Attainment in Lyman
According to labor force statistics for Lyman, 70.8% of individuals (594) out of the total population between 25 and 64 years of age (839) are in the labor force, with 3.4% or 20 of them being unemployed. The group with the highest labor force participation rate are those with the educational attainment of college / associate degree, with 78.0% or 297 individuals in the labor force. Within the labor force, individuals with college / associate degree education have the highest percentage of unemployment, with 5.4% or 16 of them being unemployed.
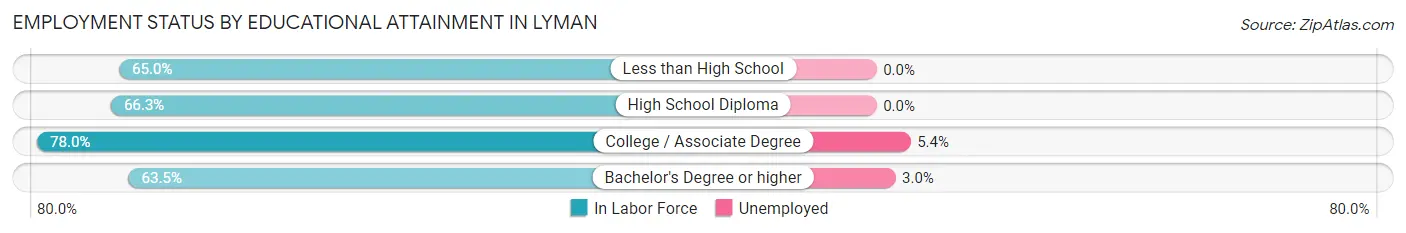
| Educational Attainment | In Labor Force | Unemployed |
| Less than High School | 39 (65.0%) | 0 (0.0%) |
| High School Diploma | 124 (66.3%) | 0 (0.0%) |
| College / Associate Degree | 297 (78.0%) | 21 (5.4%) |
| Bachelor's Degree or higher | 134 (63.5%) | 6 (3.0%) |
| Total | 594 (70.8%) | 29 (3.4%) |
Employment Occupations by Sex in Lyman
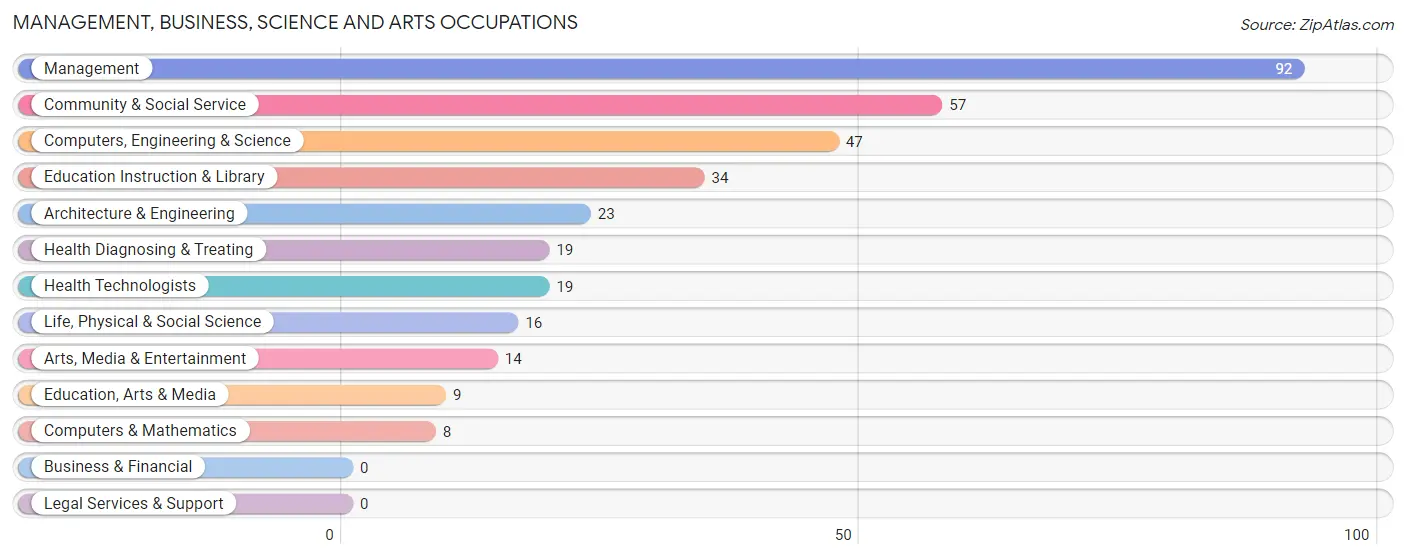
Management, Business, Science and Arts Occupations
The most common Management, Business, Science and Arts occupations in Lyman are Management (92 | 14.0%), Community & Social Service (57 | 8.7%), Computers, Engineering & Science (47 | 7.1%), Education Instruction & Library (34 | 5.2%), and Architecture & Engineering (23 | 3.5%).
Management, Business, Science and Arts Occupations by Sex
Within the Management, Business, Science and Arts occupations in Lyman, the most male-oriented occupations are Management (100.0%), Computers, Engineering & Science (100.0%), and Computers & Mathematics (100.0%), while the most female-oriented occupations are Arts, Media & Entertainment (85.7%), Education Instruction & Library (76.5%), and Community & Social Service (66.7%).
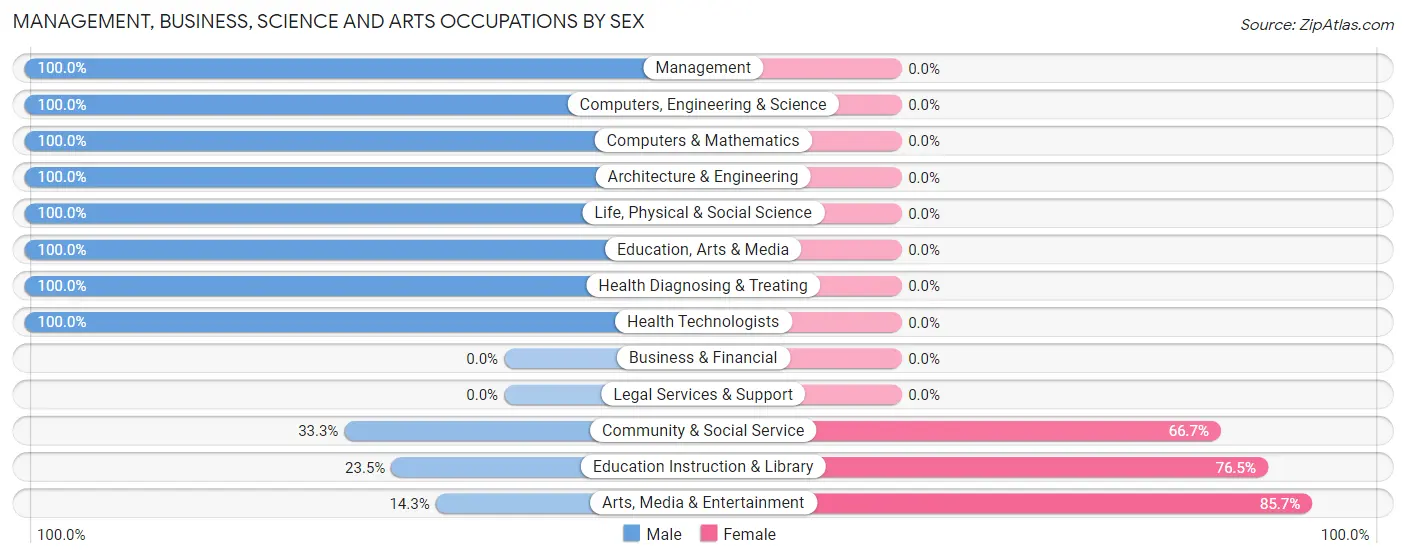
| Occupation | Male | Female |
| Management | 92 (100.0%) | 0 (0.0%) |
| Business & Financial | 0 (0.0%) | 0 (0.0%) |
| Computers, Engineering & Science | 47 (100.0%) | 0 (0.0%) |
| Computers & Mathematics | 8 (100.0%) | 0 (0.0%) |
| Architecture & Engineering | 23 (100.0%) | 0 (0.0%) |
| Life, Physical & Social Science | 16 (100.0%) | 0 (0.0%) |
| Community & Social Service | 19 (33.3%) | 38 (66.7%) |
| Education, Arts & Media | 9 (100.0%) | 0 (0.0%) |
| Legal Services & Support | 0 (0.0%) | 0 (0.0%) |
| Education Instruction & Library | 8 (23.5%) | 26 (76.5%) |
| Arts, Media & Entertainment | 2 (14.3%) | 12 (85.7%) |
| Health Diagnosing & Treating | 19 (100.0%) | 0 (0.0%) |
| Health Technologists | 19 (100.0%) | 0 (0.0%) |
| Total (Category) | 177 (82.3%) | 38 (17.7%) |
| Total (Overall) | 422 (64.1%) | 236 (35.9%) |
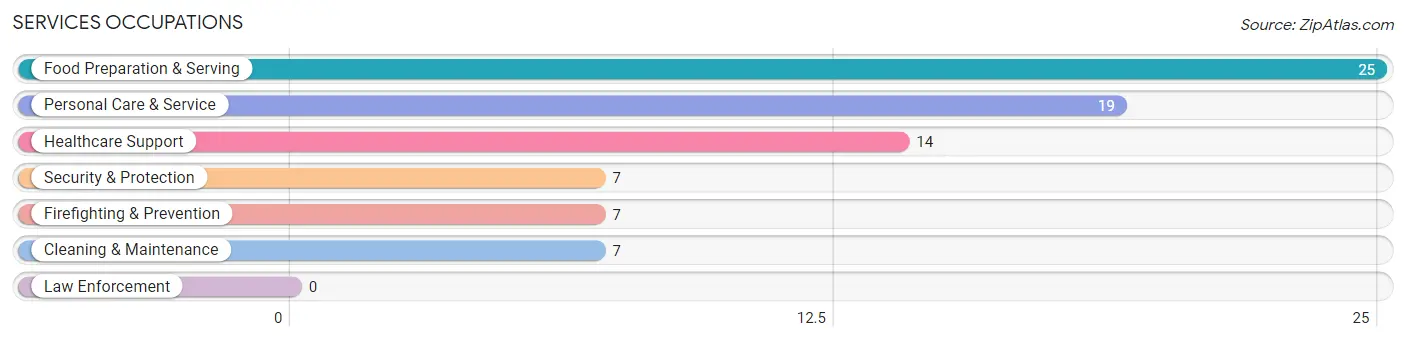
Services Occupations
The most common Services occupations in Lyman are Food Preparation & Serving (25 | 3.8%), Personal Care & Service (19 | 2.9%), Healthcare Support (14 | 2.1%), Security & Protection (7 | 1.1%), and Firefighting & Prevention (7 | 1.1%).
Services Occupations by Sex
Within the Services occupations in Lyman, the most male-oriented occupations are Personal Care & Service (31.6%), and Cleaning & Maintenance (28.6%), while the most female-oriented occupations are Healthcare Support (100.0%), Security & Protection (100.0%), and Firefighting & Prevention (100.0%).
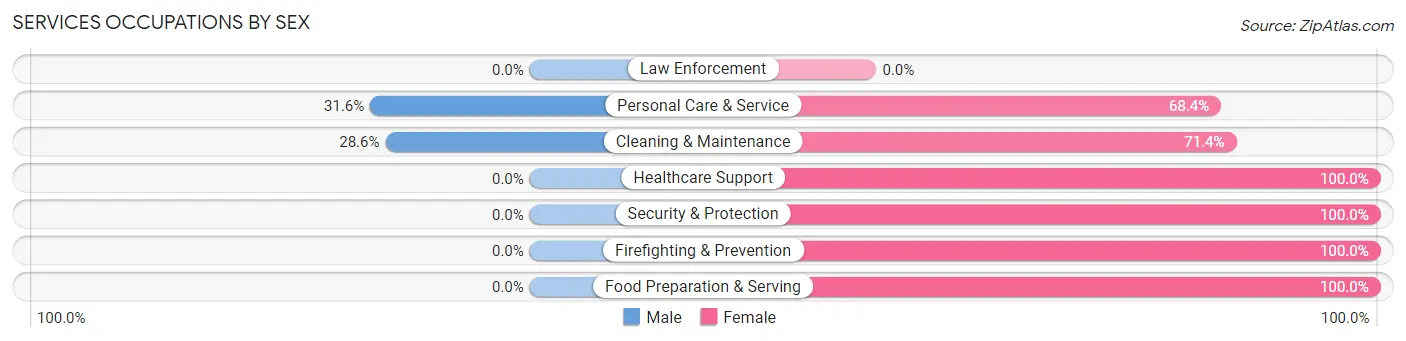
| Occupation | Male | Female |
| Healthcare Support | 0 (0.0%) | 14 (100.0%) |
| Security & Protection | 0 (0.0%) | 7 (100.0%) |
| Firefighting & Prevention | 0 (0.0%) | 7 (100.0%) |
| Law Enforcement | 0 (0.0%) | 0 (0.0%) |
| Food Preparation & Serving | 0 (0.0%) | 25 (100.0%) |
| Cleaning & Maintenance | 2 (28.6%) | 5 (71.4%) |
| Personal Care & Service | 6 (31.6%) | 13 (68.4%) |
| Total (Category) | 8 (11.1%) | 64 (88.9%) |
| Total (Overall) | 422 (64.1%) | 236 (35.9%) |
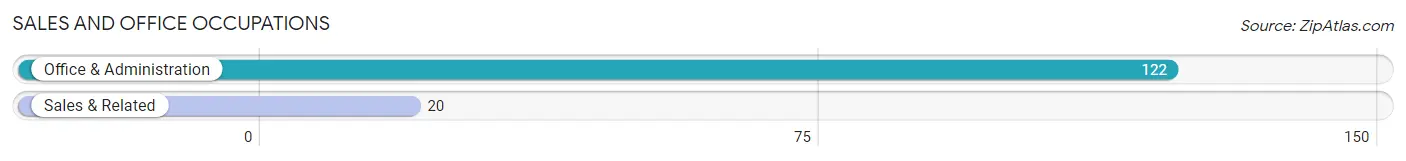
Sales and Office Occupations
The most common Sales and Office occupations in Lyman are Office & Administration (122 | 18.5%), and Sales & Related (20 | 3.0%).
Sales and Office Occupations by Sex
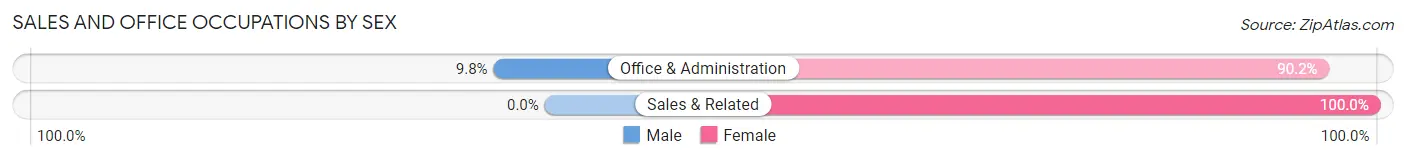
| Occupation | Male | Female |
| Sales & Related | 0 (0.0%) | 20 (100.0%) |
| Office & Administration | 12 (9.8%) | 110 (90.2%) |
| Total (Category) | 12 (8.5%) | 130 (91.5%) |
| Total (Overall) | 422 (64.1%) | 236 (35.9%) |
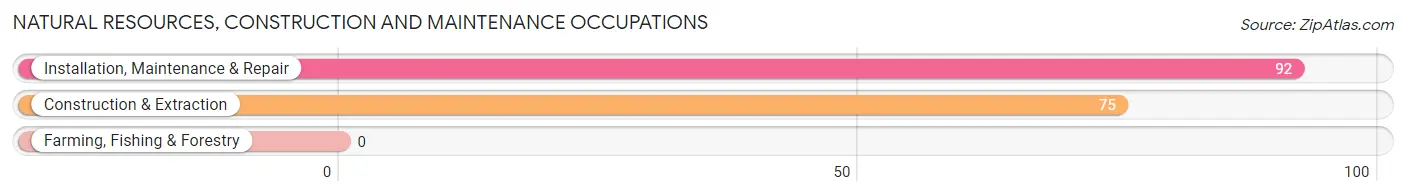
Natural Resources, Construction and Maintenance Occupations
The most common Natural Resources, Construction and Maintenance occupations in Lyman are Installation, Maintenance & Repair (92 | 14.0%), and Construction & Extraction (75 | 11.4%).
Natural Resources, Construction and Maintenance Occupations by Sex
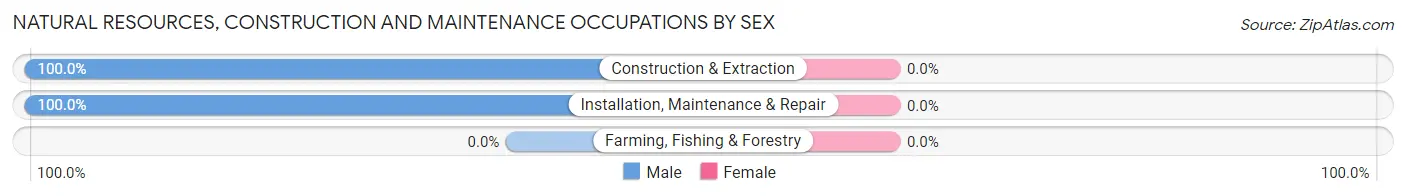
| Occupation | Male | Female |
| Farming, Fishing & Forestry | 0 (0.0%) | 0 (0.0%) |
| Construction & Extraction | 75 (100.0%) | 0 (0.0%) |
| Installation, Maintenance & Repair | 92 (100.0%) | 0 (0.0%) |
| Total (Category) | 167 (100.0%) | 0 (0.0%) |
| Total (Overall) | 422 (64.1%) | 236 (35.9%) |
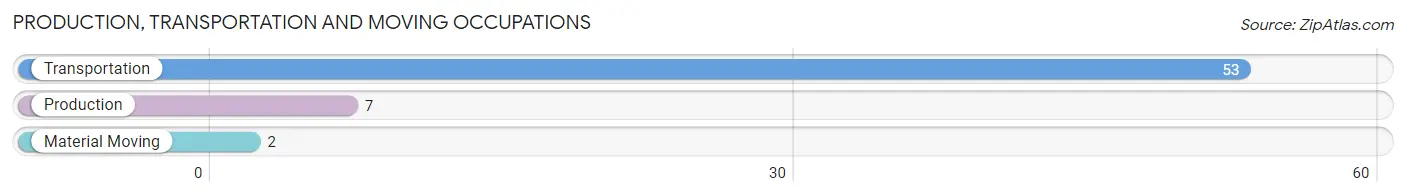
Production, Transportation and Moving Occupations
The most common Production, Transportation and Moving occupations in Lyman are Transportation (53 | 8.1%), Production (7 | 1.1%), and Material Moving (2 | 0.3%).
Production, Transportation and Moving Occupations by Sex
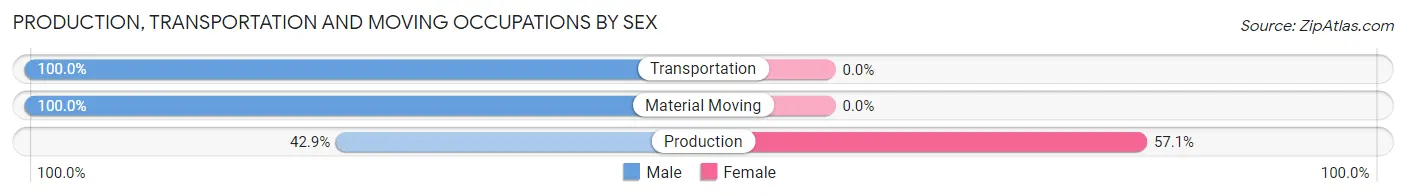
| Occupation | Male | Female |
| Production | 3 (42.9%) | 4 (57.1%) |
| Transportation | 53 (100.0%) | 0 (0.0%) |
| Material Moving | 2 (100.0%) | 0 (0.0%) |
| Total (Category) | 58 (93.5%) | 4 (6.5%) |
| Total (Overall) | 422 (64.1%) | 236 (35.9%) |
Employment Industries by Sex in Lyman
Employment Industries in Lyman
The major employment industries in Lyman include Mining, Quarrying, & Extraction (119 | 18.1%), Health Care & Social Assistance (97 | 14.7%), Construction (92 | 14.0%), Educational Services (85 | 12.9%), and Transportation & Warehousing (59 | 9.0%).
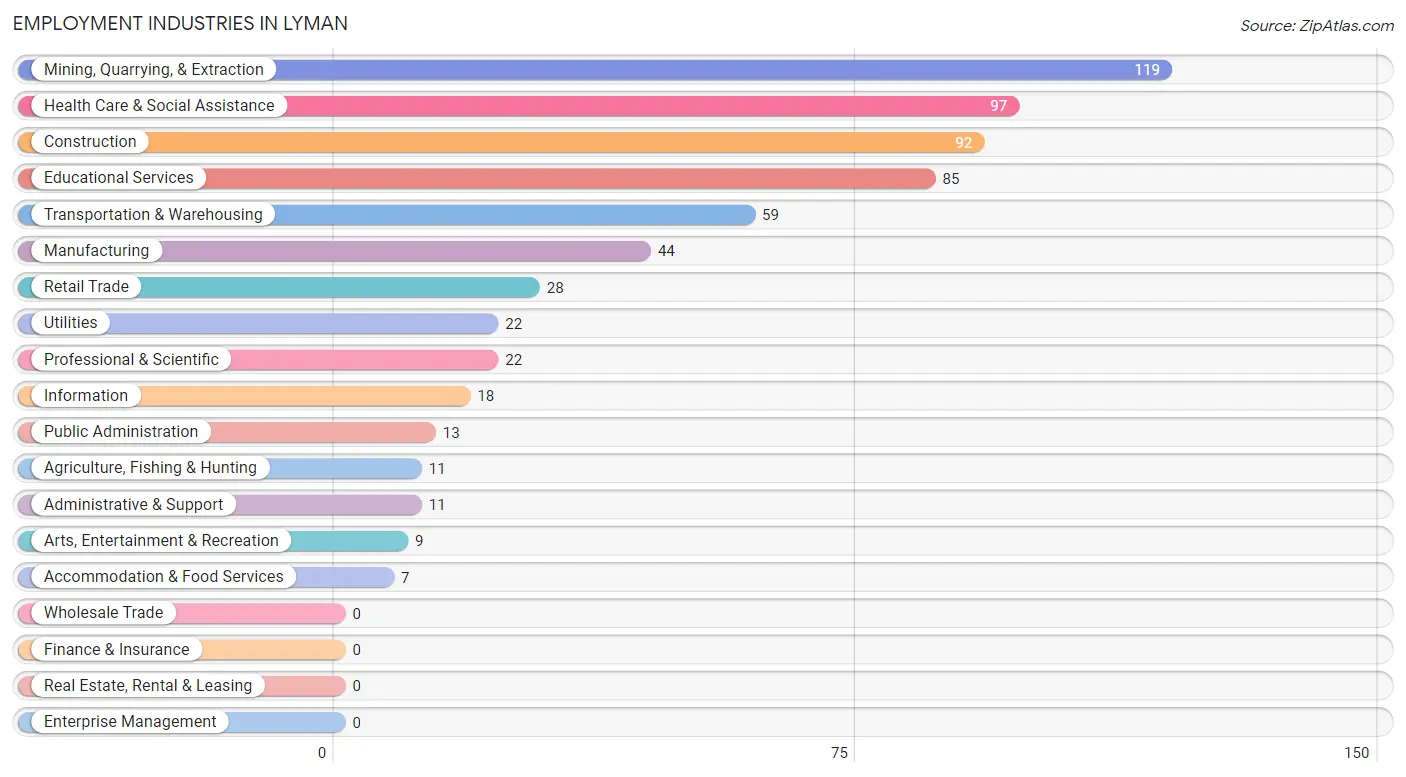
Employment Industries by Sex in Lyman
The Lyman industries that see more men than women are Agriculture, Fishing & Hunting (100.0%), Mining, Quarrying, & Extraction (100.0%), and Manufacturing (100.0%), whereas the industries that tend to have a higher number of women are Retail Trade (100.0%), Arts, Entertainment & Recreation (100.0%), and Accommodation & Food Services (100.0%).
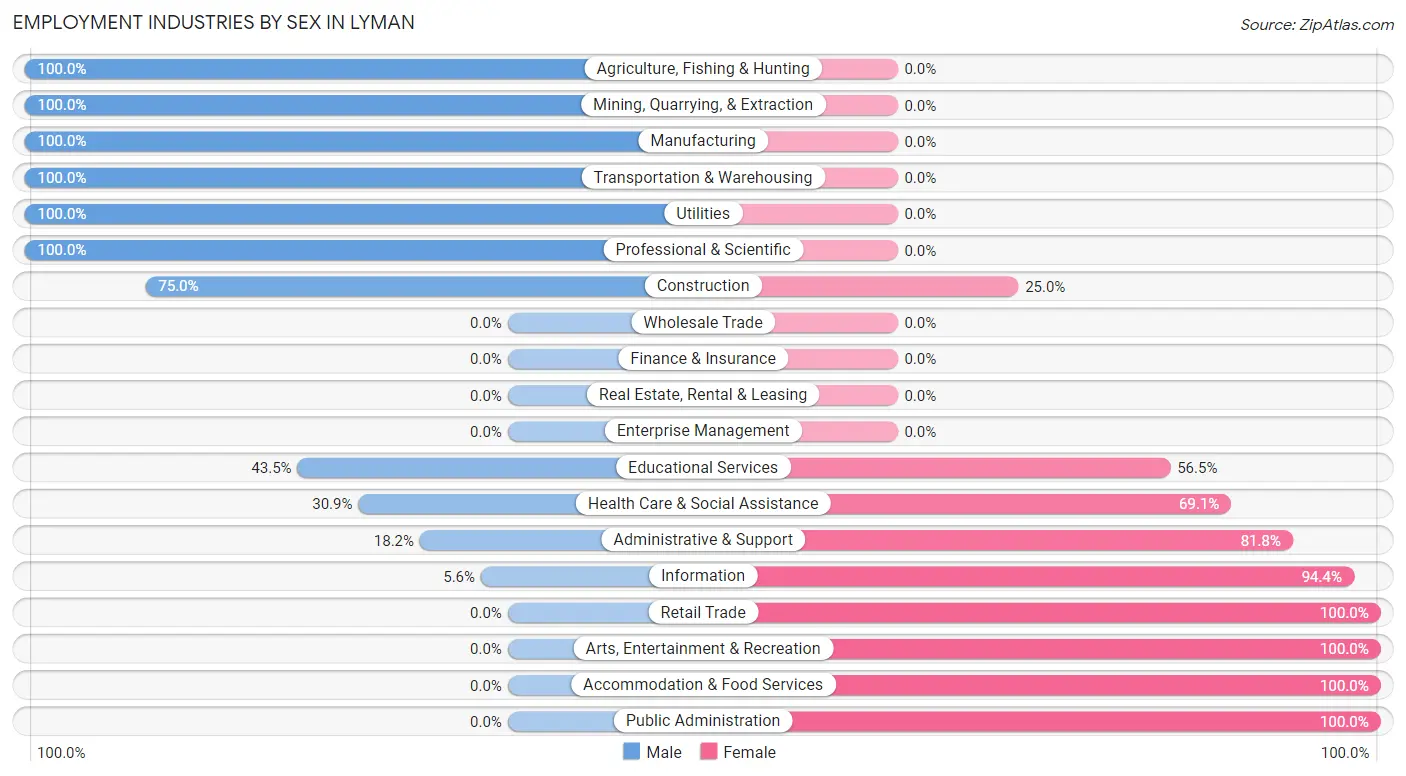
| Industry | Male | Female |
| Agriculture, Fishing & Hunting | 11 (100.0%) | 0 (0.0%) |
| Mining, Quarrying, & Extraction | 119 (100.0%) | 0 (0.0%) |
| Construction | 69 (75.0%) | 23 (25.0%) |
| Manufacturing | 44 (100.0%) | 0 (0.0%) |
| Wholesale Trade | 0 (0.0%) | 0 (0.0%) |
| Retail Trade | 0 (0.0%) | 28 (100.0%) |
| Transportation & Warehousing | 59 (100.0%) | 0 (0.0%) |
| Utilities | 22 (100.0%) | 0 (0.0%) |
| Information | 1 (5.6%) | 17 (94.4%) |
| Finance & Insurance | 0 (0.0%) | 0 (0.0%) |
| Real Estate, Rental & Leasing | 0 (0.0%) | 0 (0.0%) |
| Professional & Scientific | 22 (100.0%) | 0 (0.0%) |
| Enterprise Management | 0 (0.0%) | 0 (0.0%) |
| Administrative & Support | 2 (18.2%) | 9 (81.8%) |
| Educational Services | 37 (43.5%) | 48 (56.5%) |
| Health Care & Social Assistance | 30 (30.9%) | 67 (69.1%) |
| Arts, Entertainment & Recreation | 0 (0.0%) | 9 (100.0%) |
| Accommodation & Food Services | 0 (0.0%) | 7 (100.0%) |
| Public Administration | 0 (0.0%) | 13 (100.0%) |
| Total | 422 (64.1%) | 236 (35.9%) |
Education in Lyman
School Enrollment in Lyman
The most common levels of schooling among the 513 students in Lyman are high school (194 | 37.8%), elementary school (124 | 24.2%), and middle school (113 | 22.0%).
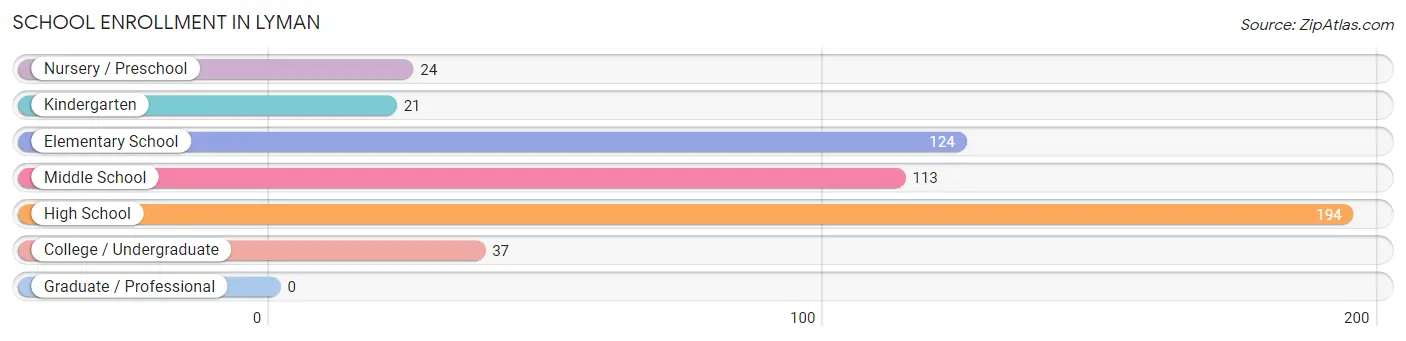
| School Level | # Students | % Students |
| Nursery / Preschool | 24 | 4.7% |
| Kindergarten | 21 | 4.1% |
| Elementary School | 124 | 24.2% |
| Middle School | 113 | 22.0% |
| High School | 194 | 37.8% |
| College / Undergraduate | 37 | 7.2% |
| Graduate / Professional | 0 | 0.0% |
| Total | 513 | 100.0% |
School Enrollment by Age by Funding Source in Lyman
Out of a total of 513 students who are enrolled in schools in Lyman, 103 (20.1%) attend a private institution, while the remaining 410 (79.9%) are enrolled in public schools. The age group of 3 to 4 year olds has the highest likelihood of being enrolled in private schools, with 7 (58.3% in the age bracket) enrolled. Conversely, the age group of 18 to 19 year olds has the lowest likelihood of being enrolled in a private school, with 21 (100.0% in the age bracket) attending a public institution.
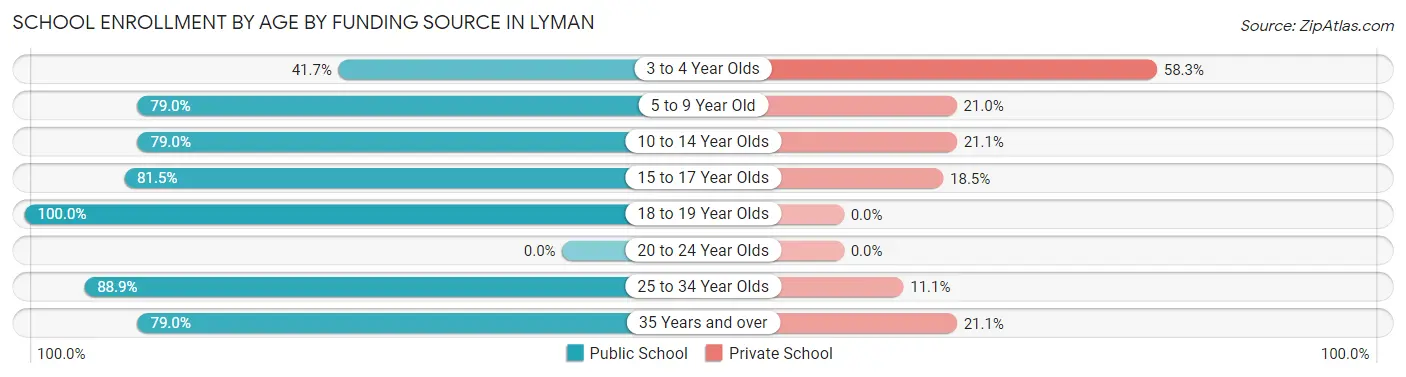
| Age Bracket | Public School | Private School |
| 3 to 4 Year Olds | 5 (41.7%) | 7 (58.3%) |
| 5 to 9 Year Old | 109 (79.0%) | 29 (21.0%) |
| 10 to 14 Year Olds | 120 (78.9%) | 32 (21.0%) |
| 15 to 17 Year Olds | 132 (81.5%) | 30 (18.5%) |
| 18 to 19 Year Olds | 21 (100.0%) | 0 (0.0%) |
| 20 to 24 Year Olds | 0 (0.0%) | 0 (0.0%) |
| 25 to 34 Year Olds | 8 (88.9%) | 1 (11.1%) |
| 35 Years and over | 15 (78.9%) | 4 (21.0%) |
| Total | 410 (79.9%) | 103 (20.1%) |
Educational Attainment by Field of Study in Lyman
Engineering (46 | 16.5%), science & technology (39 | 14.0%), bio, nature & agricultural (37 | 13.3%), education (37 | 13.3%), and business (22 | 7.9%) are the most common fields of study among 279 individuals in Lyman who have obtained a bachelor's degree or higher.
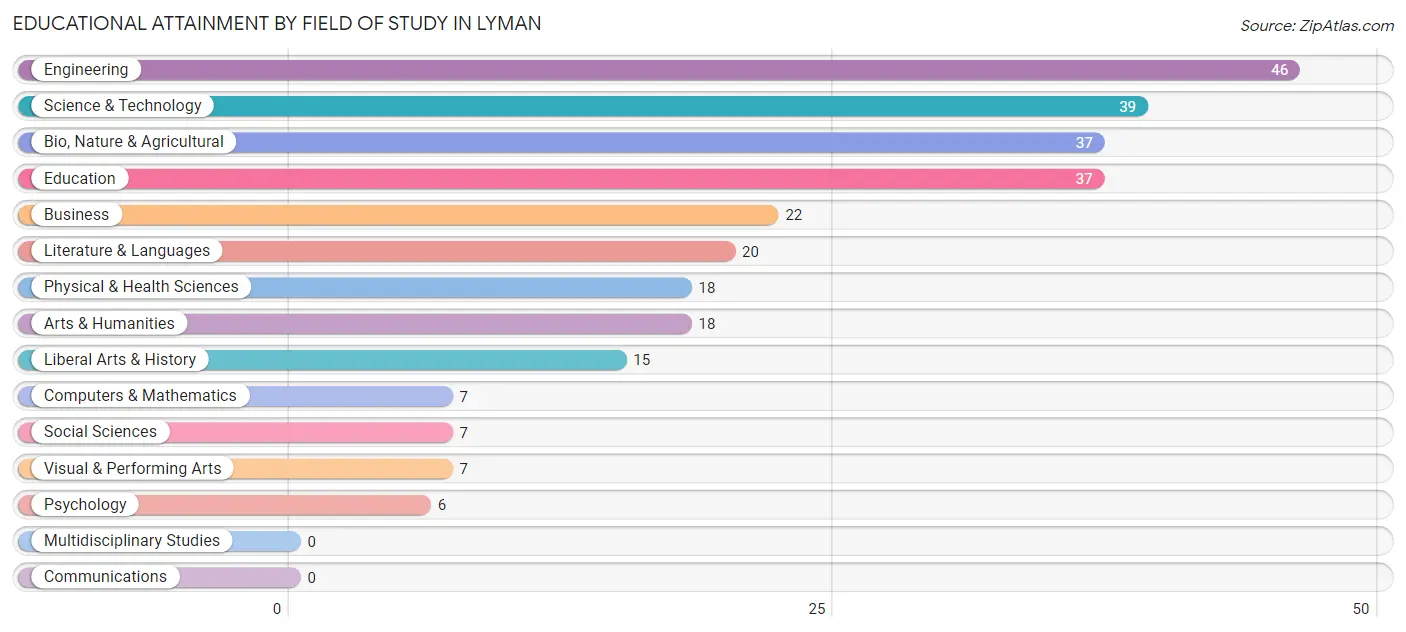
| Field of Study | # Graduates | % Graduates |
| Computers & Mathematics | 7 | 2.5% |
| Bio, Nature & Agricultural | 37 | 13.3% |
| Physical & Health Sciences | 18 | 6.5% |
| Psychology | 6 | 2.1% |
| Social Sciences | 7 | 2.5% |
| Engineering | 46 | 16.5% |
| Multidisciplinary Studies | 0 | 0.0% |
| Science & Technology | 39 | 14.0% |
| Business | 22 | 7.9% |
| Education | 37 | 13.3% |
| Literature & Languages | 20 | 7.2% |
| Liberal Arts & History | 15 | 5.4% |
| Visual & Performing Arts | 7 | 2.5% |
| Communications | 0 | 0.0% |
| Arts & Humanities | 18 | 6.5% |
| Total | 279 | 100.0% |
Transportation & Commute in Lyman
Vehicle Availability by Sex in Lyman
The most prevalent vehicle ownership categories in Lyman are males with 3 vehicles (185, accounting for 44.6%) and females with 3 vehicles (143, making up 80.4%).
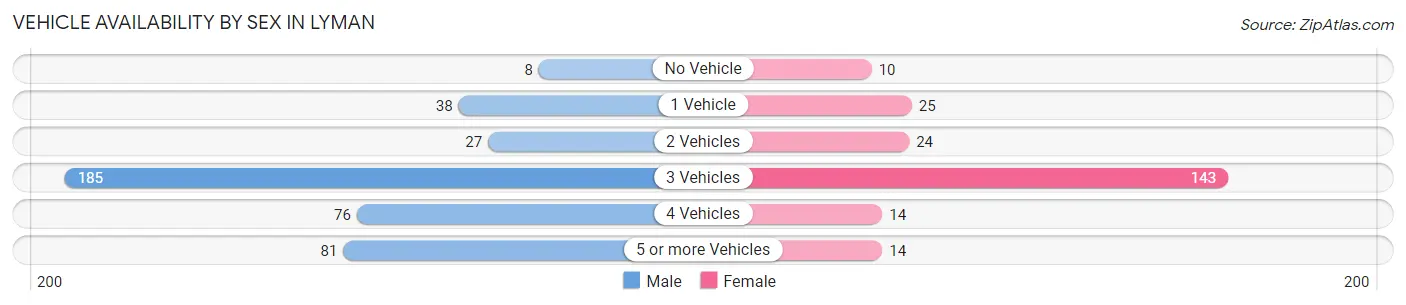
| Vehicles Available | Male | Female |
| No Vehicle | 8 (1.9%) | 10 (4.3%) |
| 1 Vehicle | 38 (9.2%) | 25 (10.9%) |
| 2 Vehicles | 27 (6.5%) | 24 (10.4%) |
| 3 Vehicles | 185 (44.6%) | 143 (62.2%) |
| 4 Vehicles | 76 (18.3%) | 14 (6.1%) |
| 5 or more Vehicles | 81 (19.5%) | 14 (6.1%) |
| Total | 415 (100.0%) | 230 (100.0%) |
Commute Time in Lyman
The most frequently occuring commute durations in Lyman are 10 to 14 minutes (109 commuters, 18.3%), 5 to 9 minutes (97 commuters, 16.3%), and 45 to 59 minutes (87 commuters, 14.6%).
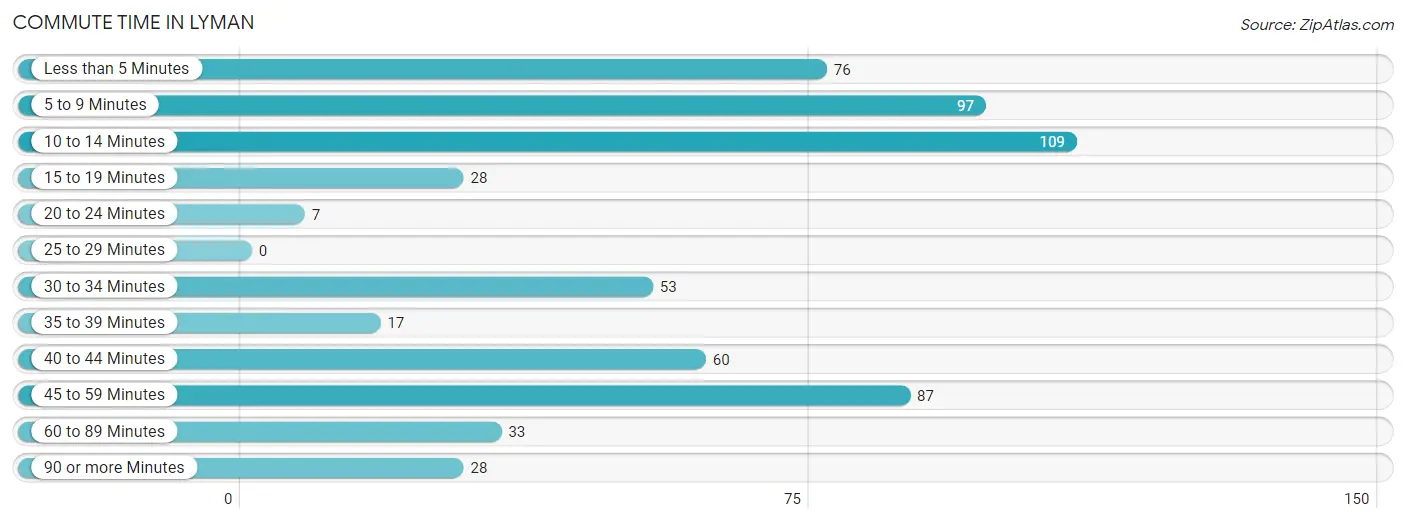
| Commute Time | # Commuters | % Commuters |
| Less than 5 Minutes | 76 | 12.8% |
| 5 to 9 Minutes | 97 | 16.3% |
| 10 to 14 Minutes | 109 | 18.3% |
| 15 to 19 Minutes | 28 | 4.7% |
| 20 to 24 Minutes | 7 | 1.2% |
| 25 to 29 Minutes | 0 | 0.0% |
| 30 to 34 Minutes | 53 | 8.9% |
| 35 to 39 Minutes | 17 | 2.9% |
| 40 to 44 Minutes | 60 | 10.1% |
| 45 to 59 Minutes | 87 | 14.6% |
| 60 to 89 Minutes | 33 | 5.6% |
| 90 or more Minutes | 28 | 4.7% |
Commute Time by Sex in Lyman
The most common commute times in Lyman are 10 to 14 minutes (81 commuters, 20.5%) for males and 5 to 9 minutes (56 commuters, 28.0%) for females.
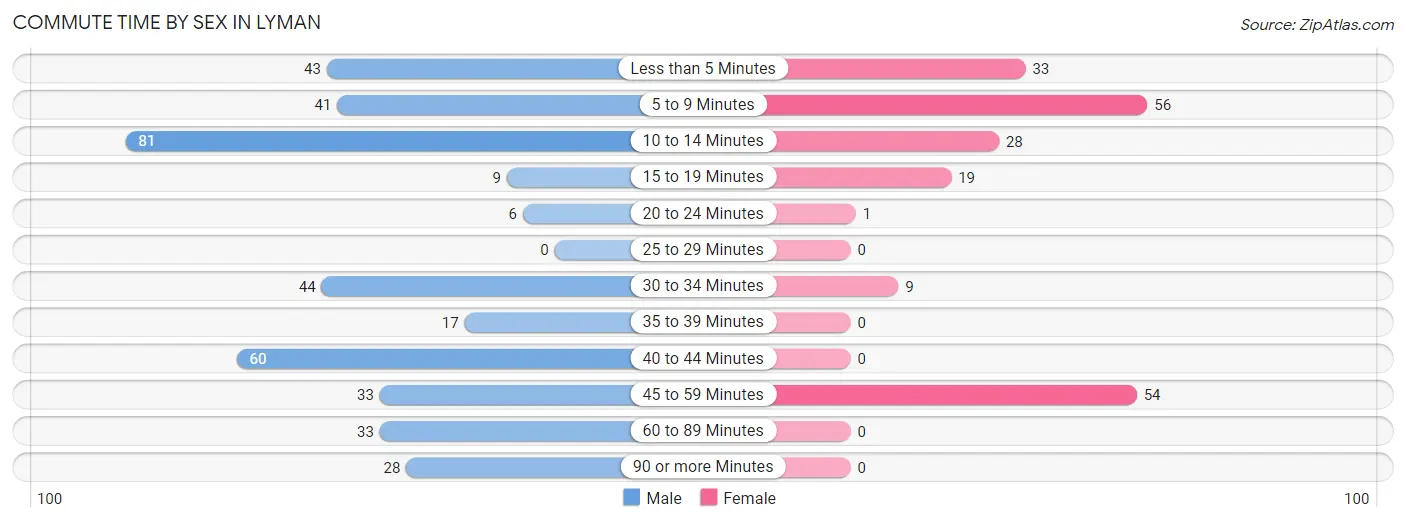
| Commute Time | Male | Female |
| Less than 5 Minutes | 43 (10.9%) | 33 (16.5%) |
| 5 to 9 Minutes | 41 (10.4%) | 56 (28.0%) |
| 10 to 14 Minutes | 81 (20.5%) | 28 (14.0%) |
| 15 to 19 Minutes | 9 (2.3%) | 19 (9.5%) |
| 20 to 24 Minutes | 6 (1.5%) | 1 (0.5%) |
| 25 to 29 Minutes | 0 (0.0%) | 0 (0.0%) |
| 30 to 34 Minutes | 44 (11.1%) | 9 (4.5%) |
| 35 to 39 Minutes | 17 (4.3%) | 0 (0.0%) |
| 40 to 44 Minutes | 60 (15.2%) | 0 (0.0%) |
| 45 to 59 Minutes | 33 (8.4%) | 54 (27.0%) |
| 60 to 89 Minutes | 33 (8.4%) | 0 (0.0%) |
| 90 or more Minutes | 28 (7.1%) | 0 (0.0%) |
Time of Departure to Work by Sex in Lyman
The most frequent times of departure to work in Lyman are 6:00 AM to 6:29 AM (86, 21.8%) for males and 7:00 AM to 7:29 AM (68, 34.0%) for females.
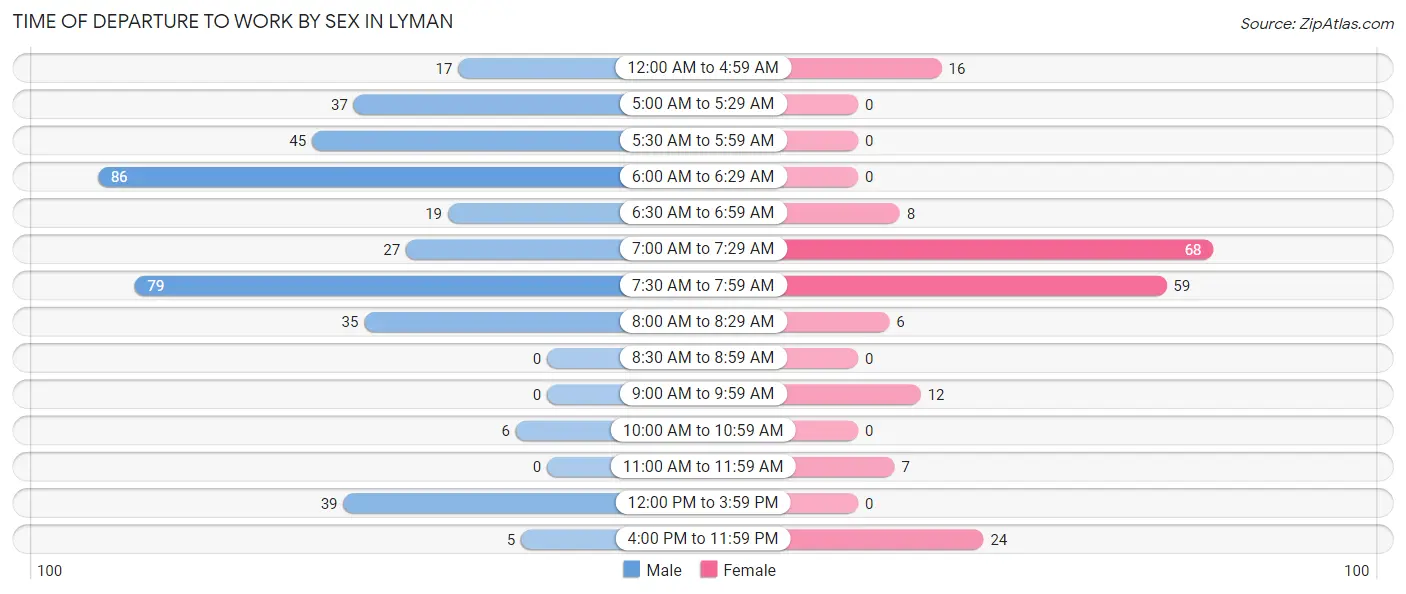
| Time of Departure | Male | Female |
| 12:00 AM to 4:59 AM | 17 (4.3%) | 16 (8.0%) |
| 5:00 AM to 5:29 AM | 37 (9.4%) | 0 (0.0%) |
| 5:30 AM to 5:59 AM | 45 (11.4%) | 0 (0.0%) |
| 6:00 AM to 6:29 AM | 86 (21.8%) | 0 (0.0%) |
| 6:30 AM to 6:59 AM | 19 (4.8%) | 8 (4.0%) |
| 7:00 AM to 7:29 AM | 27 (6.8%) | 68 (34.0%) |
| 7:30 AM to 7:59 AM | 79 (20.0%) | 59 (29.5%) |
| 8:00 AM to 8:29 AM | 35 (8.9%) | 6 (3.0%) |
| 8:30 AM to 8:59 AM | 0 (0.0%) | 0 (0.0%) |
| 9:00 AM to 9:59 AM | 0 (0.0%) | 12 (6.0%) |
| 10:00 AM to 10:59 AM | 6 (1.5%) | 0 (0.0%) |
| 11:00 AM to 11:59 AM | 0 (0.0%) | 7 (3.5%) |
| 12:00 PM to 3:59 PM | 39 (9.9%) | 0 (0.0%) |
| 4:00 PM to 11:59 PM | 5 (1.3%) | 24 (12.0%) |
| Total | 395 (100.0%) | 200 (100.0%) |
Housing Occupancy in Lyman
Occupancy by Ownership in Lyman
Of the total 593 dwellings in Lyman, owner-occupied units account for 490 (82.6%), while renter-occupied units make up 103 (17.4%).
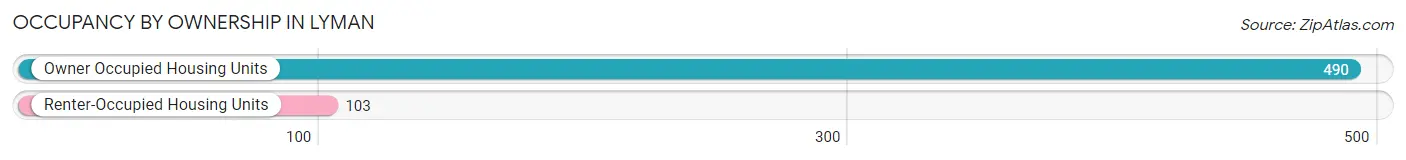
| Occupancy | # Housing Units | % Housing Units |
| Owner Occupied Housing Units | 490 | 82.6% |
| Renter-Occupied Housing Units | 103 | 17.4% |
| Total Occupied Housing Units | 593 | 100.0% |
Occupancy by Household Size in Lyman
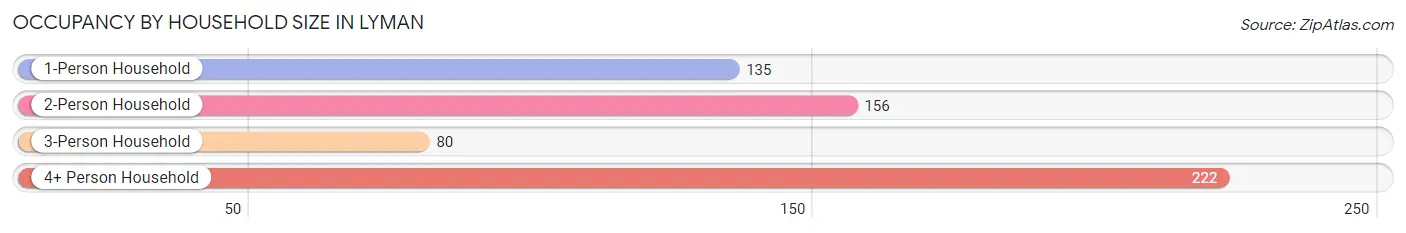
| Household Size | # Housing Units | % Housing Units |
| 1-Person Household | 135 | 22.8% |
| 2-Person Household | 156 | 26.3% |
| 3-Person Household | 80 | 13.5% |
| 4+ Person Household | 222 | 37.4% |
| Total Housing Units | 593 | 100.0% |
Occupancy by Ownership by Household Size in Lyman
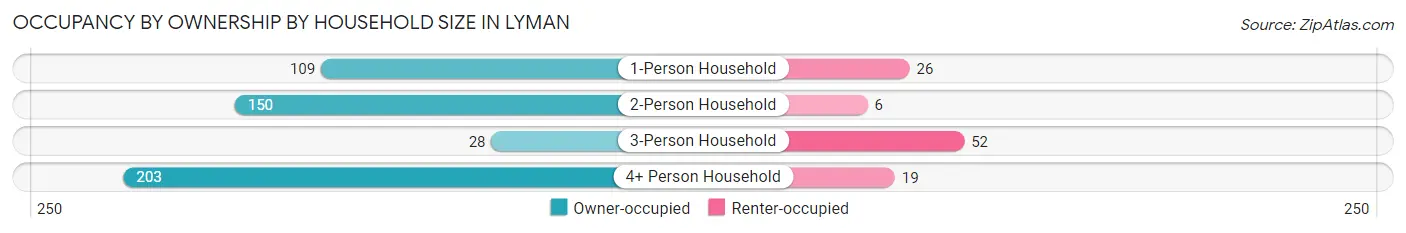
| Household Size | Owner-occupied | Renter-occupied |
| 1-Person Household | 109 (80.7%) | 26 (19.3%) |
| 2-Person Household | 150 (96.2%) | 6 (3.8%) |
| 3-Person Household | 28 (35.0%) | 52 (65.0%) |
| 4+ Person Household | 203 (91.4%) | 19 (8.6%) |
| Total Housing Units | 490 (82.6%) | 103 (17.4%) |
Occupancy by Educational Attainment in Lyman
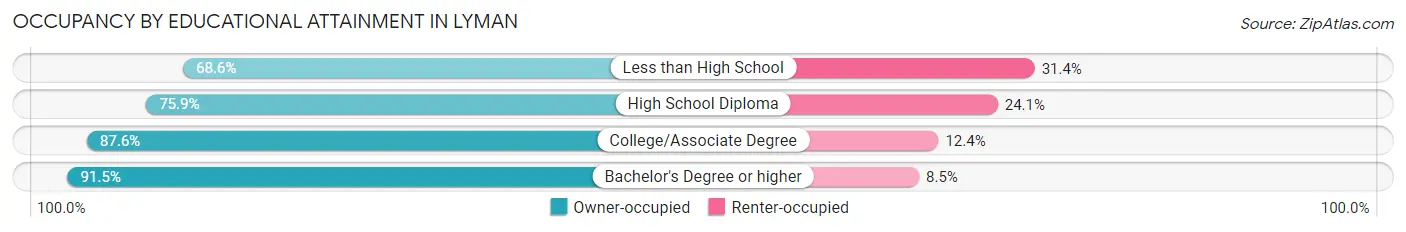
| Household Size | Owner-occupied | Renter-occupied |
| Less than High School | 48 (68.6%) | 22 (31.4%) |
| High School Diploma | 129 (75.9%) | 41 (24.1%) |
| College/Associate Degree | 227 (87.6%) | 32 (12.4%) |
| Bachelor's Degree or higher | 86 (91.5%) | 8 (8.5%) |
Occupancy by Age of Householder in Lyman
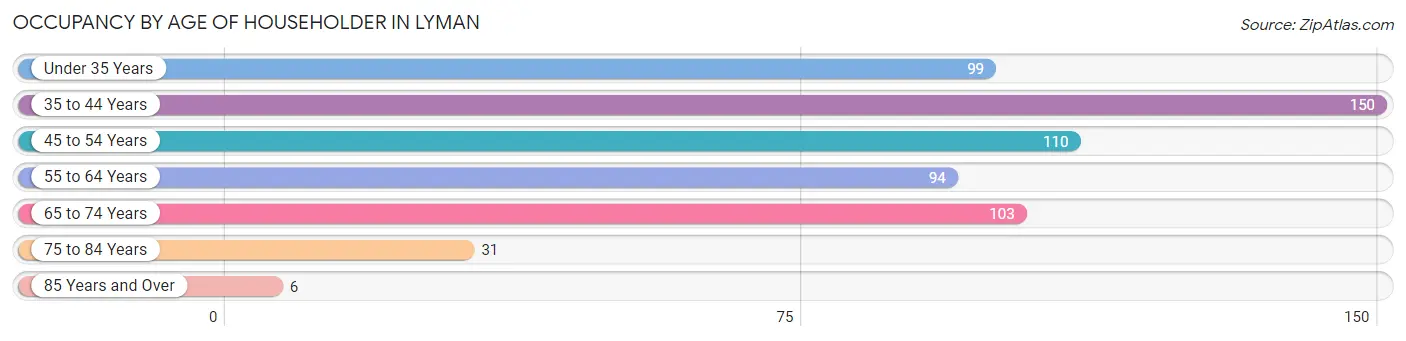
| Age Bracket | # Households | % Households |
| Under 35 Years | 99 | 16.7% |
| 35 to 44 Years | 150 | 25.3% |
| 45 to 54 Years | 110 | 18.5% |
| 55 to 64 Years | 94 | 15.9% |
| 65 to 74 Years | 103 | 17.4% |
| 75 to 84 Years | 31 | 5.2% |
| 85 Years and Over | 6 | 1.0% |
| Total | 593 | 100.0% |
Housing Finances in Lyman
Median Income by Occupancy in Lyman
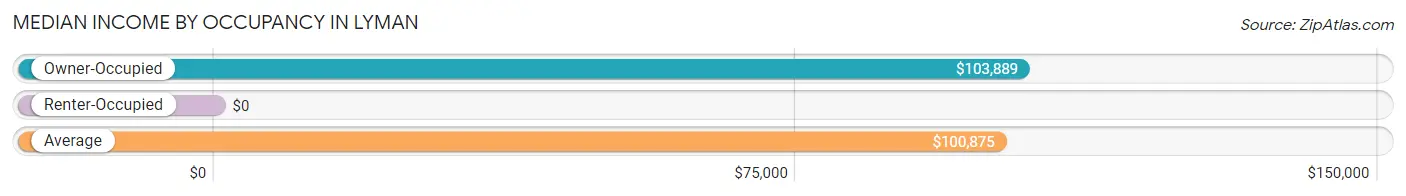
| Occupancy Type | # Households | Median Income |
| Owner-Occupied | 490 (82.6%) | $103,889 |
| Renter-Occupied | 103 (17.4%) | $0 |
| Average | 593 (100.0%) | $100,875 |
Occupancy by Householder Income Bracket in Lyman
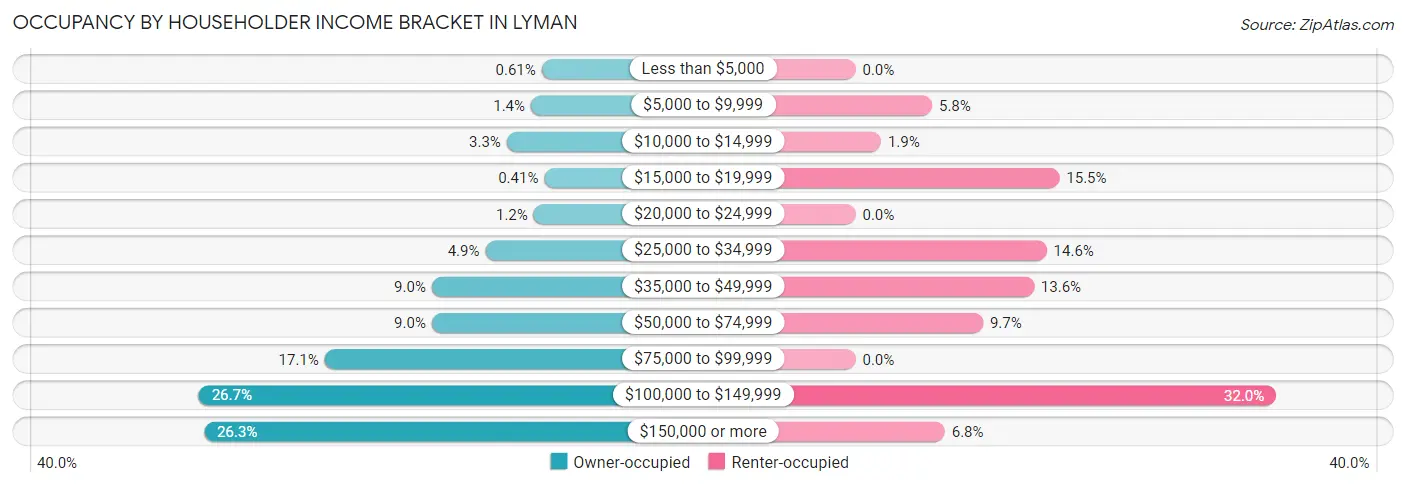
| Income Bracket | Owner-occupied | Renter-occupied |
| Less than $5,000 | 3 (0.6%) | 0 (0.0%) |
| $5,000 to $9,999 | 7 (1.4%) | 6 (5.8%) |
| $10,000 to $14,999 | 16 (3.3%) | 2 (1.9%) |
| $15,000 to $19,999 | 2 (0.4%) | 16 (15.5%) |
| $20,000 to $24,999 | 6 (1.2%) | 0 (0.0%) |
| $25,000 to $34,999 | 24 (4.9%) | 15 (14.6%) |
| $35,000 to $49,999 | 44 (9.0%) | 14 (13.6%) |
| $50,000 to $74,999 | 44 (9.0%) | 10 (9.7%) |
| $75,000 to $99,999 | 84 (17.1%) | 0 (0.0%) |
| $100,000 to $149,999 | 131 (26.7%) | 33 (32.0%) |
| $150,000 or more | 129 (26.3%) | 7 (6.8%) |
| Total | 490 (100.0%) | 103 (100.0%) |
Monthly Housing Cost Tiers in Lyman
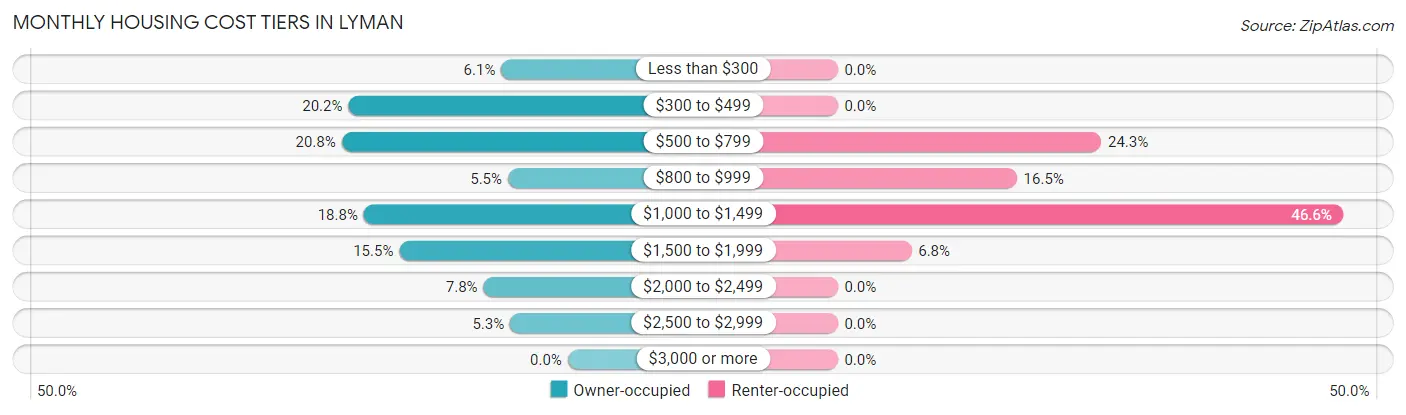
| Monthly Cost | Owner-occupied | Renter-occupied |
| Less than $300 | 30 (6.1%) | 0 (0.0%) |
| $300 to $499 | 99 (20.2%) | 0 (0.0%) |
| $500 to $799 | 102 (20.8%) | 25 (24.3%) |
| $800 to $999 | 27 (5.5%) | 17 (16.5%) |
| $1,000 to $1,499 | 92 (18.8%) | 48 (46.6%) |
| $1,500 to $1,999 | 76 (15.5%) | 7 (6.8%) |
| $2,000 to $2,499 | 38 (7.8%) | 0 (0.0%) |
| $2,500 to $2,999 | 26 (5.3%) | 0 (0.0%) |
| $3,000 or more | 0 (0.0%) | 0 (0.0%) |
| Total | 490 (100.0%) | 103 (100.0%) |
Physical Housing Characteristics in Lyman
Housing Structures in Lyman
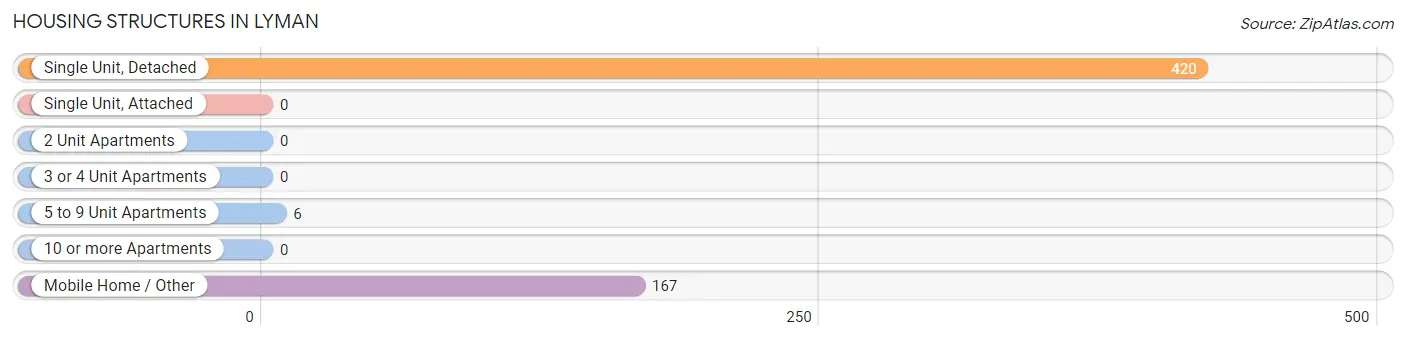
| Structure Type | # Housing Units | % Housing Units |
| Single Unit, Detached | 420 | 70.8% |
| Single Unit, Attached | 0 | 0.0% |
| 2 Unit Apartments | 0 | 0.0% |
| 3 or 4 Unit Apartments | 0 | 0.0% |
| 5 to 9 Unit Apartments | 6 | 1.0% |
| 10 or more Apartments | 0 | 0.0% |
| Mobile Home / Other | 167 | 28.2% |
| Total | 593 | 100.0% |
Housing Structures by Occupancy in Lyman
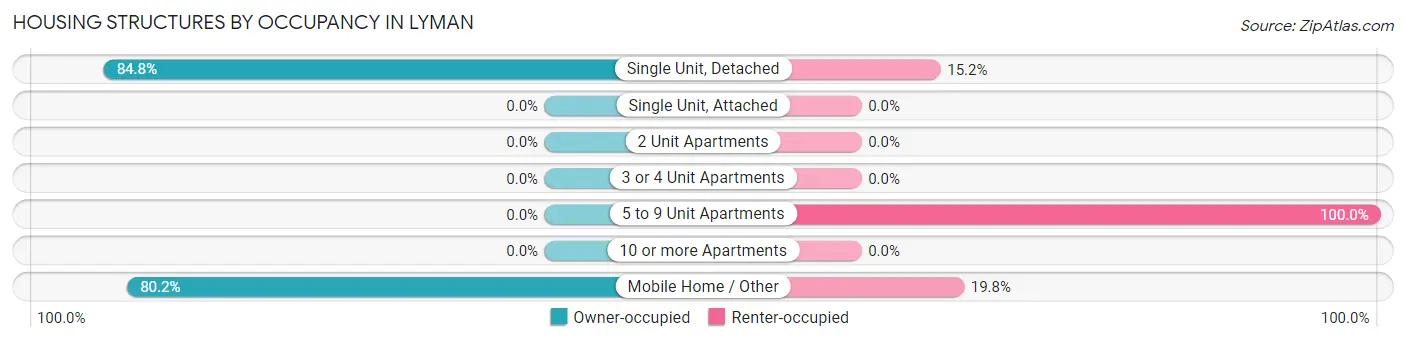
| Structure Type | Owner-occupied | Renter-occupied |
| Single Unit, Detached | 356 (84.8%) | 64 (15.2%) |
| Single Unit, Attached | 0 (0.0%) | 0 (0.0%) |
| 2 Unit Apartments | 0 (0.0%) | 0 (0.0%) |
| 3 or 4 Unit Apartments | 0 (0.0%) | 0 (0.0%) |
| 5 to 9 Unit Apartments | 0 (0.0%) | 6 (100.0%) |
| 10 or more Apartments | 0 (0.0%) | 0 (0.0%) |
| Mobile Home / Other | 134 (80.2%) | 33 (19.8%) |
| Total | 490 (82.6%) | 103 (17.4%) |
Housing Structures by Number of Rooms in Lyman
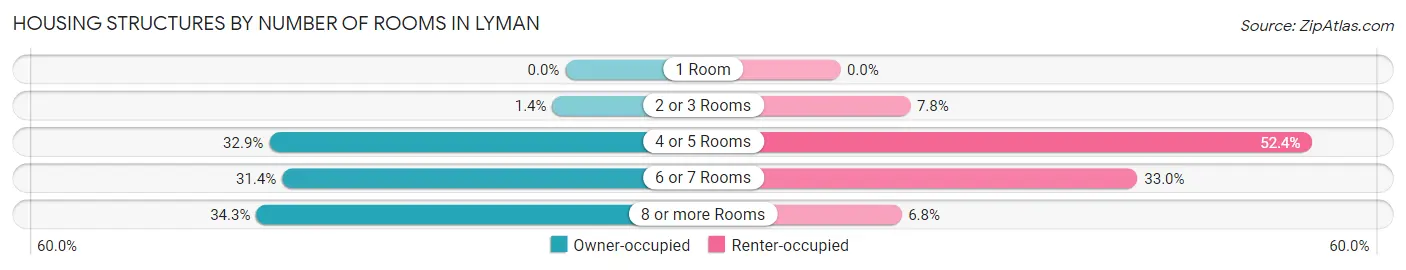
| Number of Rooms | Owner-occupied | Renter-occupied |
| 1 Room | 0 (0.0%) | 0 (0.0%) |
| 2 or 3 Rooms | 7 (1.4%) | 8 (7.8%) |
| 4 or 5 Rooms | 161 (32.9%) | 54 (52.4%) |
| 6 or 7 Rooms | 154 (31.4%) | 34 (33.0%) |
| 8 or more Rooms | 168 (34.3%) | 7 (6.8%) |
| Total | 490 (100.0%) | 103 (100.0%) |
Housing Structure by Heating Type in Lyman
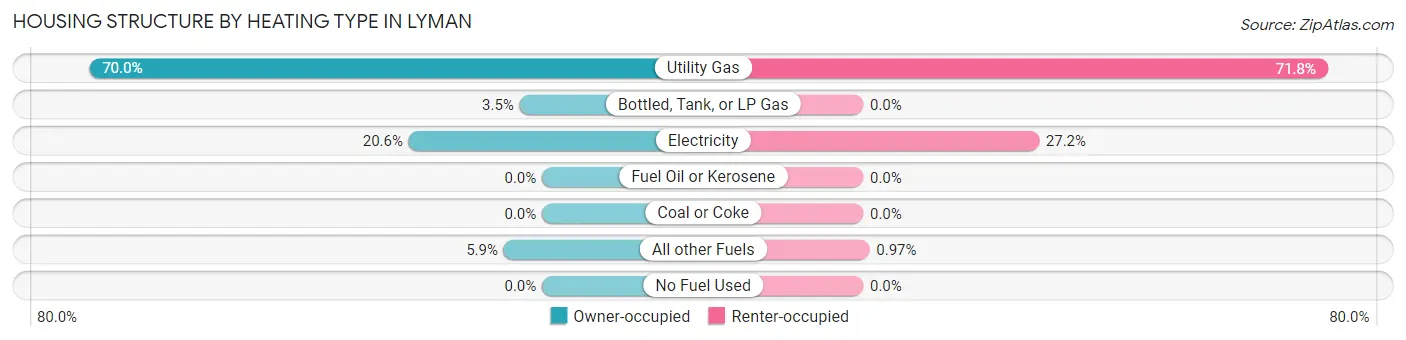
| Heating Type | Owner-occupied | Renter-occupied |
| Utility Gas | 343 (70.0%) | 74 (71.8%) |
| Bottled, Tank, or LP Gas | 17 (3.5%) | 0 (0.0%) |
| Electricity | 101 (20.6%) | 28 (27.2%) |
| Fuel Oil or Kerosene | 0 (0.0%) | 0 (0.0%) |
| Coal or Coke | 0 (0.0%) | 0 (0.0%) |
| All other Fuels | 29 (5.9%) | 1 (1.0%) |
| No Fuel Used | 0 (0.0%) | 0 (0.0%) |
| Total | 490 (100.0%) | 103 (100.0%) |
Household Vehicle Usage in Lyman
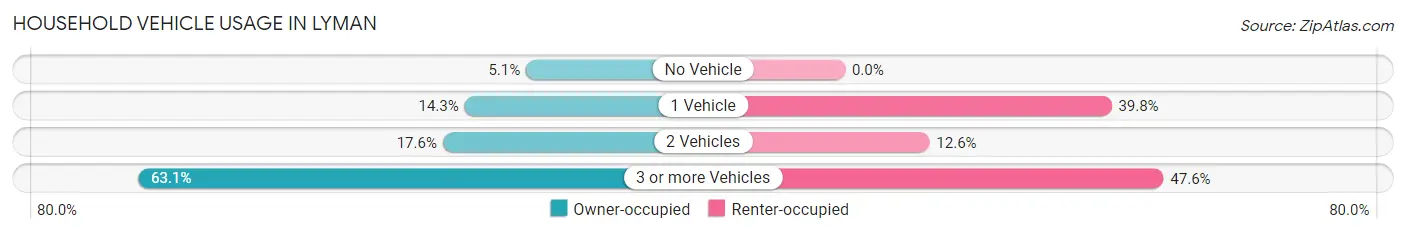
| Vehicles per Household | Owner-occupied | Renter-occupied |
| No Vehicle | 25 (5.1%) | 0 (0.0%) |
| 1 Vehicle | 70 (14.3%) | 41 (39.8%) |
| 2 Vehicles | 86 (17.5%) | 13 (12.6%) |
| 3 or more Vehicles | 309 (63.1%) | 49 (47.6%) |
| Total | 490 (100.0%) | 103 (100.0%) |
Real Estate & Mortgages in Lyman
Real Estate and Mortgage Overview in Lyman
| Characteristic | Without Mortgage | With Mortgage |
| Housing Units | 221 | 269 |
| Median Property Value | $206,300 | $282,800 |
| Median Household Income | $89,479 | $92 |
| Monthly Housing Costs | $379 | $0 |
| Real Estate Taxes | $1,066 | $0 |
Property Value by Mortgage Status in Lyman
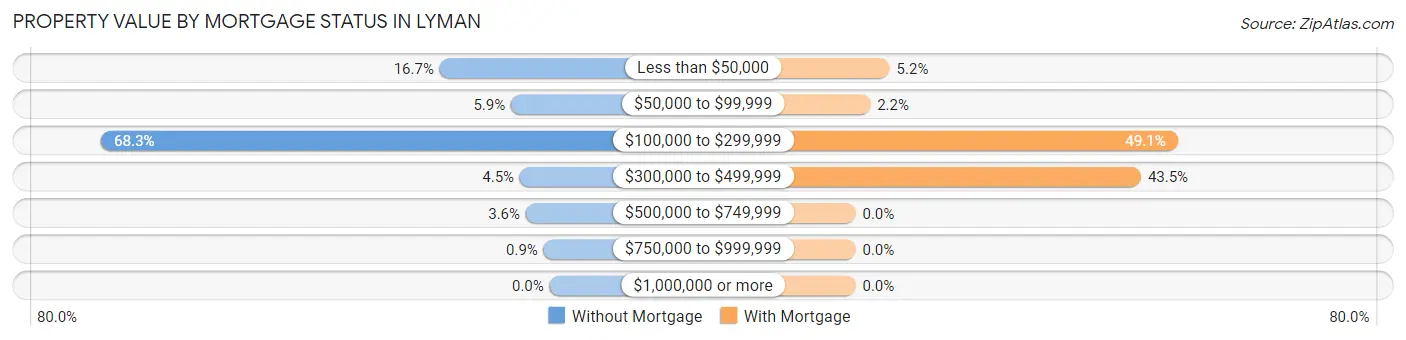
| Property Value | Without Mortgage | With Mortgage |
| Less than $50,000 | 37 (16.7%) | 14 (5.2%) |
| $50,000 to $99,999 | 13 (5.9%) | 6 (2.2%) |
| $100,000 to $299,999 | 151 (68.3%) | 132 (49.1%) |
| $300,000 to $499,999 | 10 (4.5%) | 117 (43.5%) |
| $500,000 to $749,999 | 8 (3.6%) | 0 (0.0%) |
| $750,000 to $999,999 | 2 (0.9%) | 0 (0.0%) |
| $1,000,000 or more | 0 (0.0%) | 0 (0.0%) |
| Total | 221 (100.0%) | 269 (100.0%) |
Household Income by Mortgage Status in Lyman
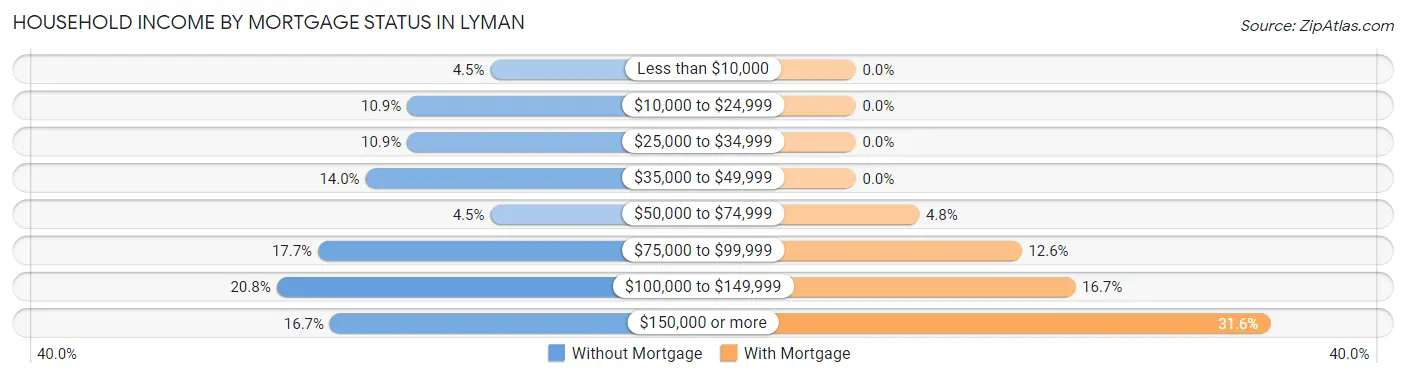
| Household Income | Without Mortgage | With Mortgage |
| Less than $10,000 | 10 (4.5%) | 0 (0.0%) |
| $10,000 to $24,999 | 24 (10.9%) | 0 (0.0%) |
| $25,000 to $34,999 | 24 (10.9%) | 0 (0.0%) |
| $35,000 to $49,999 | 31 (14.0%) | 0 (0.0%) |
| $50,000 to $74,999 | 10 (4.5%) | 13 (4.8%) |
| $75,000 to $99,999 | 39 (17.6%) | 34 (12.6%) |
| $100,000 to $149,999 | 46 (20.8%) | 45 (16.7%) |
| $150,000 or more | 37 (16.7%) | 85 (31.6%) |
| Total | 221 (100.0%) | 269 (100.0%) |
Property Value to Household Income Ratio in Lyman
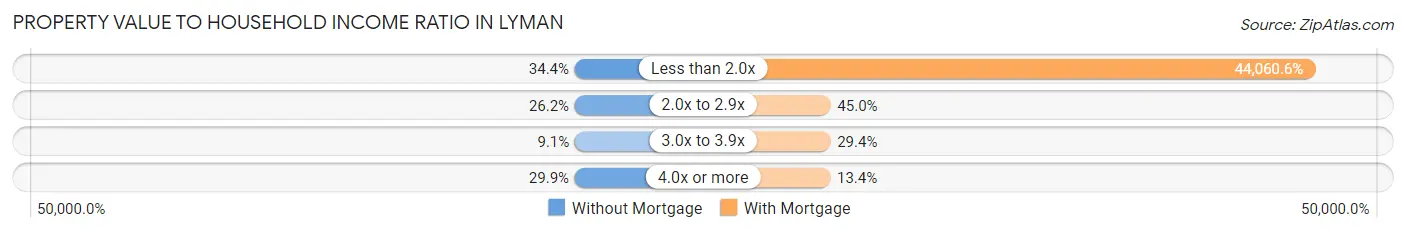
| Value-to-Income Ratio | Without Mortgage | With Mortgage |
| Less than 2.0x | 76 (34.4%) | 118,523 (44,060.6%) |
| 2.0x to 2.9x | 58 (26.2%) | 121 (45.0%) |
| 3.0x to 3.9x | 20 (9.0%) | 79 (29.4%) |
| 4.0x or more | 66 (29.9%) | 36 (13.4%) |
| Total | 221 (100.0%) | 269 (100.0%) |
Real Estate Taxes by Mortgage Status in Lyman
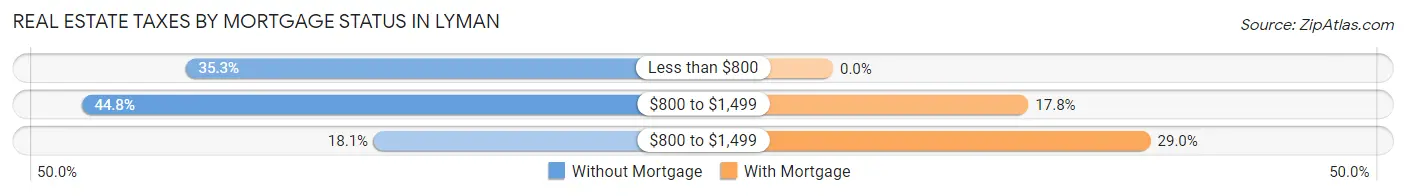
| Property Taxes | Without Mortgage | With Mortgage |
| Less than $800 | 78 (35.3%) | 0 (0.0%) |
| $800 to $1,499 | 99 (44.8%) | 48 (17.8%) |
| $800 to $1,499 | 40 (18.1%) | 78 (29.0%) |
| Total | 221 (100.0%) | 269 (100.0%) |
Health & Disability in Lyman
Health Insurance Coverage by Age in Lyman
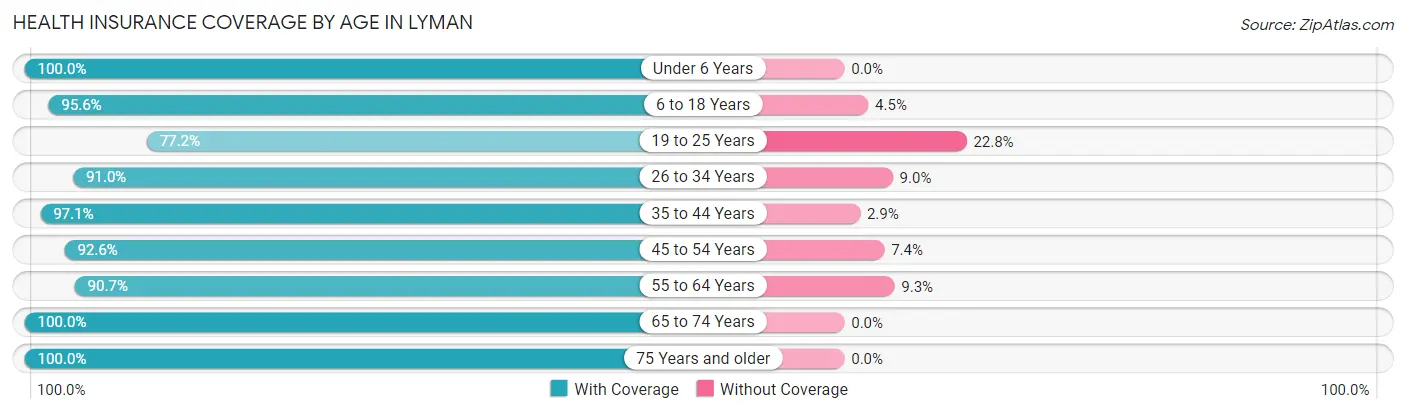
| Age Bracket | With Coverage | Without Coverage |
| Under 6 Years | 122 (100.0%) | 0 (0.0%) |
| 6 to 18 Years | 472 (95.6%) | 22 (4.4%) |
| 19 to 25 Years | 61 (77.2%) | 18 (22.8%) |
| 26 to 34 Years | 121 (91.0%) | 12 (9.0%) |
| 35 to 44 Years | 299 (97.1%) | 9 (2.9%) |
| 45 to 54 Years | 224 (92.6%) | 18 (7.4%) |
| 55 to 64 Years | 136 (90.7%) | 14 (9.3%) |
| 65 to 74 Years | 164 (100.0%) | 0 (0.0%) |
| 75 Years and older | 44 (100.0%) | 0 (0.0%) |
| Total | 1,643 (94.6%) | 93 (5.4%) |
Health Insurance Coverage by Citizenship Status in Lyman
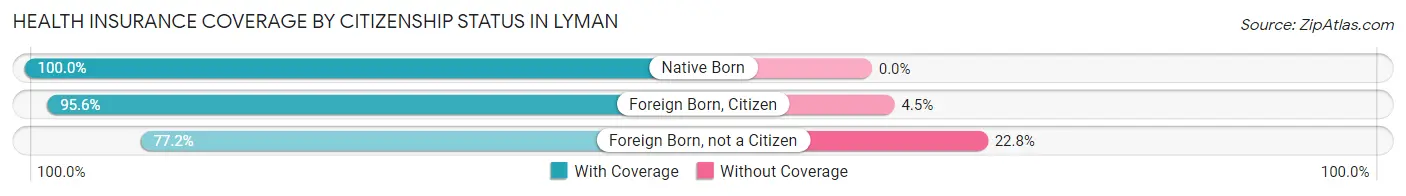
| Citizenship Status | With Coverage | Without Coverage |
| Native Born | 122 (100.0%) | 0 (0.0%) |
| Foreign Born, Citizen | 472 (95.6%) | 22 (4.4%) |
| Foreign Born, not a Citizen | 61 (77.2%) | 18 (22.8%) |
Health Insurance Coverage by Household Income in Lyman
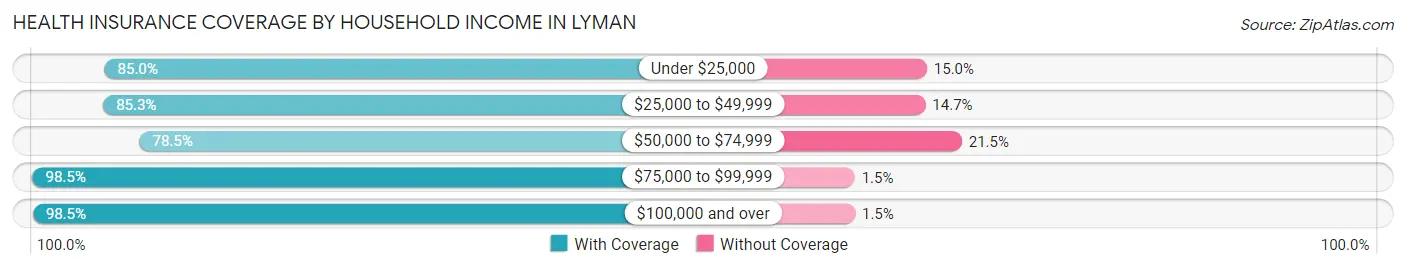
| Household Income | With Coverage | Without Coverage |
| Under $25,000 | 68 (85.0%) | 12 (15.0%) |
| $25,000 to $49,999 | 191 (85.3%) | 33 (14.7%) |
| $50,000 to $74,999 | 102 (78.5%) | 28 (21.5%) |
| $75,000 to $99,999 | 198 (98.5%) | 3 (1.5%) |
| $100,000 and over | 1,084 (98.5%) | 17 (1.5%) |
Public vs Private Health Insurance Coverage by Age in Lyman
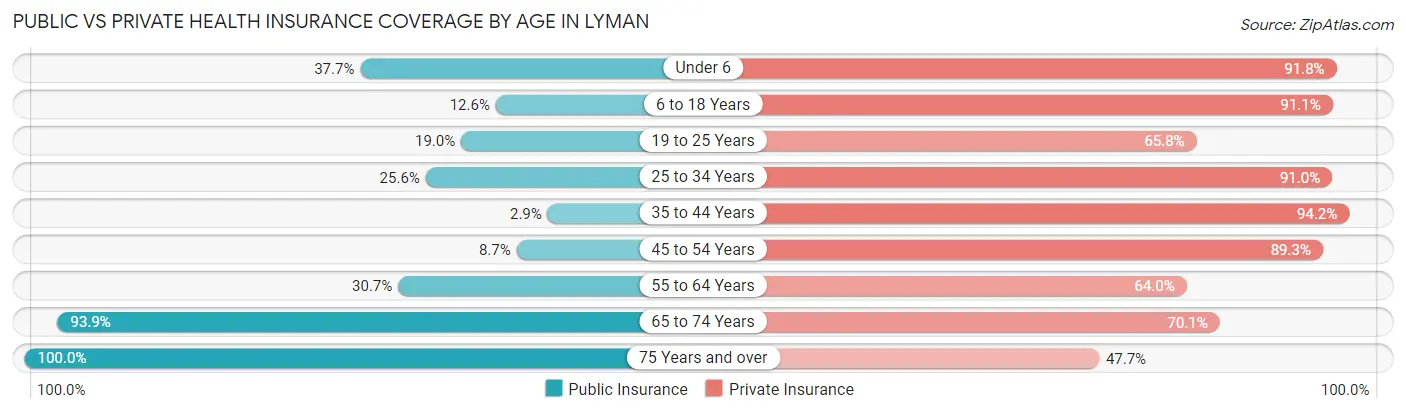
| Age Bracket | Public Insurance | Private Insurance |
| Under 6 | 46 (37.7%) | 112 (91.8%) |
| 6 to 18 Years | 62 (12.6%) | 450 (91.1%) |
| 19 to 25 Years | 15 (19.0%) | 52 (65.8%) |
| 25 to 34 Years | 34 (25.6%) | 121 (91.0%) |
| 35 to 44 Years | 9 (2.9%) | 290 (94.2%) |
| 45 to 54 Years | 21 (8.7%) | 216 (89.3%) |
| 55 to 64 Years | 46 (30.7%) | 96 (64.0%) |
| 65 to 74 Years | 154 (93.9%) | 115 (70.1%) |
| 75 Years and over | 44 (100.0%) | 21 (47.7%) |
| Total | 431 (24.8%) | 1,473 (84.9%) |
Disability Status by Sex by Age in Lyman
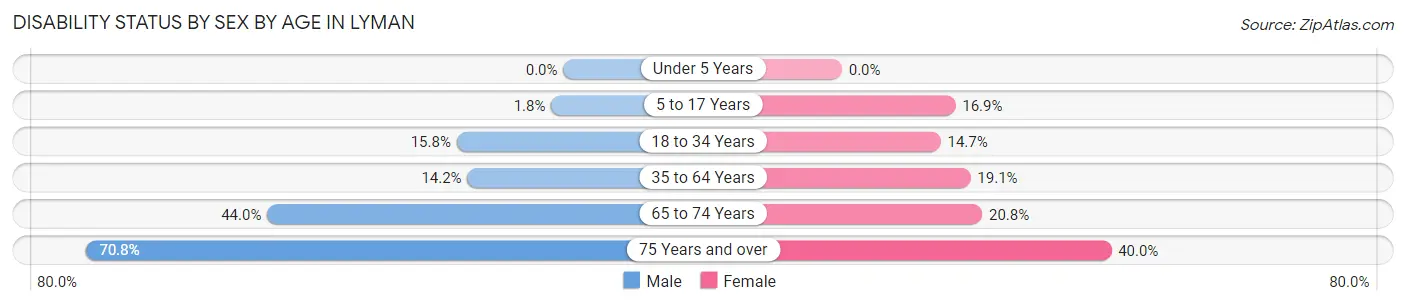
| Age Bracket | Male | Female |
| Under 5 Years | 0 (0.0%) | 0 (0.0%) |
| 5 to 17 Years | 4 (1.8%) | 45 (16.9%) |
| 18 to 34 Years | 19 (15.8%) | 17 (14.7%) |
| 35 to 64 Years | 49 (14.2%) | 68 (19.1%) |
| 65 to 74 Years | 51 (44.0%) | 10 (20.8%) |
| 75 Years and over | 17 (70.8%) | 8 (40.0%) |
Disability Class by Sex by Age in Lyman
Disability Class: Hearing Difficulty
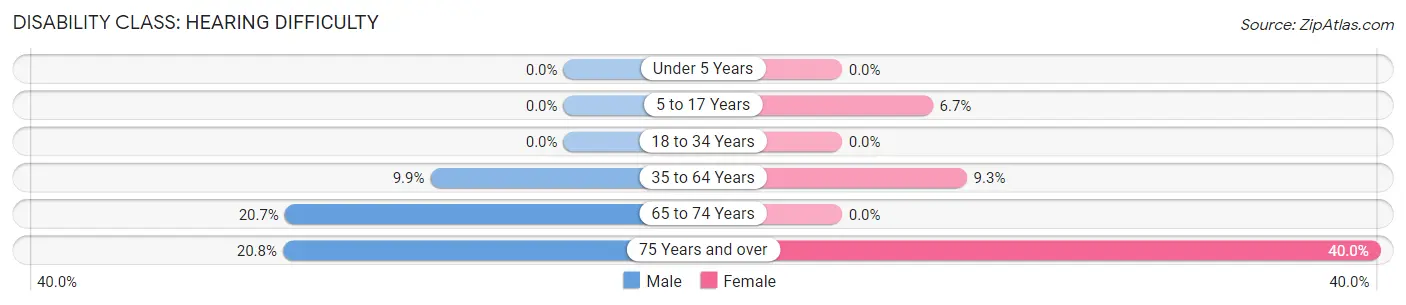
| Age Bracket | Male | Female |
| Under 5 Years | 0 (0.0%) | 0 (0.0%) |
| 5 to 17 Years | 0 (0.0%) | 18 (6.7%) |
| 18 to 34 Years | 0 (0.0%) | 0 (0.0%) |
| 35 to 64 Years | 34 (9.9%) | 33 (9.3%) |
| 65 to 74 Years | 24 (20.7%) | 0 (0.0%) |
| 75 Years and over | 5 (20.8%) | 8 (40.0%) |
Disability Class: Vision Difficulty
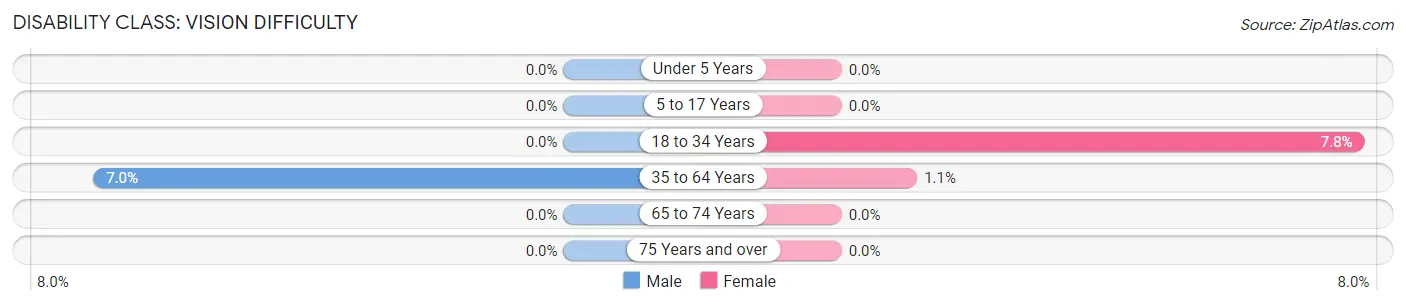
| Age Bracket | Male | Female |
| Under 5 Years | 0 (0.0%) | 0 (0.0%) |
| 5 to 17 Years | 0 (0.0%) | 0 (0.0%) |
| 18 to 34 Years | 0 (0.0%) | 9 (7.8%) |
| 35 to 64 Years | 24 (7.0%) | 4 (1.1%) |
| 65 to 74 Years | 0 (0.0%) | 0 (0.0%) |
| 75 Years and over | 0 (0.0%) | 0 (0.0%) |
Disability Class: Cognitive Difficulty
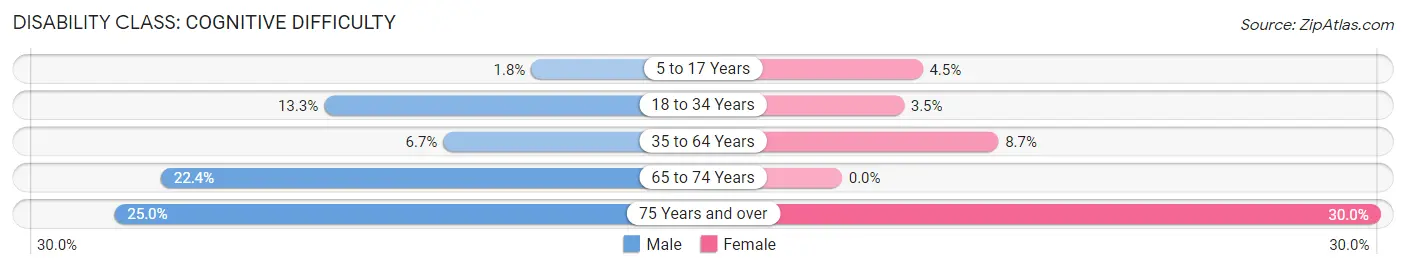
| Age Bracket | Male | Female |
| 5 to 17 Years | 4 (1.8%) | 12 (4.5%) |
| 18 to 34 Years | 16 (13.3%) | 4 (3.5%) |
| 35 to 64 Years | 23 (6.7%) | 31 (8.7%) |
| 65 to 74 Years | 26 (22.4%) | 0 (0.0%) |
| 75 Years and over | 6 (25.0%) | 6 (30.0%) |
Disability Class: Ambulatory Difficulty
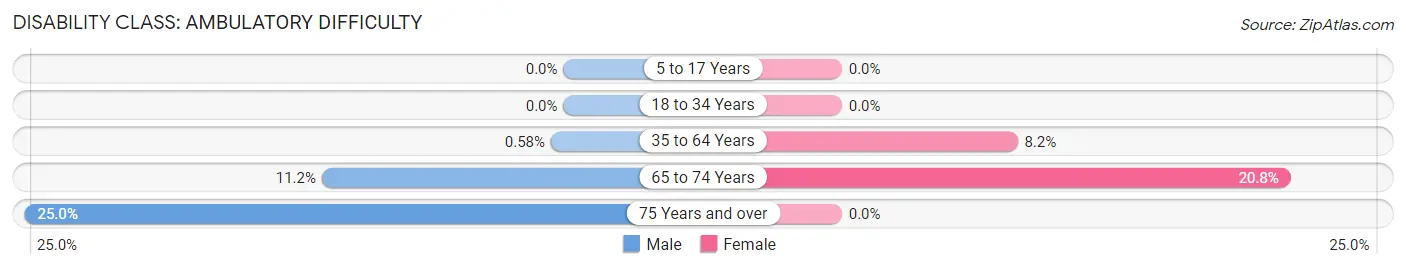
| Age Bracket | Male | Female |
| 5 to 17 Years | 0 (0.0%) | 0 (0.0%) |
| 18 to 34 Years | 0 (0.0%) | 0 (0.0%) |
| 35 to 64 Years | 2 (0.6%) | 29 (8.2%) |
| 65 to 74 Years | 13 (11.2%) | 10 (20.8%) |
| 75 Years and over | 6 (25.0%) | 0 (0.0%) |
Disability Class: Self-Care Difficulty
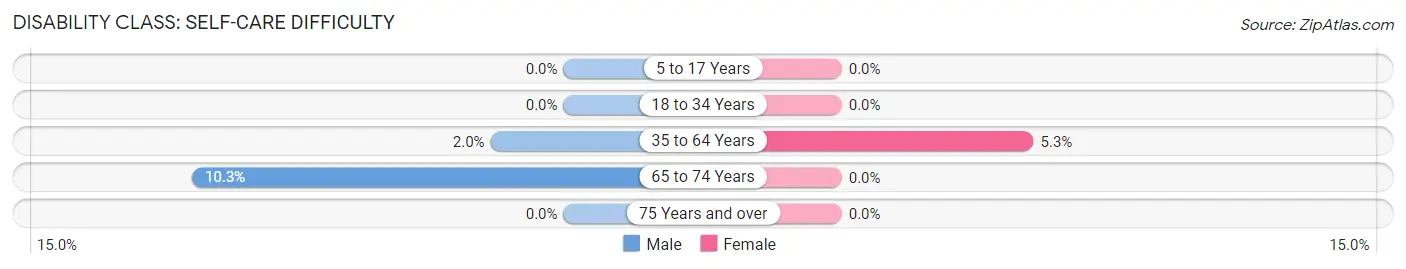
| Age Bracket | Male | Female |
| 5 to 17 Years | 0 (0.0%) | 0 (0.0%) |
| 18 to 34 Years | 0 (0.0%) | 0 (0.0%) |
| 35 to 64 Years | 7 (2.0%) | 19 (5.3%) |
| 65 to 74 Years | 12 (10.3%) | 0 (0.0%) |
| 75 Years and over | 0 (0.0%) | 0 (0.0%) |
Technology Access in Lyman
Computing Device Access in Lyman
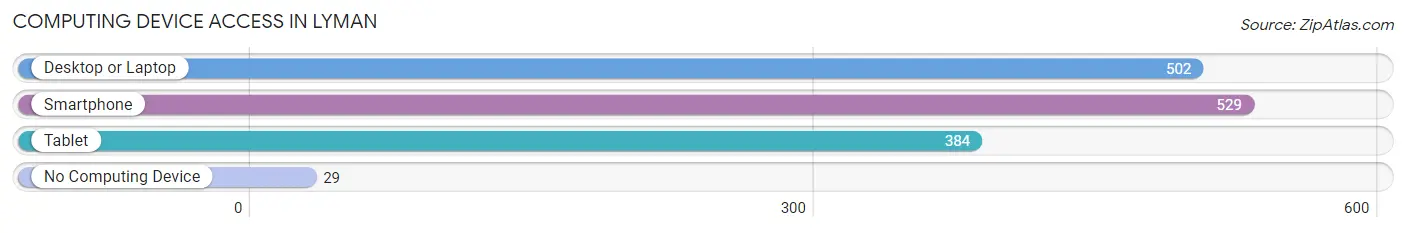
| Device Type | # Households | % Households |
| Desktop or Laptop | 502 | 84.7% |
| Smartphone | 529 | 89.2% |
| Tablet | 384 | 64.8% |
| No Computing Device | 29 | 4.9% |
| Total | 593 | 100.0% |
Internet Access in Lyman
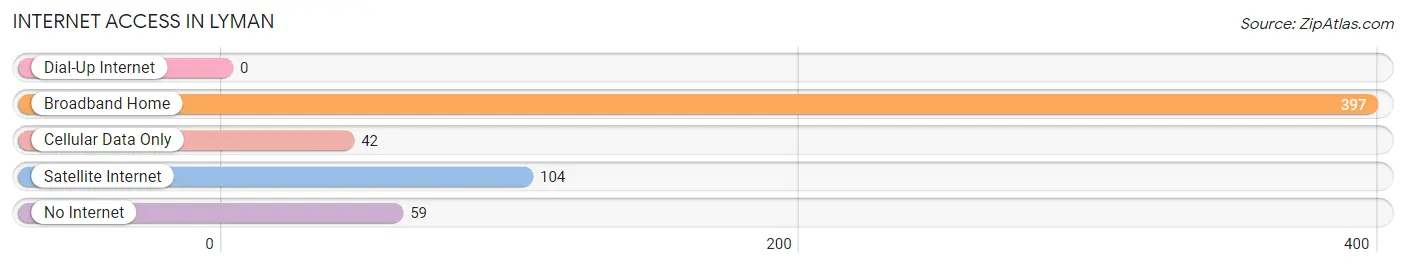
| Internet Type | # Households | % Households |
| Dial-Up Internet | 0 | 0.0% |
| Broadband Home | 397 | 66.9% |
| Cellular Data Only | 42 | 7.1% |
| Satellite Internet | 104 | 17.5% |
| No Internet | 59 | 10.0% |
| Total | 593 | 100.0% |
Lyman Summary
Lyman, Wyoming is a small town located in Uinta County, Wyoming. It is situated in the southwestern part of the state, near the Utah border. The town was founded in 1887 and has a population of approximately 1,000 people.
History
Lyman was founded in 1887 by a group of Mormon settlers from Utah. The town was named after William Lyman, a prominent Mormon leader. The settlers were attracted to the area due to its abundant natural resources, including timber, coal, and water. The town quickly grew and by the early 1900s, it had become a thriving community.
In the early 1900s, Lyman was a major hub for the coal mining industry. The town was home to several coal mines, which provided employment for many of the town’s residents. The coal industry declined in the mid-1900s, but the town continued to thrive due to its agricultural and ranching industries.
Geography
Lyman is located in southwestern Wyoming, near the Utah border. The town is situated in the foothills of the Uinta Mountains, which provide a beautiful backdrop for the town. The town is located at an elevation of 6,000 feet, and the surrounding area is mostly flat. The town is located near several rivers, including the Green River and the Bear River.
Economy
The economy of Lyman is largely based on agriculture and ranching. The town is home to several farms and ranches, which provide employment for many of the town’s residents. The town is also home to several small businesses, including restaurants, stores, and other services.
Demographics
As of the 2010 census, the population of Lyman was 1,000. The town is predominantly white, with a small Hispanic population. The median household income in the town is $41,000, and the median age is 37. The town has a low unemployment rate, and the majority of the town’s residents are employed in the agricultural and ranching industries.
Lyman is a small town with a rich history and a vibrant economy. The town is home to a diverse population and is a great place to live and work. The town is surrounded by beautiful scenery and is a great place to visit and explore.
Common Questions
What is Per Capita Income in Lyman?
Per Capita income in Lyman is $36,294.
What is the Median Family Income in Lyman?
Median Family Income in Lyman is $120,500.
What is the Median Household income in Lyman?
Median Household Income in Lyman is $100,875.
What is Income or Wage Gap in Lyman?
Income or Wage Gap in Lyman is 82.8%.
Women in Lyman earn 17.2 cents for every dollar earned by a man.
What is Inequality or Gini Index in Lyman?
Inequality or Gini Index in Lyman is 0.35.
What is the Total Population of Lyman?
Total Population of Lyman is 1,736.
What is the Total Male Population of Lyman?
Total Male Population of Lyman is 889.
What is the Total Female Population of Lyman?
Total Female Population of Lyman is 847.
What is the Ratio of Males per 100 Females in Lyman?
There are 104.96 Males per 100 Females in Lyman.
What is the Ratio of Females per 100 Males in Lyman?
There are 95.28 Females per 100 Males in Lyman.
What is the Median Population Age in Lyman?
Median Population Age in Lyman is 35.8 Years.
What is the Average Family Size in Lyman
Average Family Size in Lyman is 3.4 People.
What is the Average Household Size in Lyman
Average Household Size in Lyman is 2.9 People.
How Large is the Labor Force in Lyman?
There are 687 People in the Labor Forcein in Lyman.
What is the Percentage of People in the Labor Force in Lyman?
56.8% of People are in the Labor Force in Lyman.
What is the Unemployment Rate in Lyman?
Unemployment Rate in Lyman is 4.2%.