Centennial, WY Map & Demographics
Centennial Map
Centennial Overview
$51,760
PER CAPITA INCOME
$133,906
AVG FAMILY INCOME
$97,589
AVG HOUSEHOLD INCOME
69.5%
WAGE / INCOME GAP [ % ]
30.5¢/ $1
WAGE / INCOME GAP [ $ ]
0.31
INEQUALITY / GINI INDEX
345
TOTAL POPULATION
170
MALE POPULATION
175
FEMALE POPULATION
97.14
MALES / 100 FEMALES
102.94
FEMALES / 100 MALES
63.9
MEDIAN AGE
2.1
AVG FAMILY SIZE
1.8
AVG HOUSEHOLD SIZE
98
LABOR FORCE [ PEOPLE ]
28.4%
PERCENT IN LABOR FORCE
Centennial Zip Codes
Centennial Area Codes
Income in Centennial
Income Overview in Centennial
Per Capita Income in Centennial is $51,760, while median incomes of families and households are $133,906 and $97,589 respectively.
| Characteristic | Number | Measure |
| Per Capita Income | 345 | $51,760 |
| Median Family Income | 98 | $133,906 |
| Mean Family Income | 98 | $130,256 |
| Median Household Income | 188 | $97,589 |
| Mean Household Income | 188 | $97,709 |
| Income Deficit | 98 | $0 |
| Wage / Income Gap (%) | 345 | 69.45% |
| Wage / Income Gap ($) | 345 | 30.55¢ per $1 |
| Gini / Inequality Index | 345 | 0.31 |
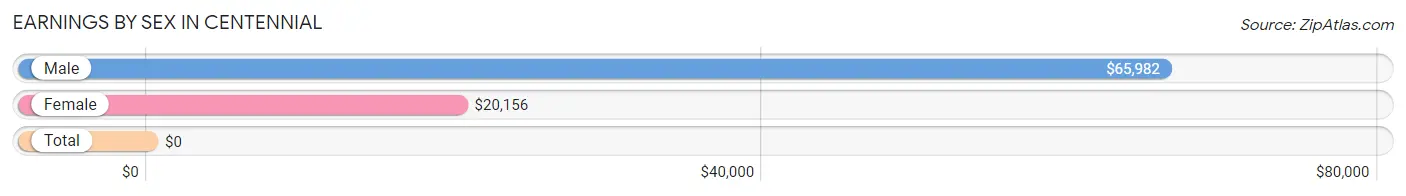
Earnings by Sex in Centennial
| Sex | Number | Average Earnings |
| Male | 65 (55.6%) | $65,982 |
| Female | 52 (44.4%) | $20,156 |
| Total | 117 (100.0%) | $0 |
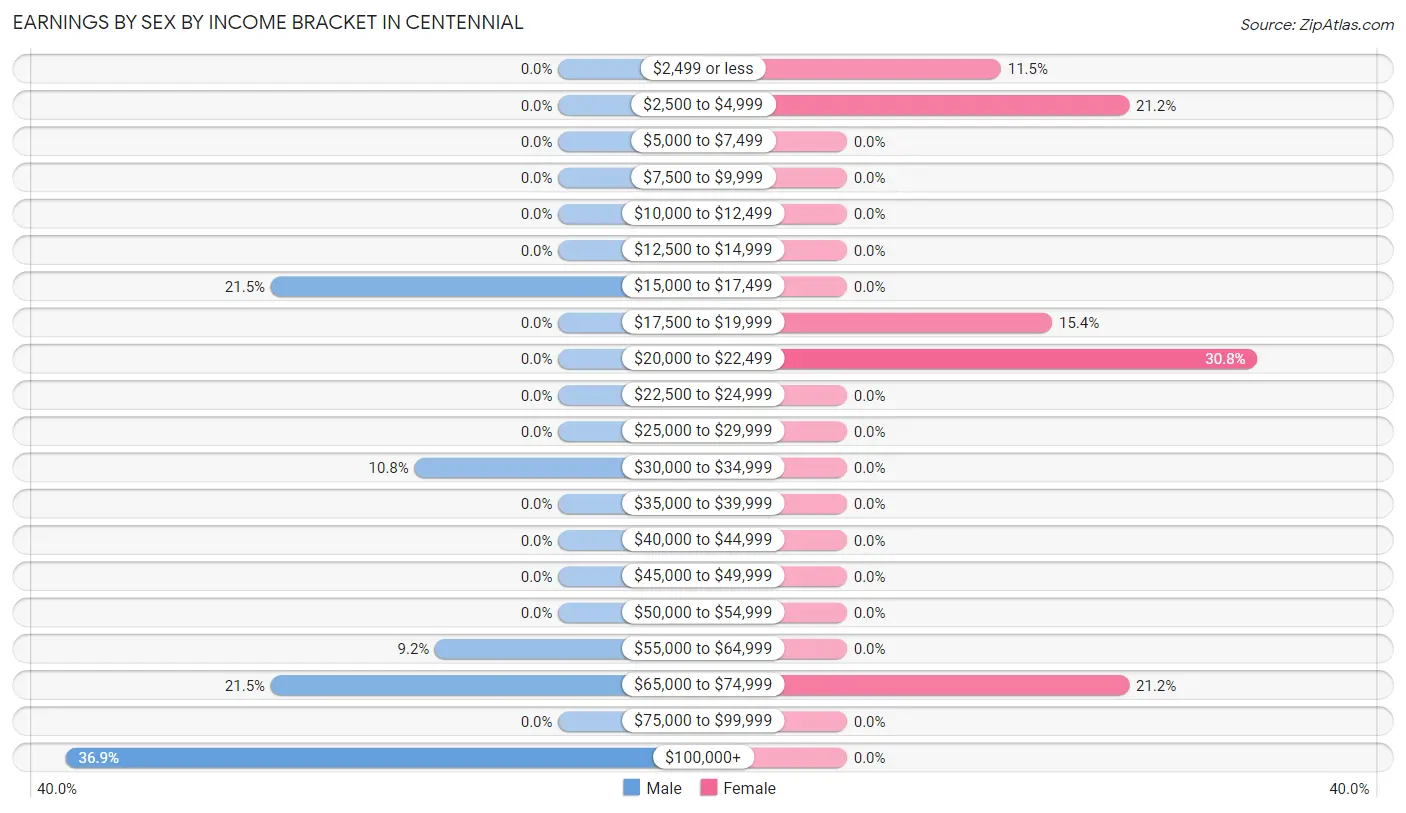
Earnings by Sex by Income Bracket in Centennial
The most common earnings brackets in Centennial are $100,000+ for men (24 | 36.9%) and $20,000 to $22,499 for women (16 | 30.8%).
| Income | Male | Female |
| $2,499 or less | 0 (0.0%) | 6 (11.5%) |
| $2,500 to $4,999 | 0 (0.0%) | 11 (21.1%) |
| $5,000 to $7,499 | 0 (0.0%) | 0 (0.0%) |
| $7,500 to $9,999 | 0 (0.0%) | 0 (0.0%) |
| $10,000 to $12,499 | 0 (0.0%) | 0 (0.0%) |
| $12,500 to $14,999 | 0 (0.0%) | 0 (0.0%) |
| $15,000 to $17,499 | 14 (21.5%) | 0 (0.0%) |
| $17,500 to $19,999 | 0 (0.0%) | 8 (15.4%) |
| $20,000 to $22,499 | 0 (0.0%) | 16 (30.8%) |
| $22,500 to $24,999 | 0 (0.0%) | 0 (0.0%) |
| $25,000 to $29,999 | 0 (0.0%) | 0 (0.0%) |
| $30,000 to $34,999 | 7 (10.8%) | 0 (0.0%) |
| $35,000 to $39,999 | 0 (0.0%) | 0 (0.0%) |
| $40,000 to $44,999 | 0 (0.0%) | 0 (0.0%) |
| $45,000 to $49,999 | 0 (0.0%) | 0 (0.0%) |
| $50,000 to $54,999 | 0 (0.0%) | 0 (0.0%) |
| $55,000 to $64,999 | 6 (9.2%) | 0 (0.0%) |
| $65,000 to $74,999 | 14 (21.5%) | 11 (21.1%) |
| $75,000 to $99,999 | 0 (0.0%) | 0 (0.0%) |
| $100,000+ | 24 (36.9%) | 0 (0.0%) |
| Total | 65 (100.0%) | 52 (100.0%) |
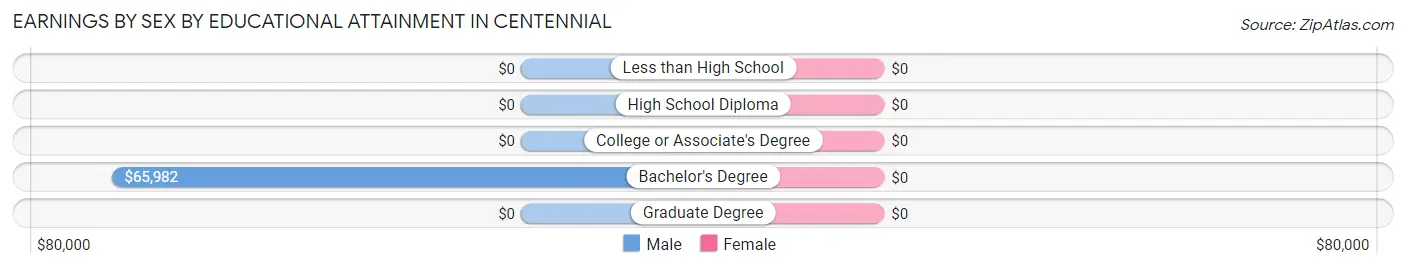
Earnings by Sex by Educational Attainment in Centennial
| Educational Attainment | Male Income | Female Income |
| Less than High School | - | - |
| High School Diploma | - | - |
| College or Associate's Degree | - | - |
| Bachelor's Degree | $65,982 | $0 |
| Graduate Degree | - | - |
| Total | $65,982 | $20,156 |
Family Income in Centennial
Family Income Brackets in Centennial
According to the Centennial family income data, there are 40 families falling into the $100,000 to $149,999 income range, which is the most common income bracket and makes up 40.8% of all families.
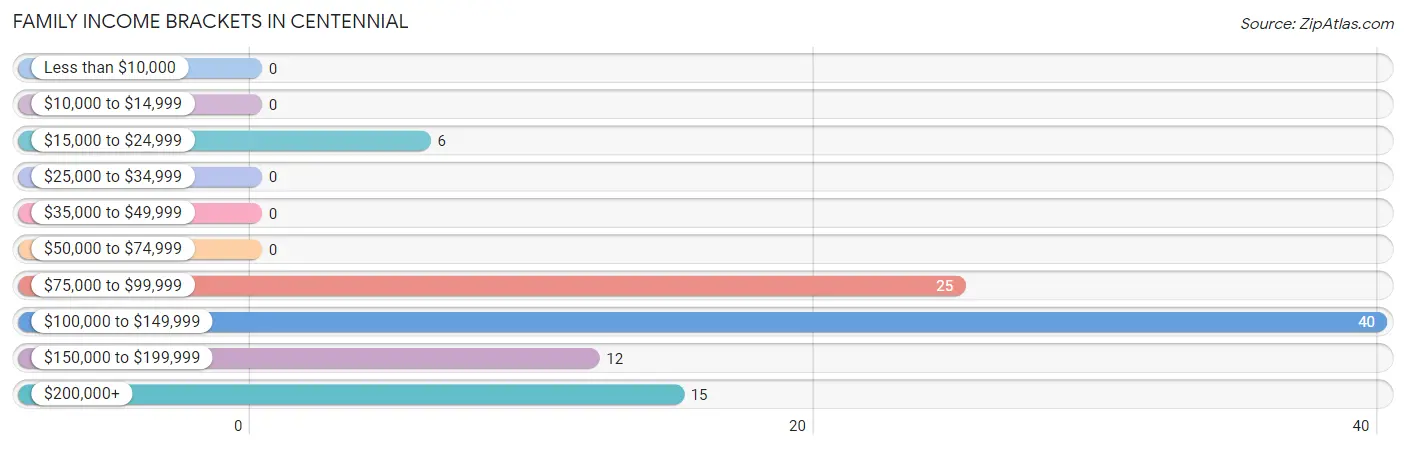
| Income Bracket | # Families | % Families |
| Less than $10,000 | 0 | 0.0% |
| $10,000 to $14,999 | 0 | 0.0% |
| $15,000 to $24,999 | 6 | 6.1% |
| $25,000 to $34,999 | 0 | 0.0% |
| $35,000 to $49,999 | 0 | 0.0% |
| $50,000 to $74,999 | 0 | 0.0% |
| $75,000 to $99,999 | 25 | 25.5% |
| $100,000 to $149,999 | 40 | 40.8% |
| $150,000 to $199,999 | 12 | 12.2% |
| $200,000+ | 15 | 15.3% |
Family Income by Famaliy Size in Centennial
2-person families (84 | 85.7%) account for the highest median family income in Centennial with $133,359 per family, while 2-person families (84 | 85.7%) have the highest median income of $66,680 per family member.
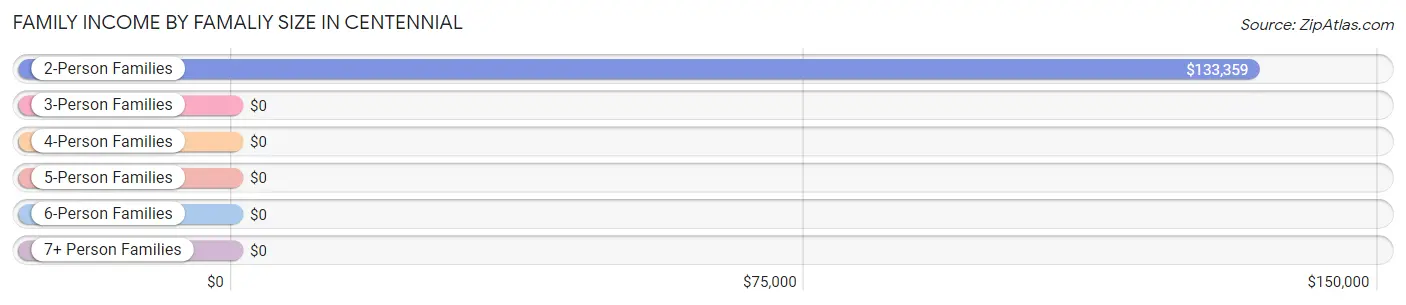
| Income Bracket | # Families | Median Income |
| 2-Person Families | 84 (85.7%) | $133,359 |
| 3-Person Families | 8 (8.2%) | $0 |
| 4-Person Families | 0 (0.0%) | $0 |
| 5-Person Families | 6 (6.1%) | $0 |
| 6-Person Families | 0 (0.0%) | $0 |
| 7+ Person Families | 0 (0.0%) | $0 |
| Total | 98 (100.0%) | $133,906 |
Family Income by Number of Earners in Centennial
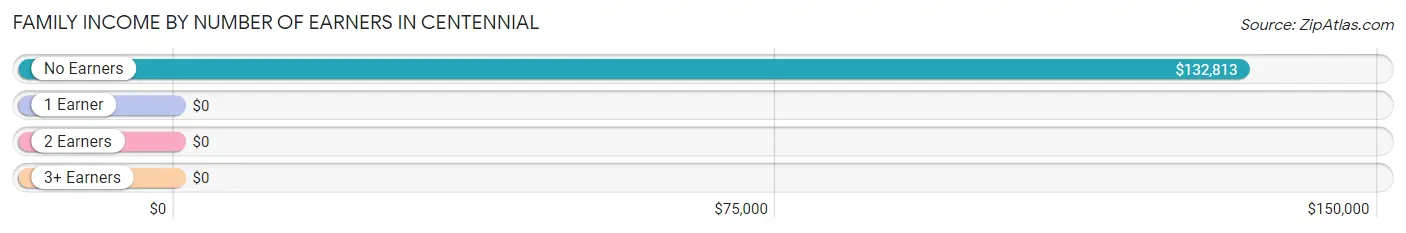
| Number of Earners | # Families | Median Income |
| No Earners | 56 (57.1%) | $132,813 |
| 1 Earner | 13 (13.3%) | $0 |
| 2 Earners | 15 (15.3%) | $0 |
| 3+ Earners | 14 (14.3%) | $0 |
| Total | 98 (100.0%) | $133,906 |
Household Income in Centennial
Household Income Brackets in Centennial
With 53 households falling in the category, the $75,000 to $99,999 income range is the most frequent in Centennial, accounting for 28.2% of all households.
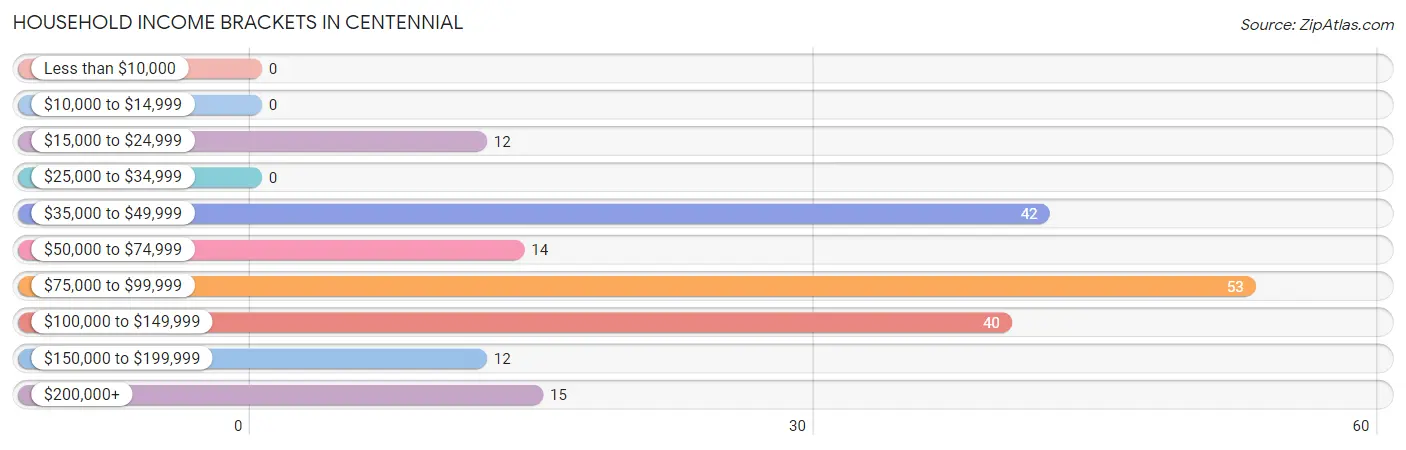
| Income Bracket | # Households | % Households |
| Less than $10,000 | 0 | 0.0% |
| $10,000 to $14,999 | 0 | 0.0% |
| $15,000 to $24,999 | 12 | 6.4% |
| $25,000 to $34,999 | 0 | 0.0% |
| $35,000 to $49,999 | 42 | 22.3% |
| $50,000 to $74,999 | 14 | 7.4% |
| $75,000 to $99,999 | 53 | 28.2% |
| $100,000 to $149,999 | 40 | 21.3% |
| $150,000 to $199,999 | 12 | 6.4% |
| $200,000+ | 15 | 8.0% |
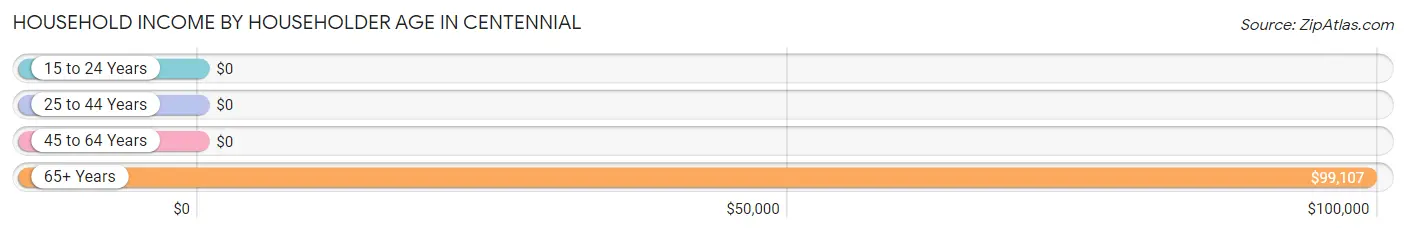
Household Income by Householder Age in Centennial
The median household income in Centennial is $97,589, with the highest median household income of $99,107 found in the 65+ years age bracket for the primary householder. A total of 96 households (51.1%) fall into this category.
| Income Bracket | # Households | Median Income |
| 15 to 24 Years | 0 (0.0%) | $0 |
| 25 to 44 Years | 9 (4.8%) | $0 |
| 45 to 64 Years | 83 (44.2%) | $0 |
| 65+ Years | 96 (51.1%) | $99,107 |
| Total | 188 (100.0%) | $97,589 |
Poverty in Centennial
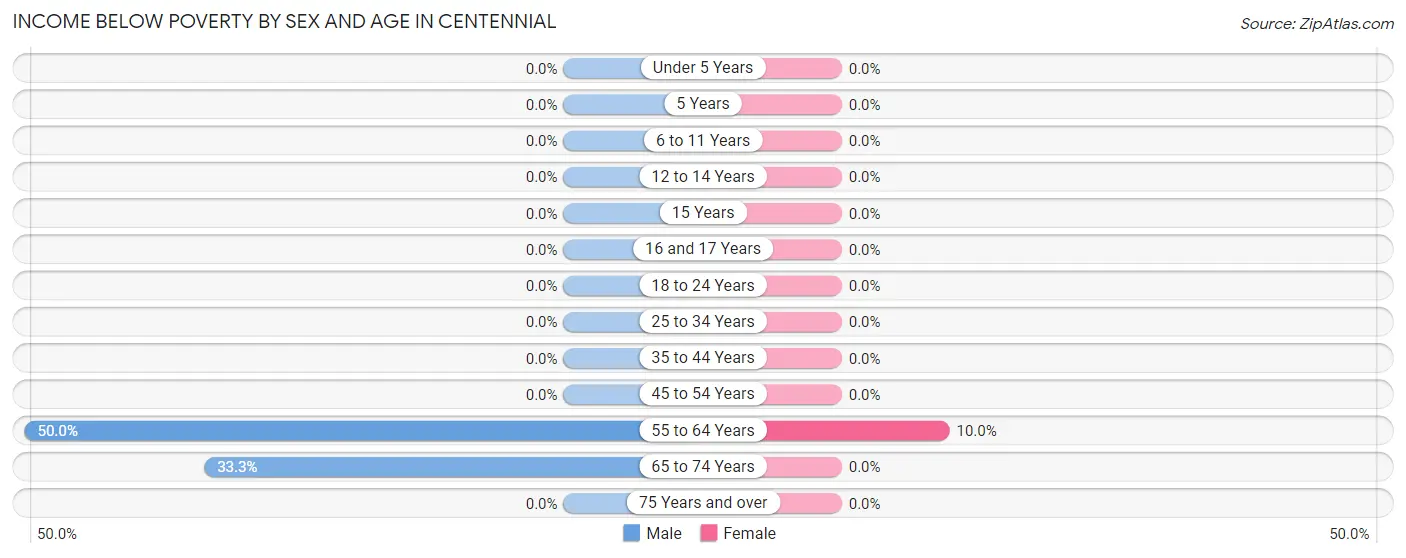
Income Below Poverty by Sex and Age in Centennial
With 26.5% poverty level for males and 3.4% for females among the residents of Centennial, 55 to 64 year old males and 55 to 64 year old females are the most vulnerable to poverty, with 39 males (50.0%) and 6 females (10.0%) in their respective age groups living below the poverty level.
| Age Bracket | Male | Female |
| Under 5 Years | 0 (0.0%) | 0 (0.0%) |
| 5 Years | 0 (0.0%) | 0 (0.0%) |
| 6 to 11 Years | 0 (0.0%) | 0 (0.0%) |
| 12 to 14 Years | 0 (0.0%) | 0 (0.0%) |
| 15 Years | 0 (0.0%) | 0 (0.0%) |
| 16 and 17 Years | 0 (0.0%) | 0 (0.0%) |
| 18 to 24 Years | 0 (0.0%) | 0 (0.0%) |
| 25 to 34 Years | 0 (0.0%) | 0 (0.0%) |
| 35 to 44 Years | 0 (0.0%) | 0 (0.0%) |
| 45 to 54 Years | 0 (0.0%) | 0 (0.0%) |
| 55 to 64 Years | 39 (50.0%) | 6 (10.0%) |
| 65 to 74 Years | 6 (33.3%) | 0 (0.0%) |
| 75 Years and over | 0 (0.0%) | 0 (0.0%) |
| Total | 45 (26.5%) | 6 (3.4%) |
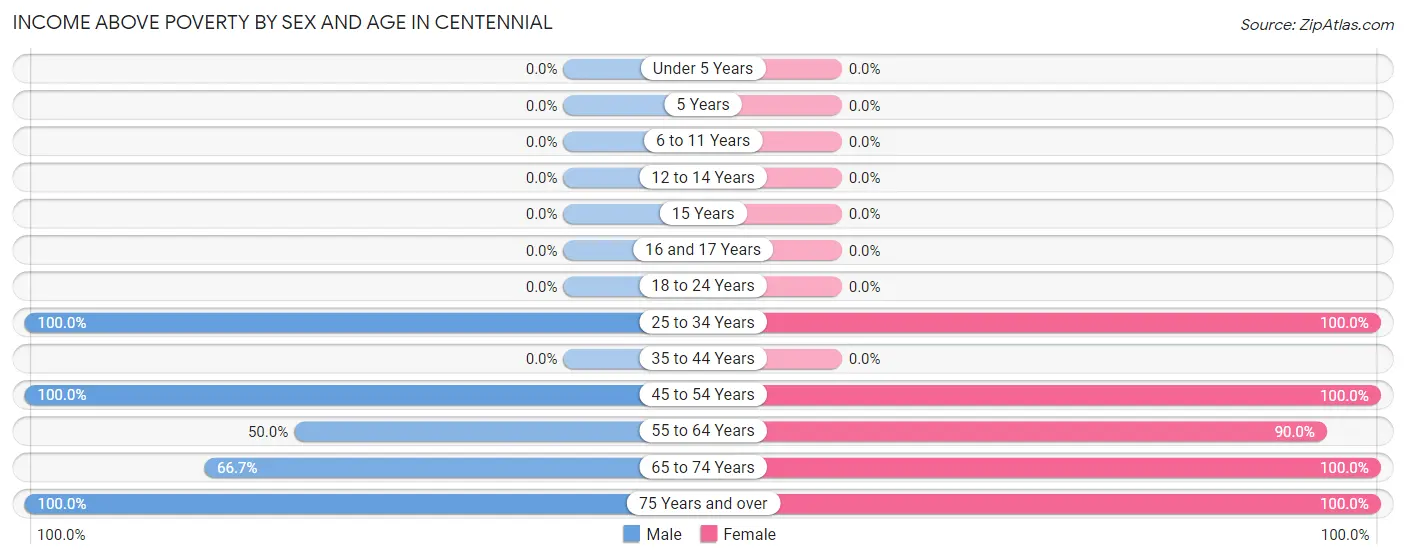
Income Above Poverty by Sex and Age in Centennial
According to the poverty statistics in Centennial, males aged 25 to 34 years and females aged 25 to 34 years are the age groups that are most secure financially, with 100.0% of males and 100.0% of females in these age groups living above the poverty line.
| Age Bracket | Male | Female |
| Under 5 Years | 0 (0.0%) | 0 (0.0%) |
| 5 Years | 0 (0.0%) | 0 (0.0%) |
| 6 to 11 Years | 0 (0.0%) | 0 (0.0%) |
| 12 to 14 Years | 0 (0.0%) | 0 (0.0%) |
| 15 Years | 0 (0.0%) | 0 (0.0%) |
| 16 and 17 Years | 0 (0.0%) | 0 (0.0%) |
| 18 to 24 Years | 0 (0.0%) | 0 (0.0%) |
| 25 to 34 Years | 14 (100.0%) | 16 (100.0%) |
| 35 to 44 Years | 0 (0.0%) | 0 (0.0%) |
| 45 to 54 Years | 14 (100.0%) | 11 (100.0%) |
| 55 to 64 Years | 39 (50.0%) | 54 (90.0%) |
| 65 to 74 Years | 12 (66.7%) | 34 (100.0%) |
| 75 Years and over | 46 (100.0%) | 54 (100.0%) |
| Total | 125 (73.5%) | 169 (96.6%) |
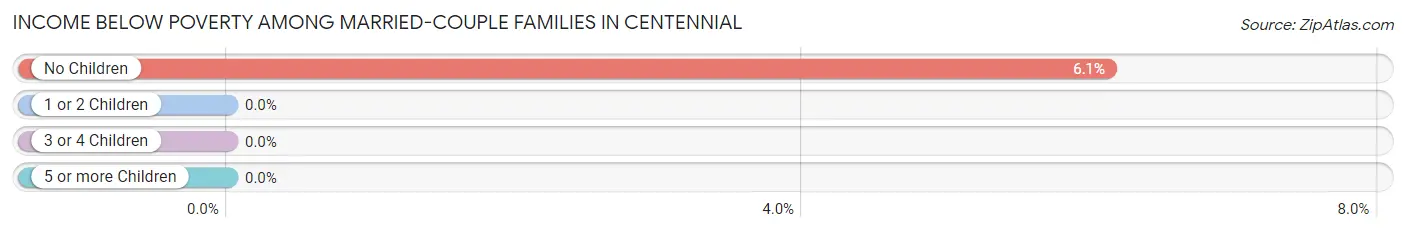
Income Below Poverty Among Married-Couple Families in Centennial
The poverty statistics for married-couple families in Centennial show that 6.1% or 6 of the total 98 families live below the poverty line. Families with no children have the highest poverty rate of 6.1%, comprising of 6 families. On the other hand, families with no children have the lowest poverty rate of 6.1%, which includes 6 families.
| Children | Above Poverty | Below Poverty |
| No Children | 92 (93.9%) | 6 (6.1%) |
| 1 or 2 Children | 0 (0.0%) | 0 (0.0%) |
| 3 or 4 Children | 0 (0.0%) | 0 (0.0%) |
| 5 or more Children | 0 (0.0%) | 0 (0.0%) |
| Total | 92 (93.9%) | 6 (6.1%) |
Income Below Poverty Among Single-Parent Households in Centennial
| Children | Single Father | Single Mother |
| No Children | 0 (0.0%) | 0 (0.0%) |
| 1 or 2 Children | 0 (0.0%) | 0 (0.0%) |
| 3 or 4 Children | 0 (0.0%) | 0 (0.0%) |
| 5 or more Children | 0 (0.0%) | 0 (0.0%) |
| Total | 0 (0.0%) | 0 (0.0%) |
Income Below Poverty Among Married-Couple vs Single-Parent Households in Centennial
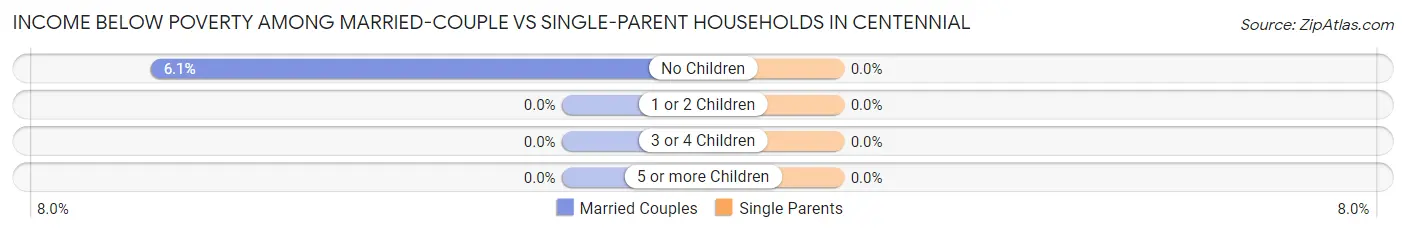
| Children | Married-Couple Families | Single-Parent Households |
| No Children | 6 (6.1%) | 0 (0.0%) |
| 1 or 2 Children | 0 (0.0%) | 0 (0.0%) |
| 3 or 4 Children | 0 (0.0%) | 0 (0.0%) |
| 5 or more Children | 0 (0.0%) | 0 (0.0%) |
| Total | 6 (6.1%) | 0 (0.0%) |
Race in Centennial
The most populous races in Centennial are White / Caucasian (345 | 100.0%), and Hispanic or Latino (9 | 2.6%).
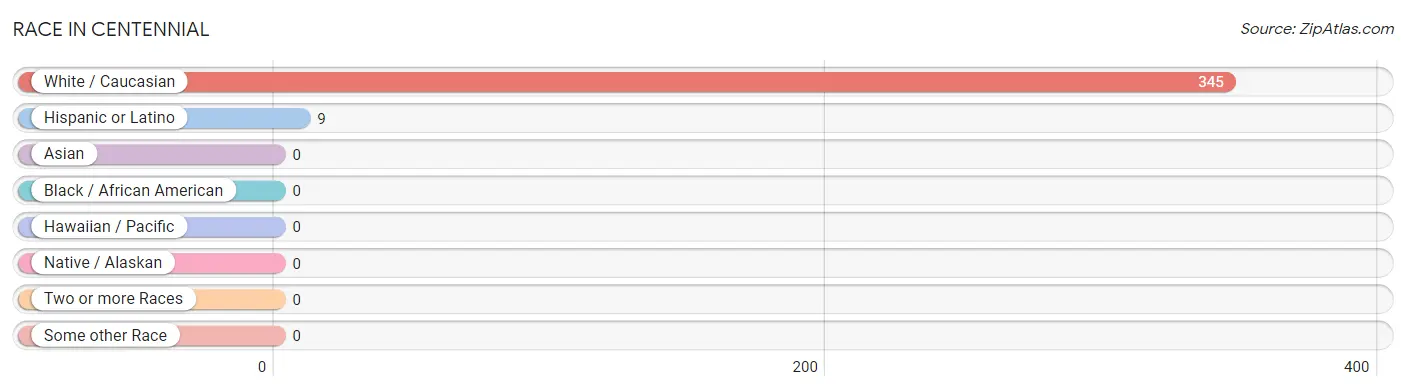
| Race | # Population | % Population |
| Asian | 0 | 0.0% |
| Black / African American | 0 | 0.0% |
| Hawaiian / Pacific | 0 | 0.0% |
| Hispanic or Latino | 9 | 2.6% |
| Native / Alaskan | 0 | 0.0% |
| White / Caucasian | 345 | 100.0% |
| Two or more Races | 0 | 0.0% |
| Some other Race | 0 | 0.0% |
| Total | 345 | 100.0% |
Ancestry in Centennial
The most populous ancestries reported in Centennial are German (112 | 32.5%), English (47 | 13.6%), British (33 | 9.6%), Swedish (33 | 9.6%), and Dutch (30 | 8.7%), together accounting for 73.9% of all Centennial residents.
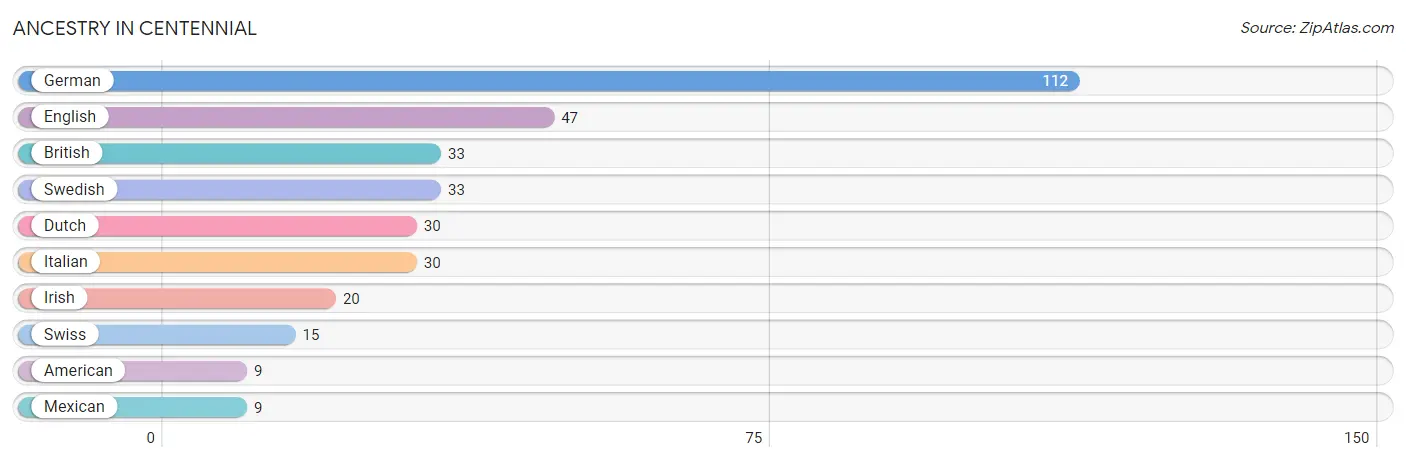
| Ancestry | # Population | % Population |
| American | 9 | 2.6% |
| British | 33 | 9.6% |
| Dutch | 30 | 8.7% |
| English | 47 | 13.6% |
| German | 112 | 32.5% |
| Irish | 20 | 5.8% |
| Italian | 30 | 8.7% |
| Mexican | 9 | 2.6% |
| Swedish | 33 | 9.6% |
| Swiss | 15 | 4.3% | View All 10 Rows |
Immigrants in Centennial

| Immigration Origin | # Population | % Population | View All 0 Rows |
Sex and Age in Centennial
Sex and Age in Centennial
The most populous age groups in Centennial are 60 to 64 Years (54 | 31.8%) for men and 60 to 64 Years (52 | 29.7%) for women.
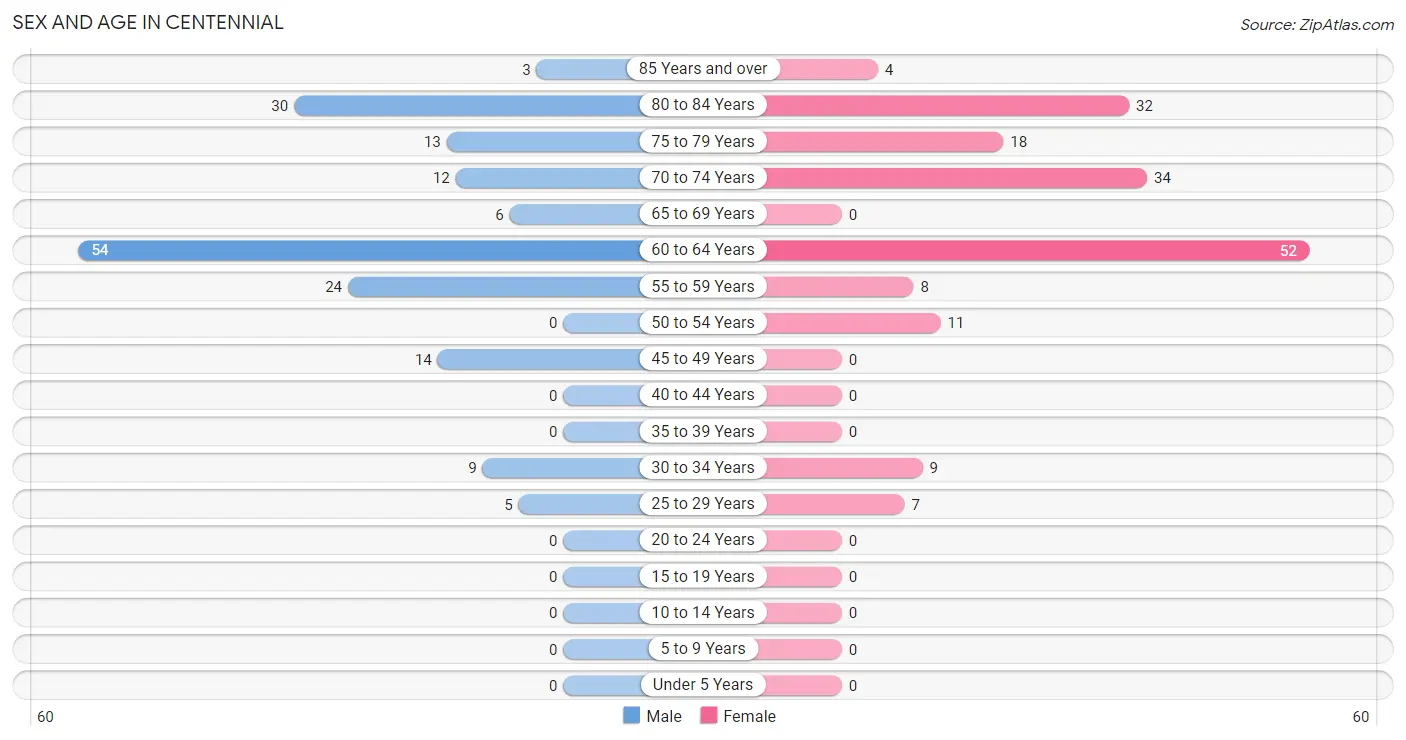
| Age Bracket | Male | Female |
| Under 5 Years | 0 (0.0%) | 0 (0.0%) |
| 5 to 9 Years | 0 (0.0%) | 0 (0.0%) |
| 10 to 14 Years | 0 (0.0%) | 0 (0.0%) |
| 15 to 19 Years | 0 (0.0%) | 0 (0.0%) |
| 20 to 24 Years | 0 (0.0%) | 0 (0.0%) |
| 25 to 29 Years | 5 (2.9%) | 7 (4.0%) |
| 30 to 34 Years | 9 (5.3%) | 9 (5.1%) |
| 35 to 39 Years | 0 (0.0%) | 0 (0.0%) |
| 40 to 44 Years | 0 (0.0%) | 0 (0.0%) |
| 45 to 49 Years | 14 (8.2%) | 0 (0.0%) |
| 50 to 54 Years | 0 (0.0%) | 11 (6.3%) |
| 55 to 59 Years | 24 (14.1%) | 8 (4.6%) |
| 60 to 64 Years | 54 (31.8%) | 52 (29.7%) |
| 65 to 69 Years | 6 (3.5%) | 0 (0.0%) |
| 70 to 74 Years | 12 (7.1%) | 34 (19.4%) |
| 75 to 79 Years | 13 (7.6%) | 18 (10.3%) |
| 80 to 84 Years | 30 (17.6%) | 32 (18.3%) |
| 85 Years and over | 3 (1.8%) | 4 (2.3%) |
| Total | 170 (100.0%) | 175 (100.0%) |
Families and Households in Centennial
Median Family Size in Centennial
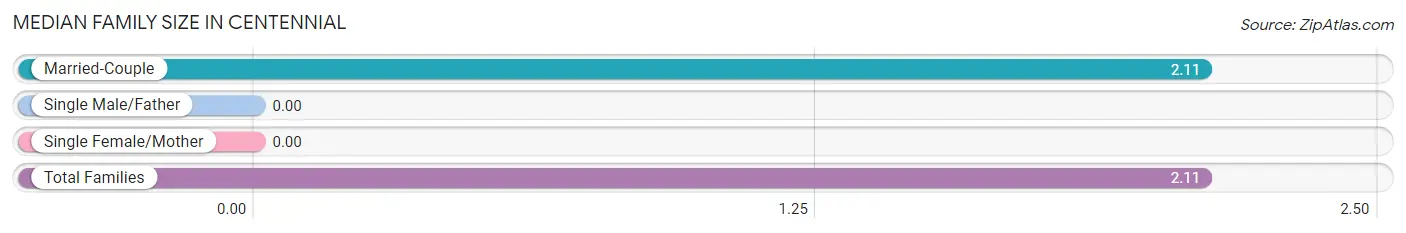
| Family Type | # Families | Family Size |
| Married-Couple | 98 (100.0%) | 2.11 |
| Single Male/Father | 0 (0.0%) | - |
| Single Female/Mother | 0 (0.0%) | - |
| Total Families | 98 (100.0%) | 2.11 |
Median Household Size in Centennial
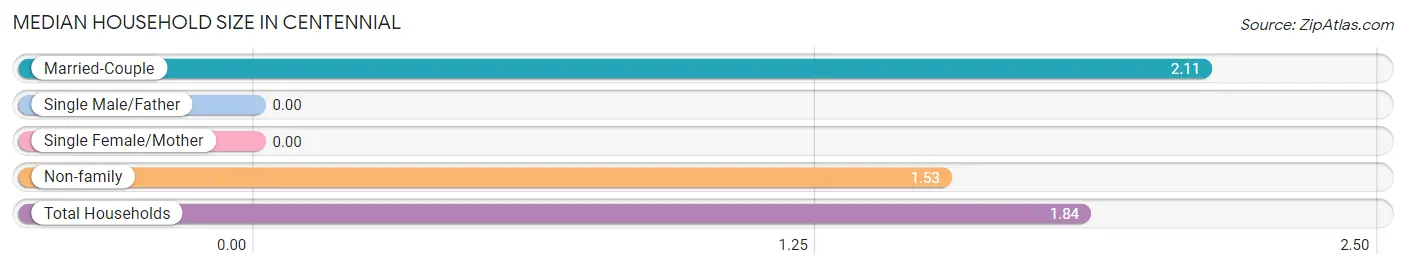
| Household Type | # Households | Household Size |
| Married-Couple | 98 (52.1%) | 2.11 |
| Single Male/Father | 0 (0.0%) | - |
| Single Female/Mother | 0 (0.0%) | - |
| Non-family | 90 (47.9%) | 1.53 |
| Total Households | 188 (100.0%) | 1.84 |
Household Size by Marriage Status in Centennial
Out of a total of 188 households in Centennial, 98 (52.1%) are family households, while 90 (47.9%) are nonfamily households. The most numerous type of family households are 2-person households, comprising 84, and the most common type of nonfamily households are 1-person households, comprising 48.
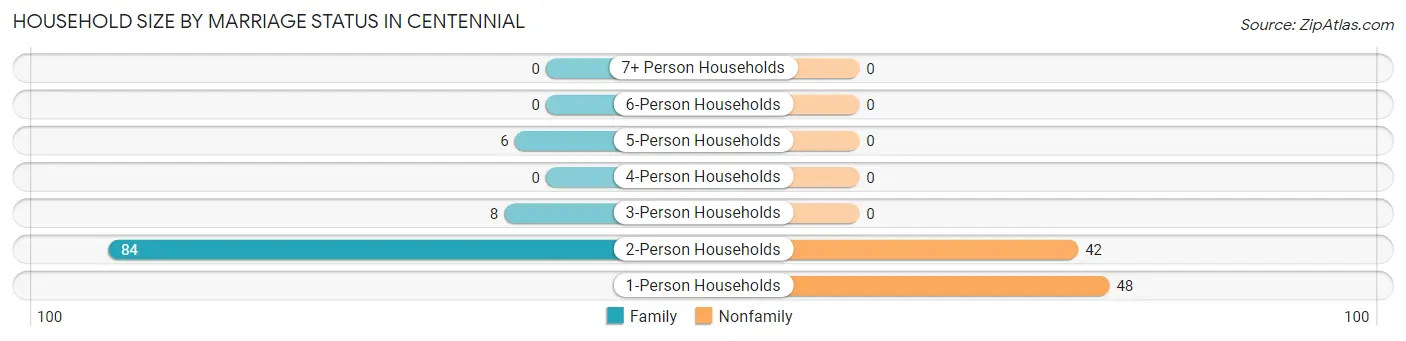
| Household Size | Family Households | Nonfamily Households |
| 1-Person Households | - | 48 (25.5%) |
| 2-Person Households | 84 (44.7%) | 42 (22.3%) |
| 3-Person Households | 8 (4.3%) | 0 (0.0%) |
| 4-Person Households | 0 (0.0%) | 0 (0.0%) |
| 5-Person Households | 6 (3.2%) | 0 (0.0%) |
| 6-Person Households | 0 (0.0%) | 0 (0.0%) |
| 7+ Person Households | 0 (0.0%) | 0 (0.0%) |
| Total | 98 (52.1%) | 90 (47.9%) |
Female Fertility in Centennial
Fertility by Age in Centennial
| Age Bracket | Women with Births | Births / 1,000 Women |
| 15 to 19 years | 0 (0.0%) | 0.0 |
| 20 to 34 years | 0 (0.0%) | 0.0 |
| 35 to 50 years | 0 (0.0%) | 0.0 |
| Total | 0 (0.0%) | 0.0 |
Fertility by Age by Marriage Status in Centennial
| Age Bracket | Married | Unmarried |
| 15 to 19 years | 0 (0.0%) | 0 (0.0%) |
| 20 to 34 years | 0 (0.0%) | 0 (0.0%) |
| 35 to 50 years | 0 (0.0%) | 0 (0.0%) |
| Total | 0 (0.0%) | 0 (0.0%) |
Fertility by Education in Centennial
| Educational Attainment | Women with Births | Births / 1,000 Women |
| Less than High School | 0 (0.0%) | 0.0 |
| High School Diploma | 0 (0.0%) | 0.0 |
| College or Associate's Degree | 0 (0.0%) | 0.0 |
| Bachelor's Degree | 0 (0.0%) | 0.0 |
| Graduate Degree | 0 (0.0%) | 0.0 |
| Total | 0 (0.0%) | 0.0 |
Fertility by Education by Marriage Status in Centennial
| Educational Attainment | Married | Unmarried |
| Less than High School | 0 (0.0%) | 0 (0.0%) |
| High School Diploma | 0 (0.0%) | 0 (0.0%) |
| College or Associate's Degree | 0 (0.0%) | 0 (0.0%) |
| Bachelor's Degree | 0 (0.0%) | 0 (0.0%) |
| Graduate Degree | 0 (0.0%) | 0 (0.0%) |
| Total | 0 (0.0%) | 0 (0.0%) |
Employment Characteristics in Centennial
Employment by Class of Employer in Centennial
Among the 89 employed individuals in Centennial, private company employees (70 | 78.6%), not-for-profit organizations (12 | 13.5%), and self-employed (incorporated) (7 | 7.9%) make up the most common classes of employment.
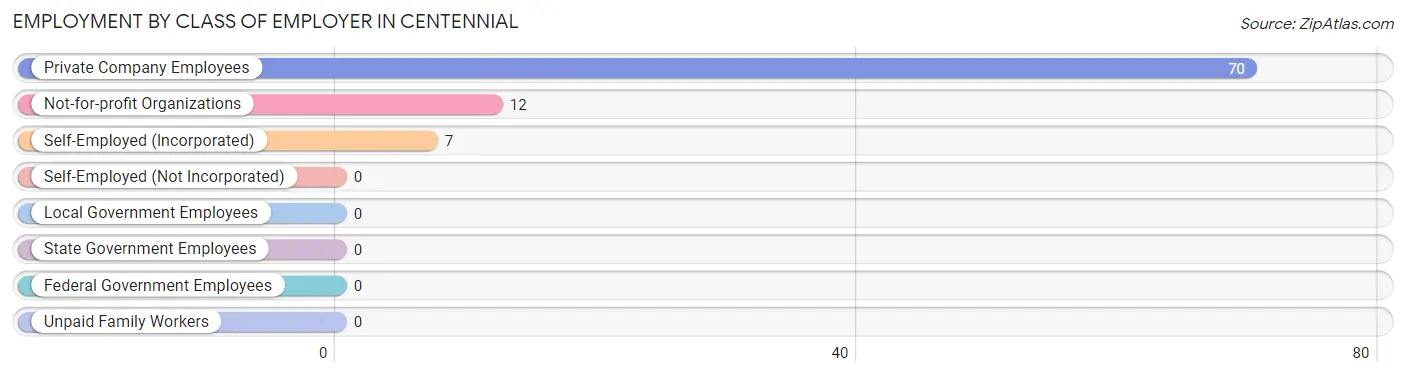
| Employer Class | # Employees | % Employees |
| Private Company Employees | 70 | 78.6% |
| Self-Employed (Incorporated) | 7 | 7.9% |
| Self-Employed (Not Incorporated) | 0 | 0.0% |
| Not-for-profit Organizations | 12 | 13.5% |
| Local Government Employees | 0 | 0.0% |
| State Government Employees | 0 | 0.0% |
| Federal Government Employees | 0 | 0.0% |
| Unpaid Family Workers | 0 | 0.0% |
| Total | 89 | 100.0% |
Employment Status by Age in Centennial
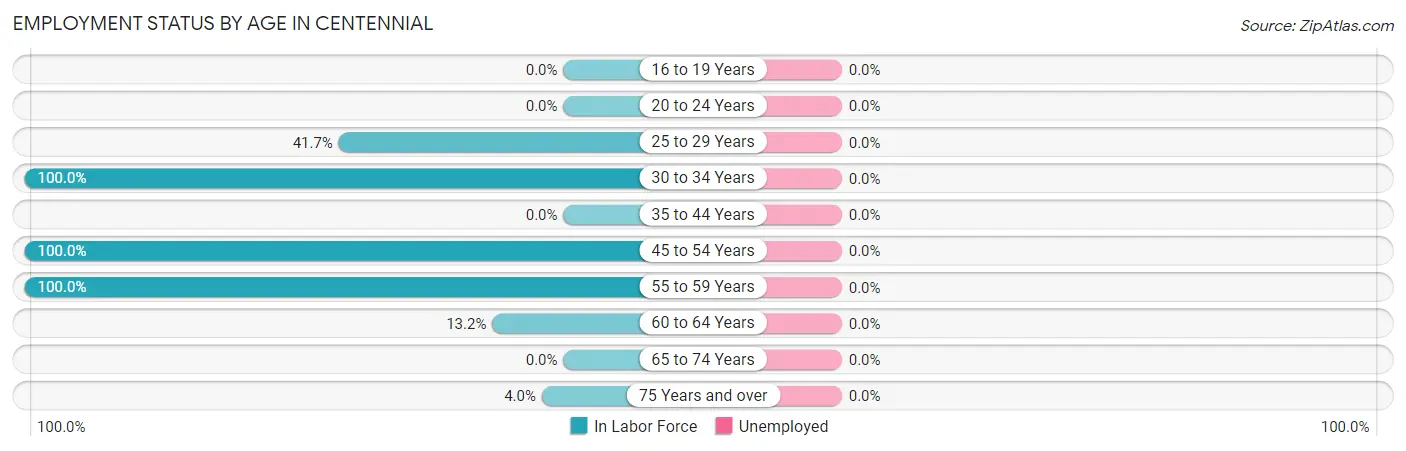
| Age Bracket | In Labor Force | Unemployed |
| 16 to 19 Years | 0 (0.0%) | 0 (0.0%) |
| 20 to 24 Years | 0 (0.0%) | 0 (0.0%) |
| 25 to 29 Years | 5 (41.7%) | 0 (0.0%) |
| 30 to 34 Years | 18 (100.0%) | 0 (0.0%) |
| 35 to 44 Years | 0 (0.0%) | 0 (0.0%) |
| 45 to 54 Years | 25 (100.0%) | 0 (0.0%) |
| 55 to 59 Years | 32 (100.0%) | 0 (0.0%) |
| 60 to 64 Years | 14 (13.2%) | 0 (0.0%) |
| 65 to 74 Years | 0 (0.0%) | 0 (0.0%) |
| 75 Years and over | 4 (4.0%) | 0 (0.0%) |
| Total | 98 (28.4%) | 0 (0.0%) |
Employment Status by Educational Attainment in Centennial
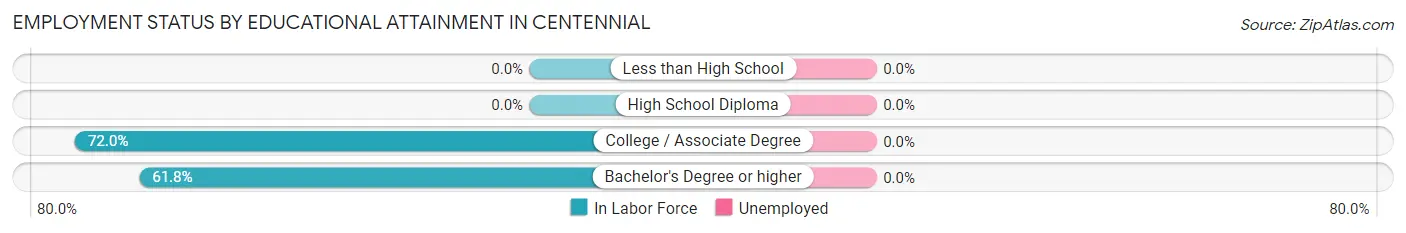
| Educational Attainment | In Labor Force | Unemployed |
| Less than High School | 0 (0.0%) | 0 (0.0%) |
| High School Diploma | 0 (0.0%) | 0 (0.0%) |
| College / Associate Degree | 18 (72.0%) | 0 (0.0%) |
| Bachelor's Degree or higher | 76 (61.8%) | 0 (0.0%) |
| Total | 94 (48.7%) | 0 (0.0%) |
Employment Occupations by Sex in Centennial
Management, Business, Science and Arts Occupations
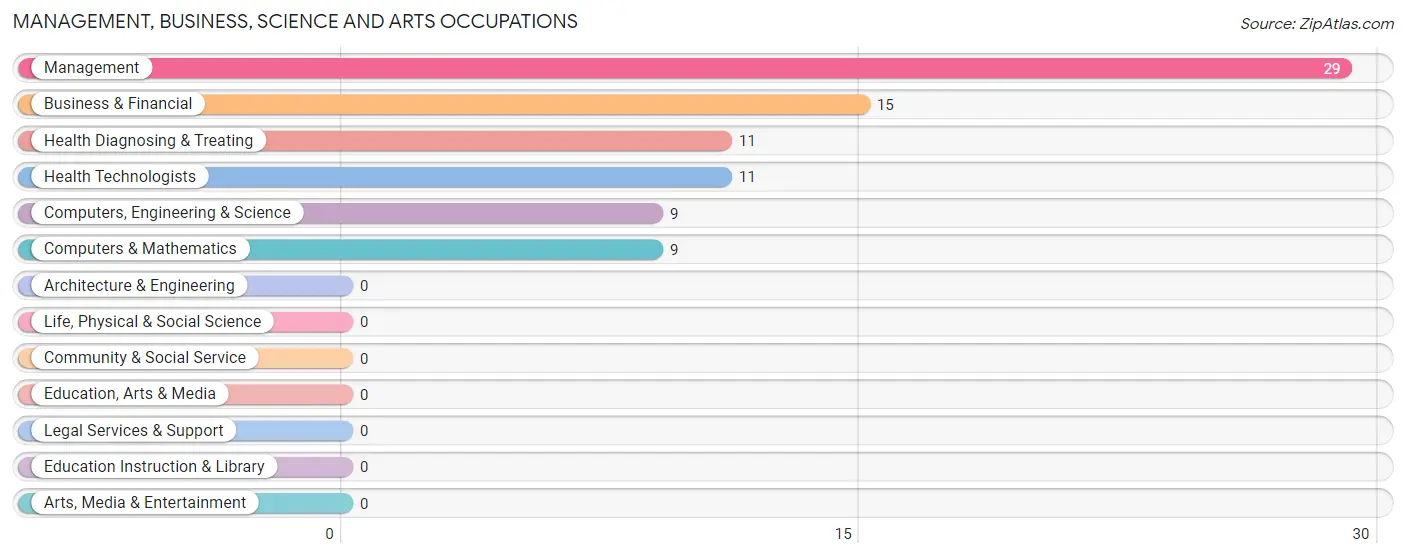
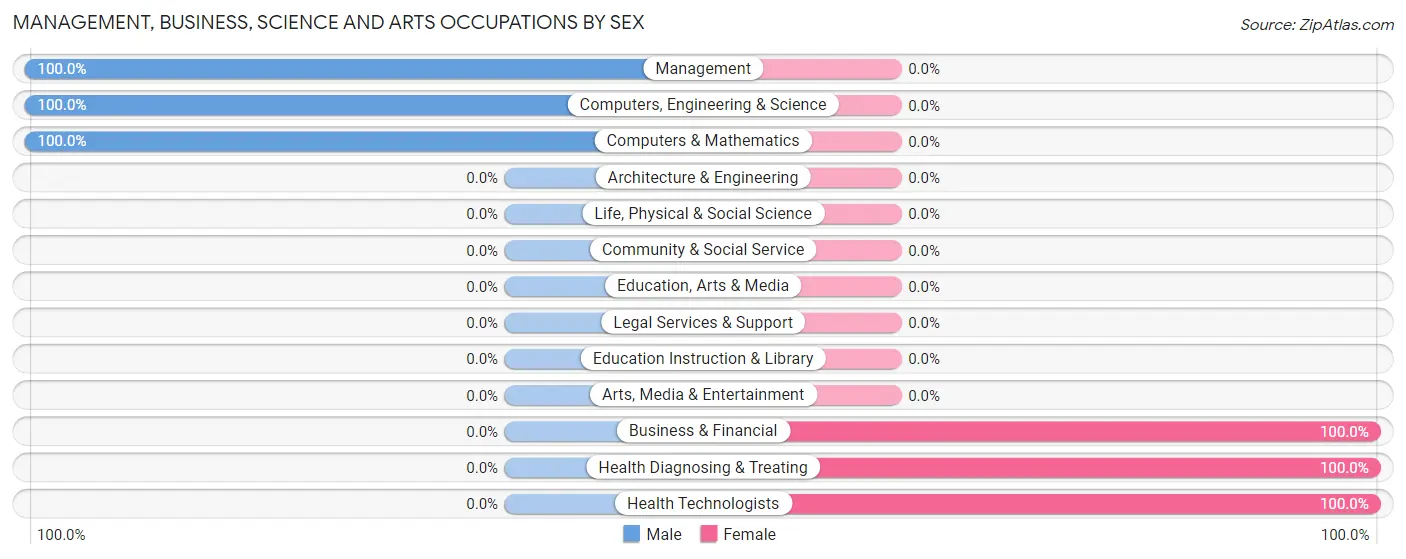
The most common Management, Business, Science and Arts occupations in Centennial are Management (29 | 29.6%), Business & Financial (15 | 15.3%), Health Diagnosing & Treating (11 | 11.2%), Health Technologists (11 | 11.2%), and Computers, Engineering & Science (9 | 9.2%).
Management, Business, Science and Arts Occupations by Sex
Within the Management, Business, Science and Arts occupations in Centennial, the most male-oriented occupations are Management (100.0%), Computers, Engineering & Science (100.0%), and Computers & Mathematics (100.0%), while the most female-oriented occupations are Business & Financial (100.0%), Health Diagnosing & Treating (100.0%), and Health Technologists (100.0%).
| Occupation | Male | Female |
| Management | 29 (100.0%) | 0 (0.0%) |
| Business & Financial | 0 (0.0%) | 15 (100.0%) |
| Computers, Engineering & Science | 9 (100.0%) | 0 (0.0%) |
| Computers & Mathematics | 9 (100.0%) | 0 (0.0%) |
| Architecture & Engineering | 0 (0.0%) | 0 (0.0%) |
| Life, Physical & Social Science | 0 (0.0%) | 0 (0.0%) |
| Community & Social Service | 0 (0.0%) | 0 (0.0%) |
| Education, Arts & Media | 0 (0.0%) | 0 (0.0%) |
| Legal Services & Support | 0 (0.0%) | 0 (0.0%) |
| Education Instruction & Library | 0 (0.0%) | 0 (0.0%) |
| Arts, Media & Entertainment | 0 (0.0%) | 0 (0.0%) |
| Health Diagnosing & Treating | 0 (0.0%) | 11 (100.0%) |
| Health Technologists | 0 (0.0%) | 11 (100.0%) |
| Total (Category) | 38 (59.4%) | 26 (40.6%) |
| Total (Overall) | 59 (60.2%) | 39 (39.8%) |
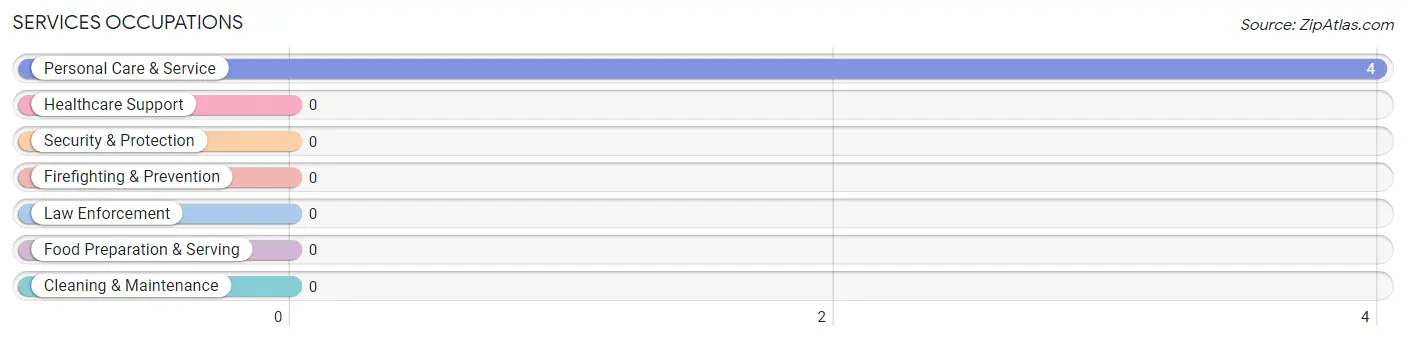
Services Occupations
The most common Services occupations in Centennial are , and Personal Care & Service (4 | 4.1%).
Services Occupations by Sex
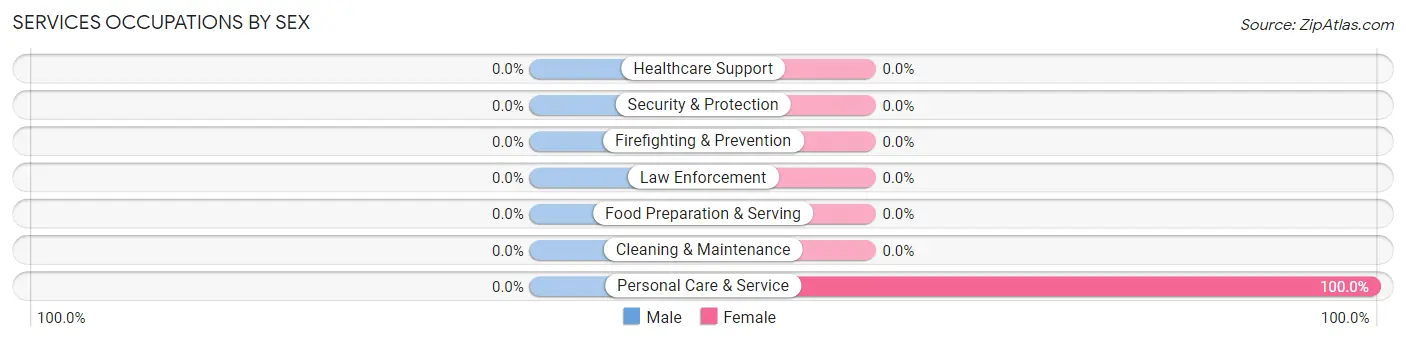
| Occupation | Male | Female |
| Healthcare Support | 0 (0.0%) | 0 (0.0%) |
| Security & Protection | 0 (0.0%) | 0 (0.0%) |
| Firefighting & Prevention | 0 (0.0%) | 0 (0.0%) |
| Law Enforcement | 0 (0.0%) | 0 (0.0%) |
| Food Preparation & Serving | 0 (0.0%) | 0 (0.0%) |
| Cleaning & Maintenance | 0 (0.0%) | 0 (0.0%) |
| Personal Care & Service | 0 (0.0%) | 4 (100.0%) |
| Total (Category) | 0 (0.0%) | 4 (100.0%) |
| Total (Overall) | 59 (60.2%) | 39 (39.8%) |
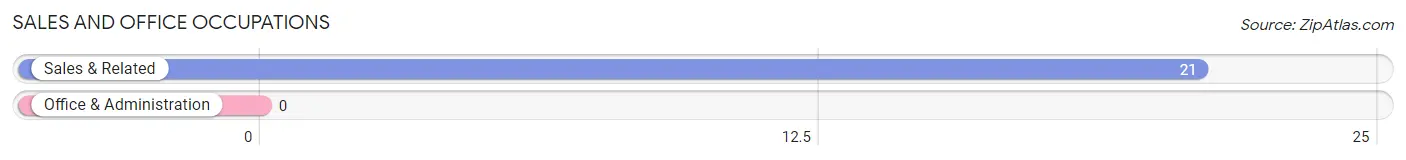
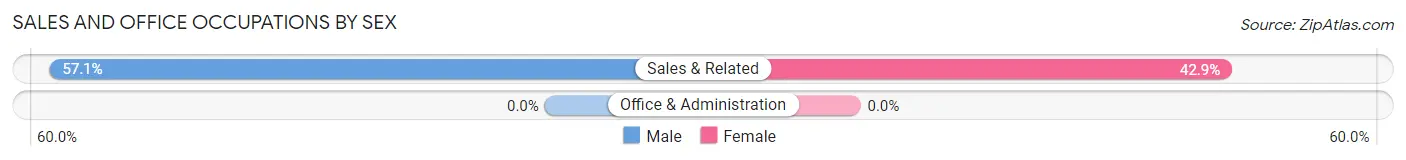
Sales and Office Occupations
The most common Sales and Office occupations in Centennial are , and Sales & Related (21 | 21.4%).
Sales and Office Occupations by Sex
| Occupation | Male | Female |
| Sales & Related | 12 (57.1%) | 9 (42.9%) |
| Office & Administration | 0 (0.0%) | 0 (0.0%) |
| Total (Category) | 12 (57.1%) | 9 (42.9%) |
| Total (Overall) | 59 (60.2%) | 39 (39.8%) |
Natural Resources, Construction and Maintenance Occupations
Natural Resources, Construction and Maintenance Occupations by Sex
| Occupation | Male | Female |
| Farming, Fishing & Forestry | 0 (0.0%) | 0 (0.0%) |
| Construction & Extraction | 0 (0.0%) | 0 (0.0%) |
| Installation, Maintenance & Repair | 0 (0.0%) | 0 (0.0%) |
| Total (Category) | 0 (0.0%) | 0 (0.0%) |
| Total (Overall) | 59 (60.2%) | 39 (39.8%) |
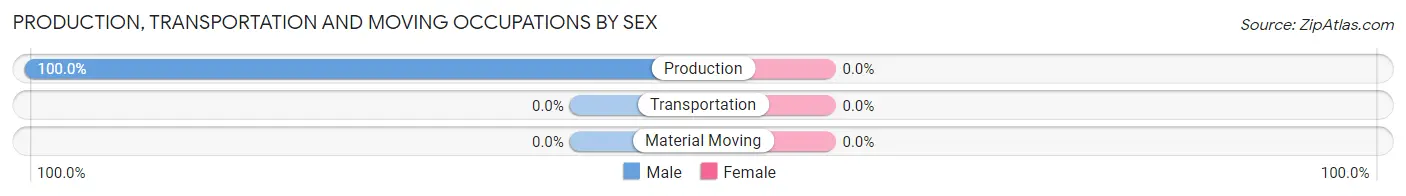
Production, Transportation and Moving Occupations
The most common Production, Transportation and Moving occupations in Centennial are , and Production (9 | 9.2%).
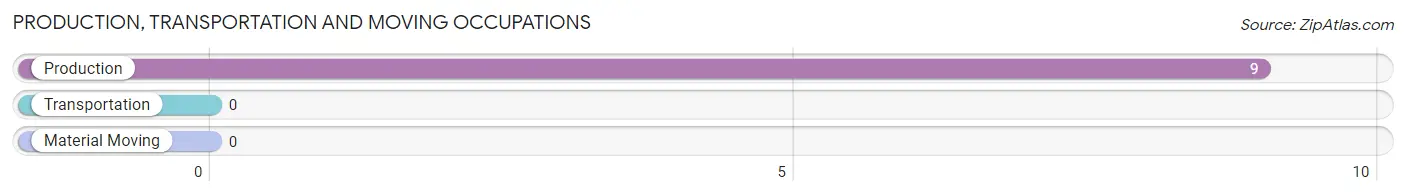
Production, Transportation and Moving Occupations by Sex
| Occupation | Male | Female |
| Production | 9 (100.0%) | 0 (0.0%) |
| Transportation | 0 (0.0%) | 0 (0.0%) |
| Material Moving | 0 (0.0%) | 0 (0.0%) |
| Total (Category) | 9 (100.0%) | 0 (0.0%) |
| Total (Overall) | 59 (60.2%) | 39 (39.8%) |
Employment Industries by Sex in Centennial
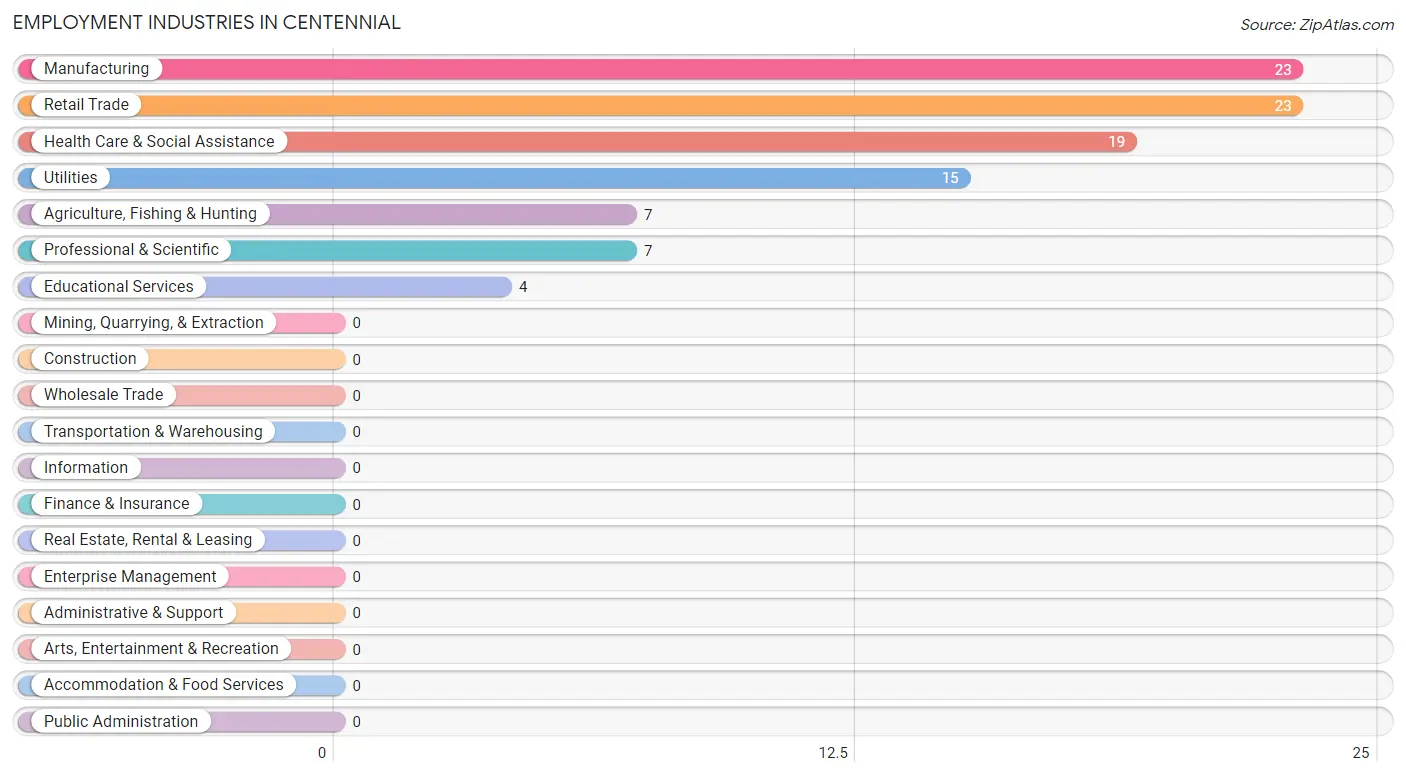
Employment Industries in Centennial
The major employment industries in Centennial include Manufacturing (23 | 23.5%), Retail Trade (23 | 23.5%), Health Care & Social Assistance (19 | 19.4%), Utilities (15 | 15.3%), and Agriculture, Fishing & Hunting (7 | 7.1%).
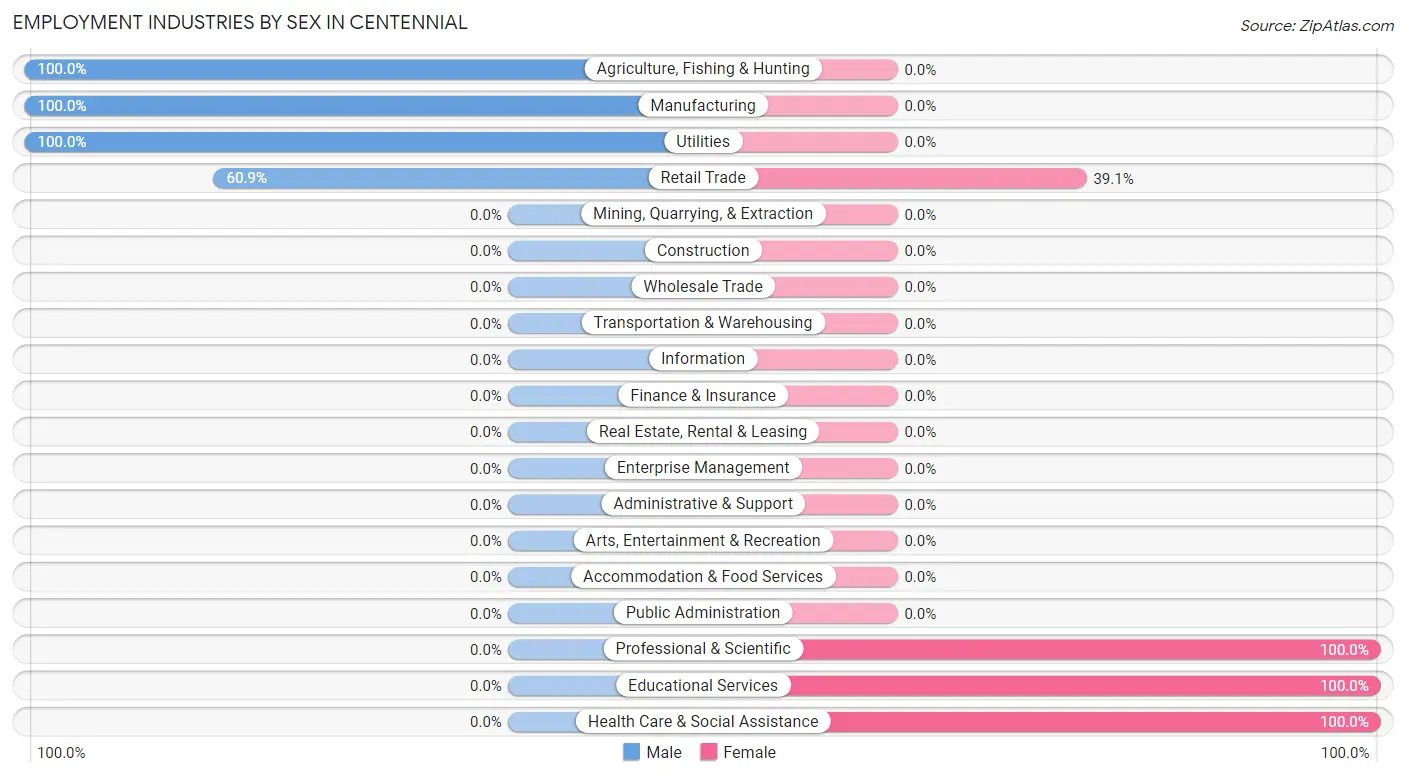
Employment Industries by Sex in Centennial
The Centennial industries that see more men than women are Agriculture, Fishing & Hunting (100.0%), Manufacturing (100.0%), and Utilities (100.0%), whereas the industries that tend to have a higher number of women are Professional & Scientific (100.0%), Educational Services (100.0%), and Health Care & Social Assistance (100.0%).
| Industry | Male | Female |
| Agriculture, Fishing & Hunting | 7 (100.0%) | 0 (0.0%) |
| Mining, Quarrying, & Extraction | 0 (0.0%) | 0 (0.0%) |
| Construction | 0 (0.0%) | 0 (0.0%) |
| Manufacturing | 23 (100.0%) | 0 (0.0%) |
| Wholesale Trade | 0 (0.0%) | 0 (0.0%) |
| Retail Trade | 14 (60.9%) | 9 (39.1%) |
| Transportation & Warehousing | 0 (0.0%) | 0 (0.0%) |
| Utilities | 15 (100.0%) | 0 (0.0%) |
| Information | 0 (0.0%) | 0 (0.0%) |
| Finance & Insurance | 0 (0.0%) | 0 (0.0%) |
| Real Estate, Rental & Leasing | 0 (0.0%) | 0 (0.0%) |
| Professional & Scientific | 0 (0.0%) | 7 (100.0%) |
| Enterprise Management | 0 (0.0%) | 0 (0.0%) |
| Administrative & Support | 0 (0.0%) | 0 (0.0%) |
| Educational Services | 0 (0.0%) | 4 (100.0%) |
| Health Care & Social Assistance | 0 (0.0%) | 19 (100.0%) |
| Arts, Entertainment & Recreation | 0 (0.0%) | 0 (0.0%) |
| Accommodation & Food Services | 0 (0.0%) | 0 (0.0%) |
| Public Administration | 0 (0.0%) | 0 (0.0%) |
| Total | 59 (60.2%) | 39 (39.8%) |
Education in Centennial
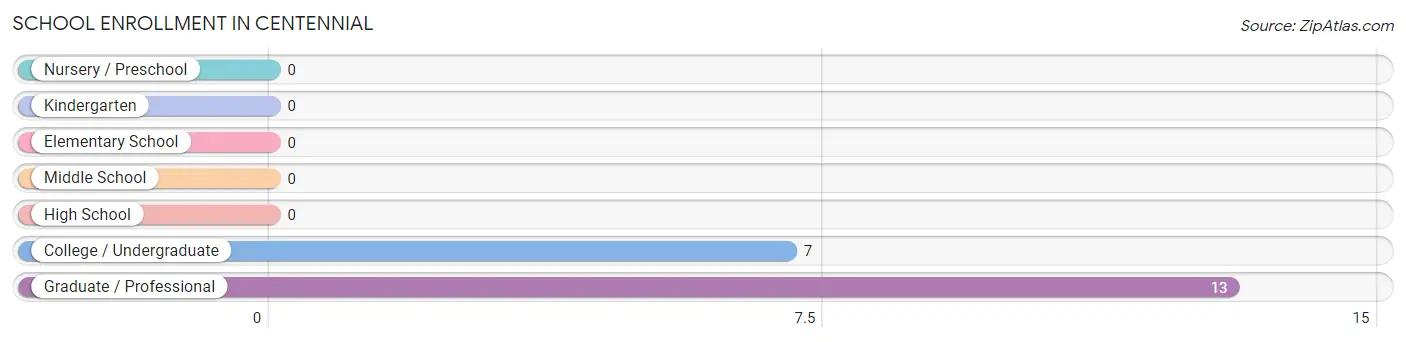
School Enrollment in Centennial
The most common levels of schooling among the 20 students in Centennial are graduate / professional (13 | 65.0%), and college / undergraduate (7 | 35.0%).
| School Level | # Students | % Students |
| Nursery / Preschool | 0 | 0.0% |
| Kindergarten | 0 | 0.0% |
| Elementary School | 0 | 0.0% |
| Middle School | 0 | 0.0% |
| High School | 0 | 0.0% |
| College / Undergraduate | 7 | 35.0% |
| Graduate / Professional | 13 | 65.0% |
| Total | 20 | 100.0% |
School Enrollment by Age by Funding Source in Centennial
Out of a total of 20 students who are enrolled in schools in Centennial, 7 (35.0%) attend a private institution, while the remaining 13 (65.0%) are enrolled in public schools. The age group of 25 to 34 year olds has the highest likelihood of being enrolled in private schools, with 7 (58.3% in the age bracket) enrolled. Conversely, the age group of 35 years and over has the lowest likelihood of being enrolled in a private school, with 8 (100.0% in the age bracket) attending a public institution.
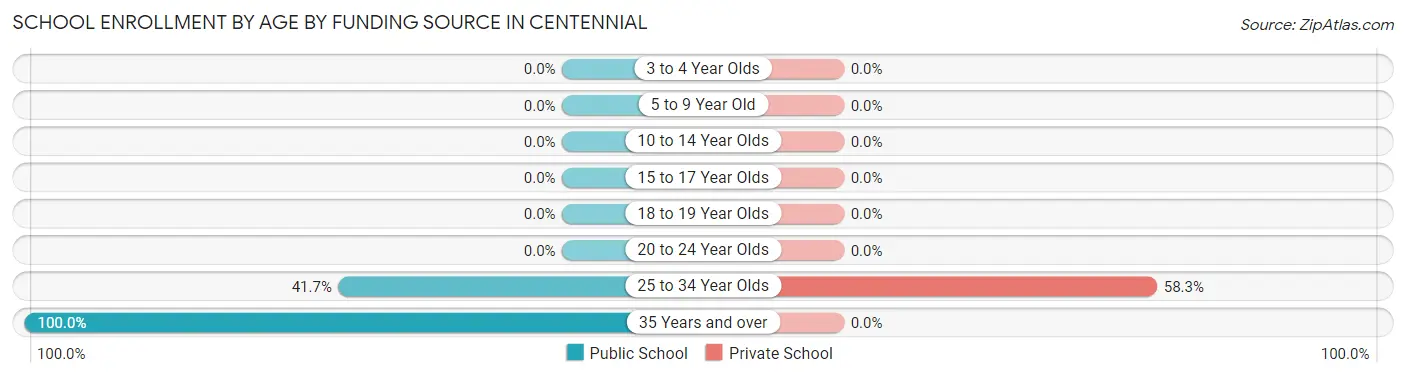
| Age Bracket | Public School | Private School |
| 3 to 4 Year Olds | 0 (0.0%) | 0 (0.0%) |
| 5 to 9 Year Old | 0 (0.0%) | 0 (0.0%) |
| 10 to 14 Year Olds | 0 (0.0%) | 0 (0.0%) |
| 15 to 17 Year Olds | 0 (0.0%) | 0 (0.0%) |
| 18 to 19 Year Olds | 0 (0.0%) | 0 (0.0%) |
| 20 to 24 Year Olds | 0 (0.0%) | 0 (0.0%) |
| 25 to 34 Year Olds | 5 (41.7%) | 7 (58.3%) |
| 35 Years and over | 8 (100.0%) | 0 (0.0%) |
| Total | 13 (65.0%) | 7 (35.0%) |
Educational Attainment by Field of Study in Centennial
Education (135 | 40.4%), arts & humanities (56 | 16.8%), business (38 | 11.4%), engineering (28 | 8.4%), and computers & mathematics (15 | 4.5%) are the most common fields of study among 334 individuals in Centennial who have obtained a bachelor's degree or higher.
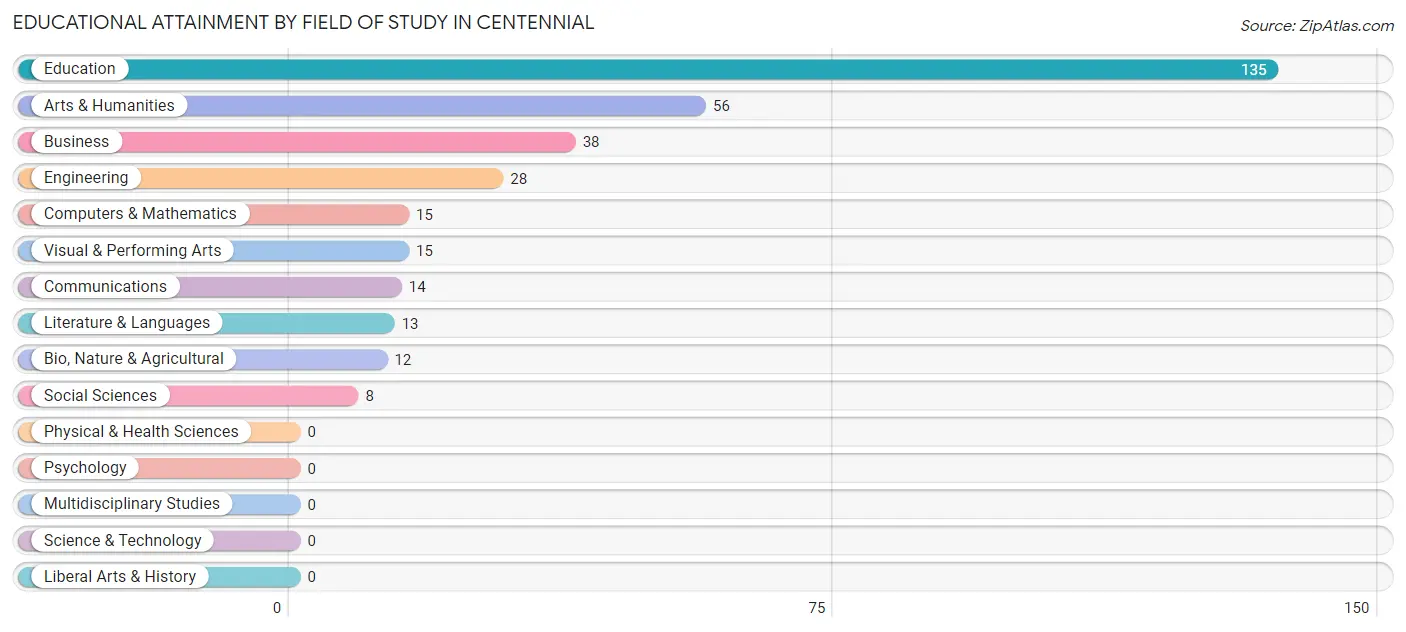
| Field of Study | # Graduates | % Graduates |
| Computers & Mathematics | 15 | 4.5% |
| Bio, Nature & Agricultural | 12 | 3.6% |
| Physical & Health Sciences | 0 | 0.0% |
| Psychology | 0 | 0.0% |
| Social Sciences | 8 | 2.4% |
| Engineering | 28 | 8.4% |
| Multidisciplinary Studies | 0 | 0.0% |
| Science & Technology | 0 | 0.0% |
| Business | 38 | 11.4% |
| Education | 135 | 40.4% |
| Literature & Languages | 13 | 3.9% |
| Liberal Arts & History | 0 | 0.0% |
| Visual & Performing Arts | 15 | 4.5% |
| Communications | 14 | 4.2% |
| Arts & Humanities | 56 | 16.8% |
| Total | 334 | 100.0% |
Transportation & Commute in Centennial
Vehicle Availability by Sex in Centennial
The most prevalent vehicle ownership categories in Centennial are males with 3 vehicles (15, accounting for 30.0%) and females with 3 vehicles (11, making up 38.5%).
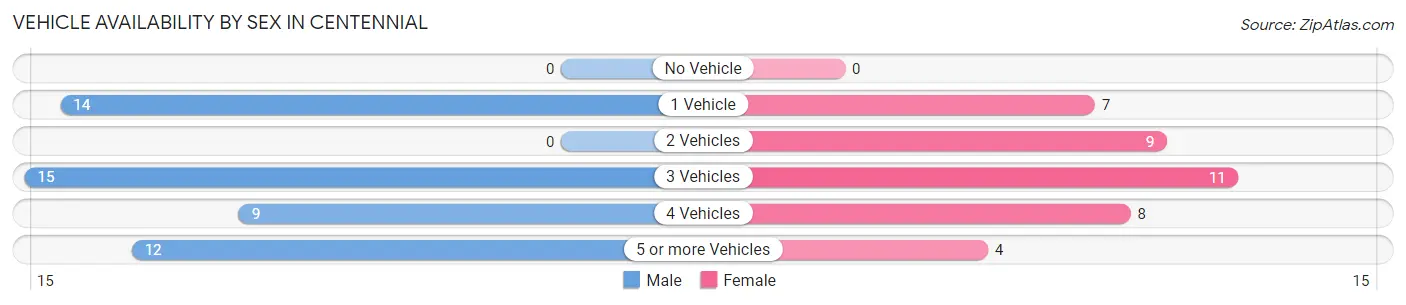
| Vehicles Available | Male | Female |
| No Vehicle | 0 (0.0%) | 0 (0.0%) |
| 1 Vehicle | 14 (28.0%) | 7 (17.9%) |
| 2 Vehicles | 0 (0.0%) | 9 (23.1%) |
| 3 Vehicles | 15 (30.0%) | 11 (28.2%) |
| 4 Vehicles | 9 (18.0%) | 8 (20.5%) |
| 5 or more Vehicles | 12 (24.0%) | 4 (10.3%) |
| Total | 50 (100.0%) | 39 (100.0%) |
Commute Time in Centennial
The most frequently occuring commute durations in Centennial are 30 to 34 minutes (14 commuters, 36.8%), less than 5 minutes (9 commuters, 23.7%), and 45 to 59 minutes (8 commuters, 21.0%).
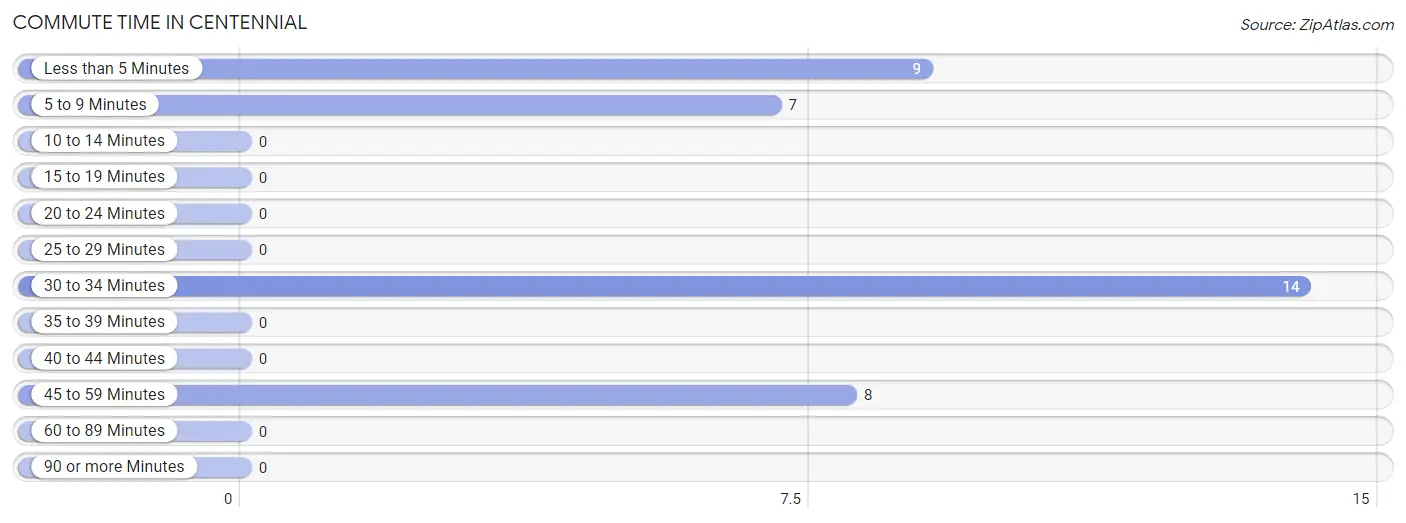
| Commute Time | # Commuters | % Commuters |
| Less than 5 Minutes | 9 | 23.7% |
| 5 to 9 Minutes | 7 | 18.4% |
| 10 to 14 Minutes | 0 | 0.0% |
| 15 to 19 Minutes | 0 | 0.0% |
| 20 to 24 Minutes | 0 | 0.0% |
| 25 to 29 Minutes | 0 | 0.0% |
| 30 to 34 Minutes | 14 | 36.8% |
| 35 to 39 Minutes | 0 | 0.0% |
| 40 to 44 Minutes | 0 | 0.0% |
| 45 to 59 Minutes | 8 | 21.0% |
| 60 to 89 Minutes | 0 | 0.0% |
| 90 or more Minutes | 0 | 0.0% |
Commute Time by Sex in Centennial
The most common commute times in Centennial are 30 to 34 minutes (14 commuters, 66.7%) for males and less than 5 minutes (9 commuters, 52.9%) for females.
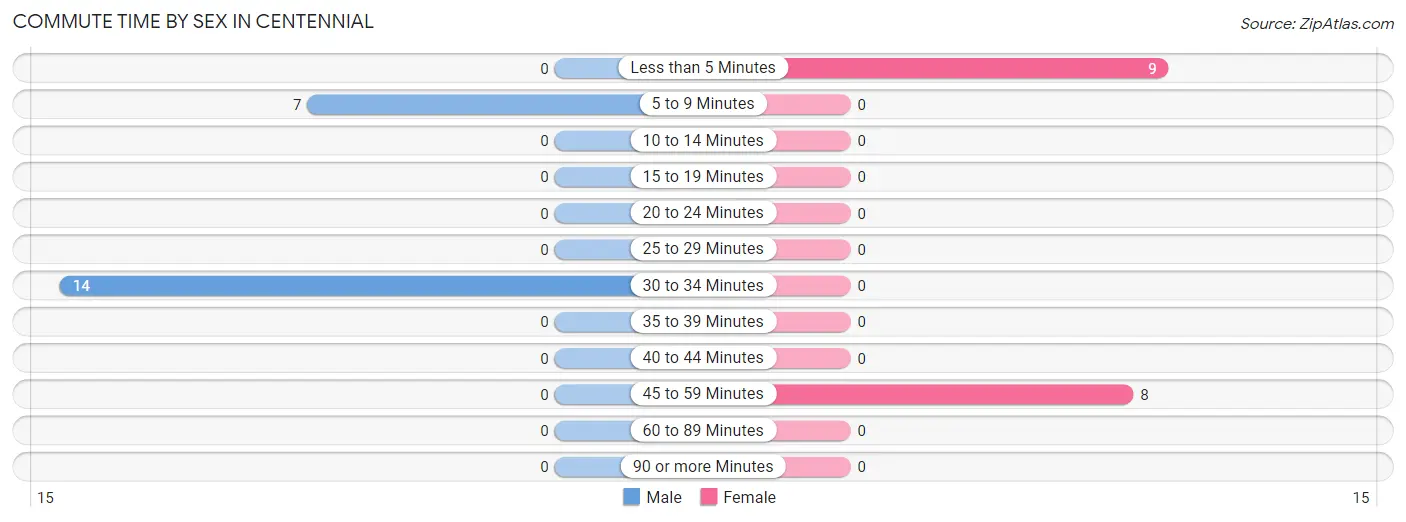
| Commute Time | Male | Female |
| Less than 5 Minutes | 0 (0.0%) | 9 (52.9%) |
| 5 to 9 Minutes | 7 (33.3%) | 0 (0.0%) |
| 10 to 14 Minutes | 0 (0.0%) | 0 (0.0%) |
| 15 to 19 Minutes | 0 (0.0%) | 0 (0.0%) |
| 20 to 24 Minutes | 0 (0.0%) | 0 (0.0%) |
| 25 to 29 Minutes | 0 (0.0%) | 0 (0.0%) |
| 30 to 34 Minutes | 14 (66.7%) | 0 (0.0%) |
| 35 to 39 Minutes | 0 (0.0%) | 0 (0.0%) |
| 40 to 44 Minutes | 0 (0.0%) | 0 (0.0%) |
| 45 to 59 Minutes | 0 (0.0%) | 8 (47.1%) |
| 60 to 89 Minutes | 0 (0.0%) | 0 (0.0%) |
| 90 or more Minutes | 0 (0.0%) | 0 (0.0%) |
Time of Departure to Work by Sex in Centennial
The most frequent times of departure to work in Centennial are 7:30 AM to 7:59 AM (14, 66.7%) for males and 5:30 AM to 5:59 AM (9, 52.9%) for females.
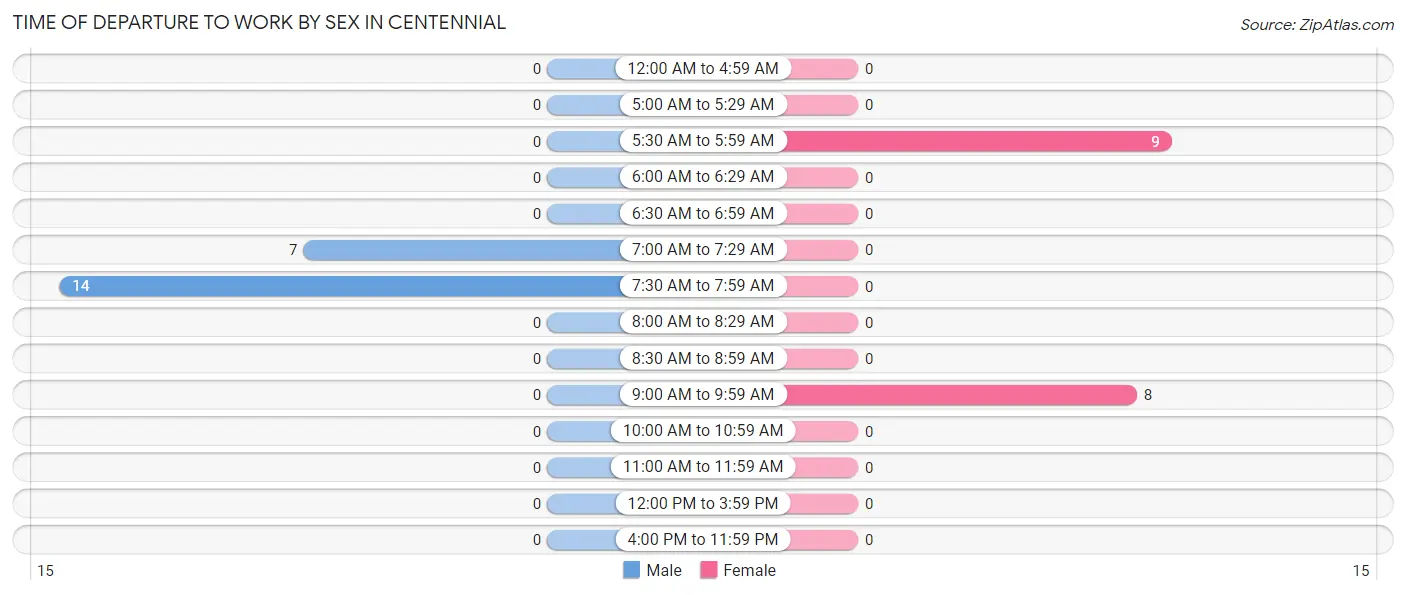
| Time of Departure | Male | Female |
| 12:00 AM to 4:59 AM | 0 (0.0%) | 0 (0.0%) |
| 5:00 AM to 5:29 AM | 0 (0.0%) | 0 (0.0%) |
| 5:30 AM to 5:59 AM | 0 (0.0%) | 9 (52.9%) |
| 6:00 AM to 6:29 AM | 0 (0.0%) | 0 (0.0%) |
| 6:30 AM to 6:59 AM | 0 (0.0%) | 0 (0.0%) |
| 7:00 AM to 7:29 AM | 7 (33.3%) | 0 (0.0%) |
| 7:30 AM to 7:59 AM | 14 (66.7%) | 0 (0.0%) |
| 8:00 AM to 8:29 AM | 0 (0.0%) | 0 (0.0%) |
| 8:30 AM to 8:59 AM | 0 (0.0%) | 0 (0.0%) |
| 9:00 AM to 9:59 AM | 0 (0.0%) | 8 (47.1%) |
| 10:00 AM to 10:59 AM | 0 (0.0%) | 0 (0.0%) |
| 11:00 AM to 11:59 AM | 0 (0.0%) | 0 (0.0%) |
| 12:00 PM to 3:59 PM | 0 (0.0%) | 0 (0.0%) |
| 4:00 PM to 11:59 PM | 0 (0.0%) | 0 (0.0%) |
| Total | 21 (100.0%) | 17 (100.0%) |
Housing Occupancy in Centennial
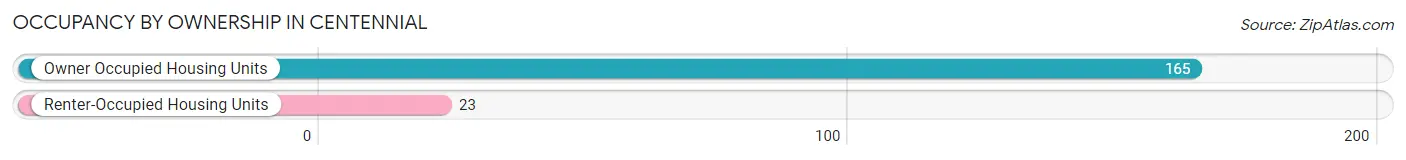
Occupancy by Ownership in Centennial
Of the total 188 dwellings in Centennial, owner-occupied units account for 165 (87.8%), while renter-occupied units make up 23 (12.2%).
| Occupancy | # Housing Units | % Housing Units |
| Owner Occupied Housing Units | 165 | 87.8% |
| Renter-Occupied Housing Units | 23 | 12.2% |
| Total Occupied Housing Units | 188 | 100.0% |
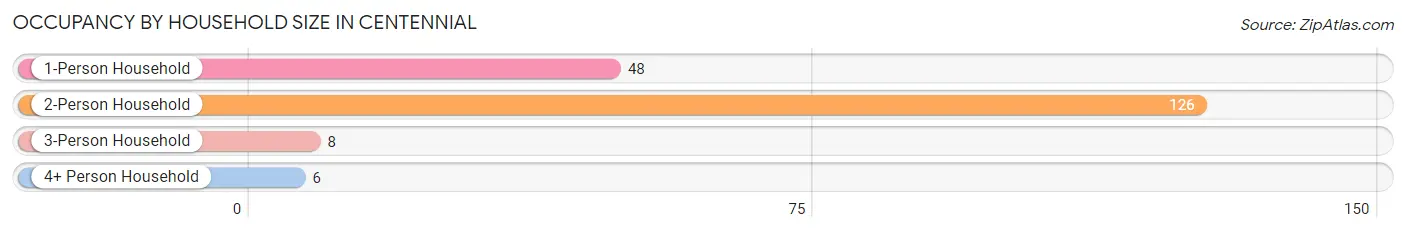
Occupancy by Household Size in Centennial
| Household Size | # Housing Units | % Housing Units |
| 1-Person Household | 48 | 25.5% |
| 2-Person Household | 126 | 67.0% |
| 3-Person Household | 8 | 4.3% |
| 4+ Person Household | 6 | 3.2% |
| Total Housing Units | 188 | 100.0% |
Occupancy by Ownership by Household Size in Centennial
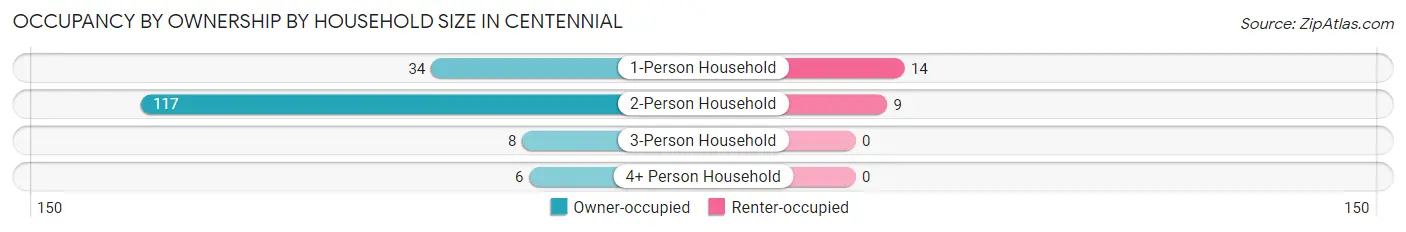
| Household Size | Owner-occupied | Renter-occupied |
| 1-Person Household | 34 (70.8%) | 14 (29.2%) |
| 2-Person Household | 117 (92.9%) | 9 (7.1%) |
| 3-Person Household | 8 (100.0%) | 0 (0.0%) |
| 4+ Person Household | 6 (100.0%) | 0 (0.0%) |
| Total Housing Units | 165 (87.8%) | 23 (12.2%) |
Occupancy by Educational Attainment in Centennial
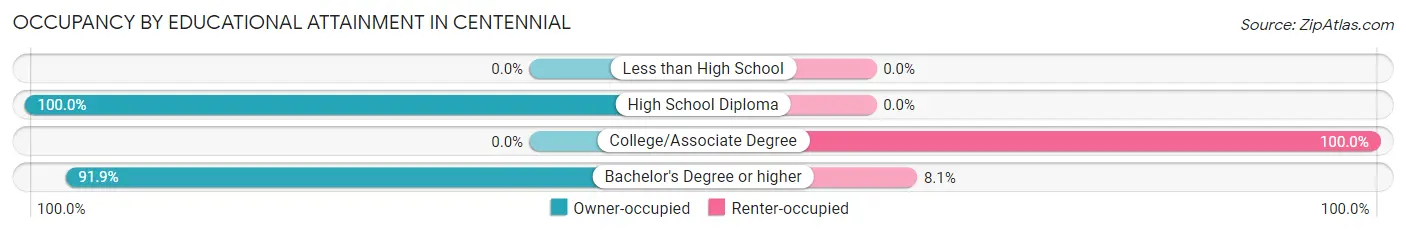
| Household Size | Owner-occupied | Renter-occupied |
| Less than High School | 0 (0.0%) | 0 (0.0%) |
| High School Diploma | 6 (100.0%) | 0 (0.0%) |
| College/Associate Degree | 0 (0.0%) | 9 (100.0%) |
| Bachelor's Degree or higher | 159 (91.9%) | 14 (8.1%) |
Occupancy by Age of Householder in Centennial
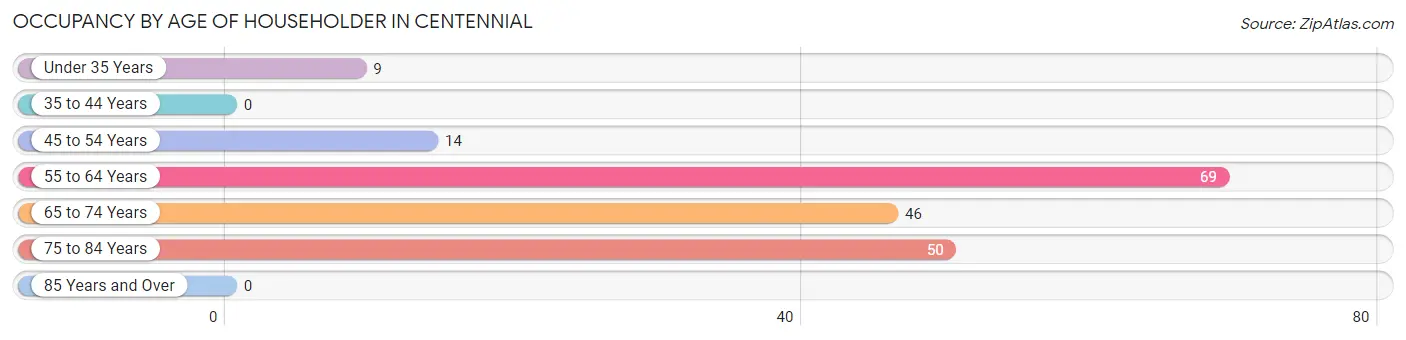
| Age Bracket | # Households | % Households |
| Under 35 Years | 9 | 4.8% |
| 35 to 44 Years | 0 | 0.0% |
| 45 to 54 Years | 14 | 7.4% |
| 55 to 64 Years | 69 | 36.7% |
| 65 to 74 Years | 46 | 24.5% |
| 75 to 84 Years | 50 | 26.6% |
| 85 Years and Over | 0 | 0.0% |
| Total | 188 | 100.0% |
Housing Finances in Centennial
Median Income by Occupancy in Centennial
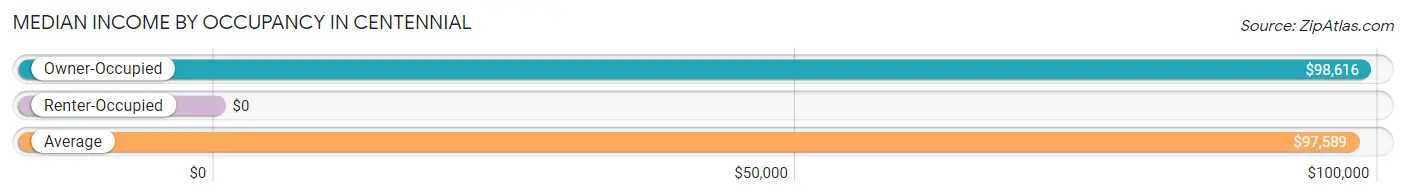
| Occupancy Type | # Households | Median Income |
| Owner-Occupied | 165 (87.8%) | $98,616 |
| Renter-Occupied | 23 (12.2%) | $0 |
| Average | 188 (100.0%) | $97,589 |
Occupancy by Householder Income Bracket in Centennial
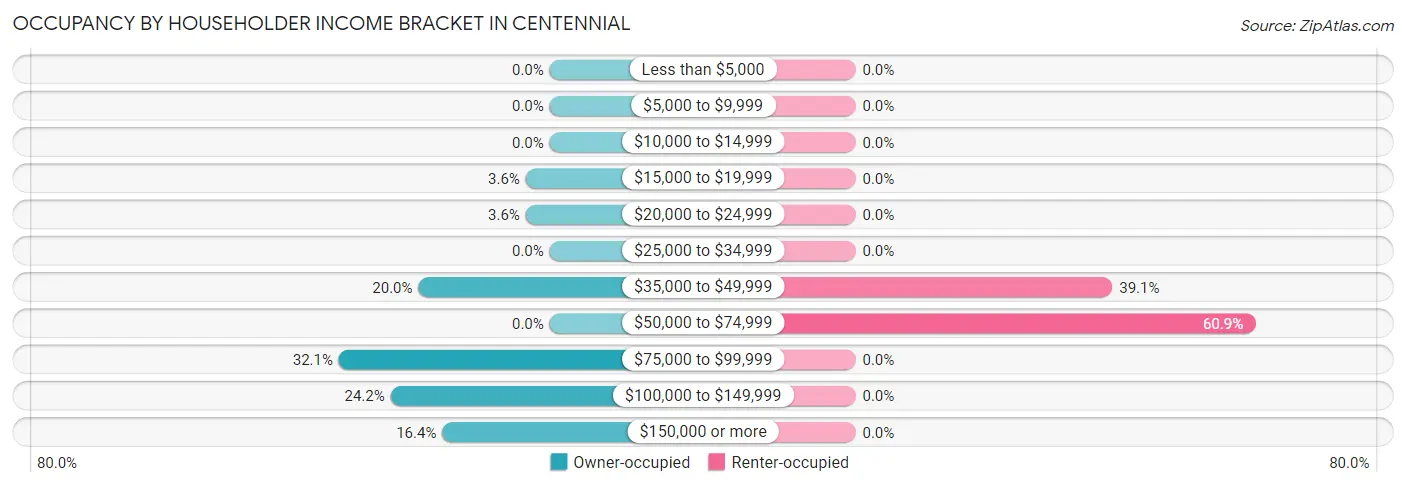
| Income Bracket | Owner-occupied | Renter-occupied |
| Less than $5,000 | 0 (0.0%) | 0 (0.0%) |
| $5,000 to $9,999 | 0 (0.0%) | 0 (0.0%) |
| $10,000 to $14,999 | 0 (0.0%) | 0 (0.0%) |
| $15,000 to $19,999 | 6 (3.6%) | 0 (0.0%) |
| $20,000 to $24,999 | 6 (3.6%) | 0 (0.0%) |
| $25,000 to $34,999 | 0 (0.0%) | 0 (0.0%) |
| $35,000 to $49,999 | 33 (20.0%) | 9 (39.1%) |
| $50,000 to $74,999 | 0 (0.0%) | 14 (60.9%) |
| $75,000 to $99,999 | 53 (32.1%) | 0 (0.0%) |
| $100,000 to $149,999 | 40 (24.2%) | 0 (0.0%) |
| $150,000 or more | 27 (16.4%) | 0 (0.0%) |
| Total | 165 (100.0%) | 23 (100.0%) |
Monthly Housing Cost Tiers in Centennial
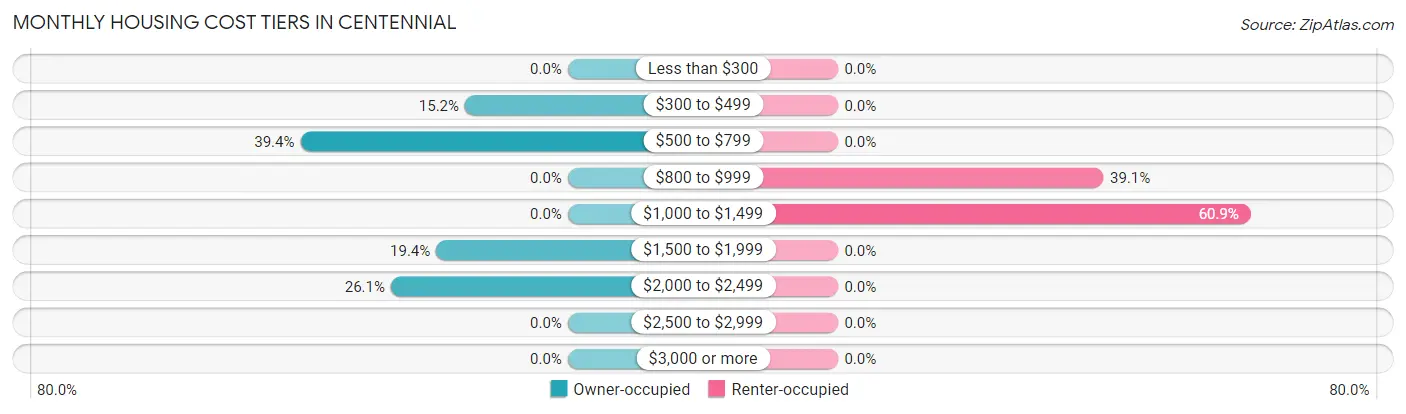
| Monthly Cost | Owner-occupied | Renter-occupied |
| Less than $300 | 0 (0.0%) | 0 (0.0%) |
| $300 to $499 | 25 (15.1%) | 0 (0.0%) |
| $500 to $799 | 65 (39.4%) | 0 (0.0%) |
| $800 to $999 | 0 (0.0%) | 9 (39.1%) |
| $1,000 to $1,499 | 0 (0.0%) | 14 (60.9%) |
| $1,500 to $1,999 | 32 (19.4%) | 0 (0.0%) |
| $2,000 to $2,499 | 43 (26.1%) | 0 (0.0%) |
| $2,500 to $2,999 | 0 (0.0%) | 0 (0.0%) |
| $3,000 or more | 0 (0.0%) | 0 (0.0%) |
| Total | 165 (100.0%) | 23 (100.0%) |
Physical Housing Characteristics in Centennial
Housing Structures in Centennial
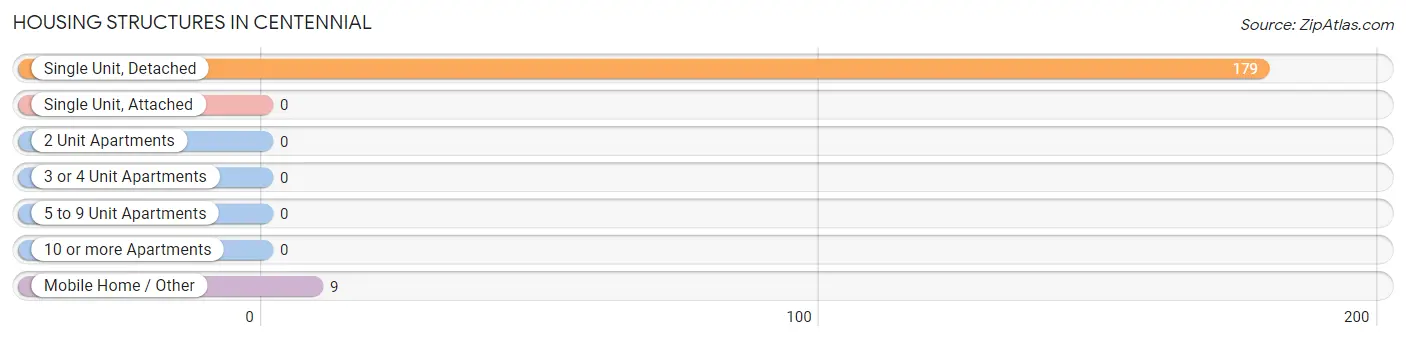
| Structure Type | # Housing Units | % Housing Units |
| Single Unit, Detached | 179 | 95.2% |
| Single Unit, Attached | 0 | 0.0% |
| 2 Unit Apartments | 0 | 0.0% |
| 3 or 4 Unit Apartments | 0 | 0.0% |
| 5 to 9 Unit Apartments | 0 | 0.0% |
| 10 or more Apartments | 0 | 0.0% |
| Mobile Home / Other | 9 | 4.8% |
| Total | 188 | 100.0% |
Housing Structures by Occupancy in Centennial
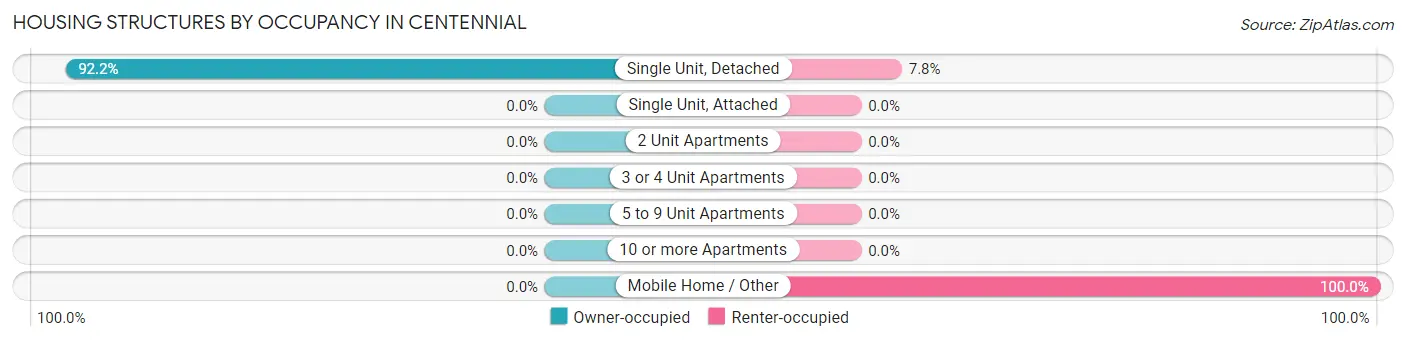
| Structure Type | Owner-occupied | Renter-occupied |
| Single Unit, Detached | 165 (92.2%) | 14 (7.8%) |
| Single Unit, Attached | 0 (0.0%) | 0 (0.0%) |
| 2 Unit Apartments | 0 (0.0%) | 0 (0.0%) |
| 3 or 4 Unit Apartments | 0 (0.0%) | 0 (0.0%) |
| 5 to 9 Unit Apartments | 0 (0.0%) | 0 (0.0%) |
| 10 or more Apartments | 0 (0.0%) | 0 (0.0%) |
| Mobile Home / Other | 0 (0.0%) | 9 (100.0%) |
| Total | 165 (87.8%) | 23 (12.2%) |
Housing Structures by Number of Rooms in Centennial
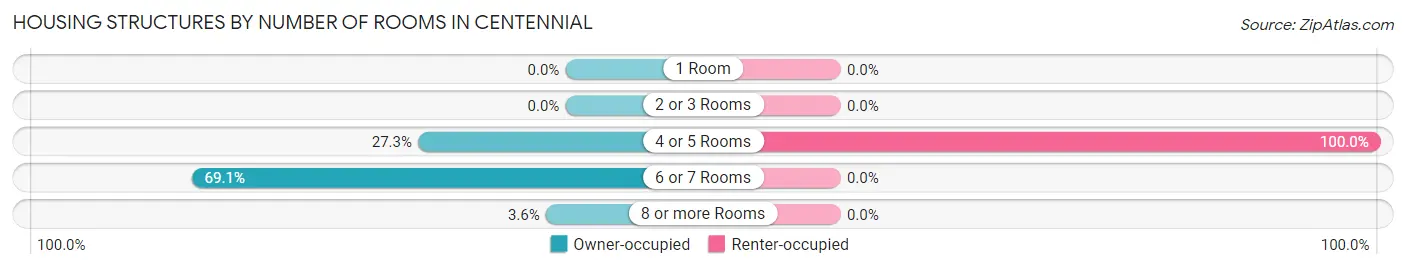
| Number of Rooms | Owner-occupied | Renter-occupied |
| 1 Room | 0 (0.0%) | 0 (0.0%) |
| 2 or 3 Rooms | 0 (0.0%) | 0 (0.0%) |
| 4 or 5 Rooms | 45 (27.3%) | 23 (100.0%) |
| 6 or 7 Rooms | 114 (69.1%) | 0 (0.0%) |
| 8 or more Rooms | 6 (3.6%) | 0 (0.0%) |
| Total | 165 (100.0%) | 23 (100.0%) |
Housing Structure by Heating Type in Centennial
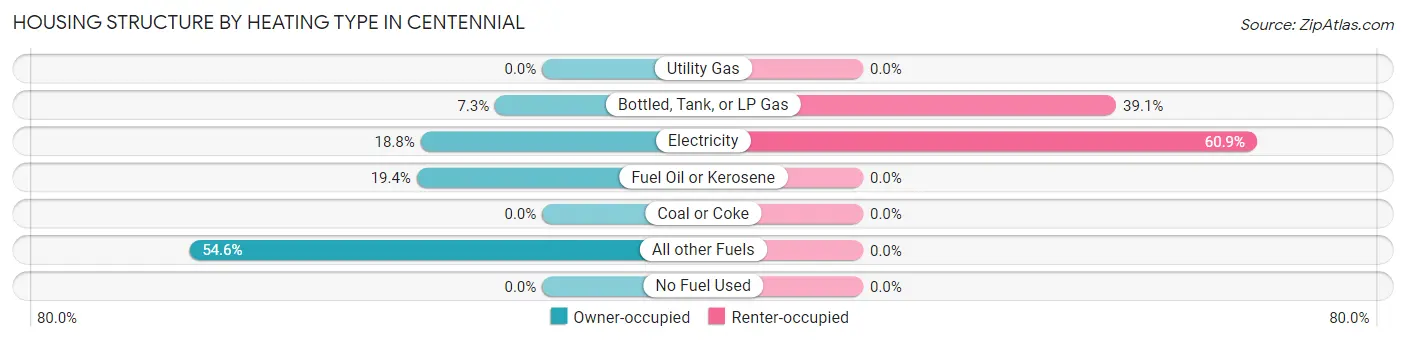
| Heating Type | Owner-occupied | Renter-occupied |
| Utility Gas | 0 (0.0%) | 0 (0.0%) |
| Bottled, Tank, or LP Gas | 12 (7.3%) | 9 (39.1%) |
| Electricity | 31 (18.8%) | 14 (60.9%) |
| Fuel Oil or Kerosene | 32 (19.4%) | 0 (0.0%) |
| Coal or Coke | 0 (0.0%) | 0 (0.0%) |
| All other Fuels | 90 (54.5%) | 0 (0.0%) |
| No Fuel Used | 0 (0.0%) | 0 (0.0%) |
| Total | 165 (100.0%) | 23 (100.0%) |
Household Vehicle Usage in Centennial
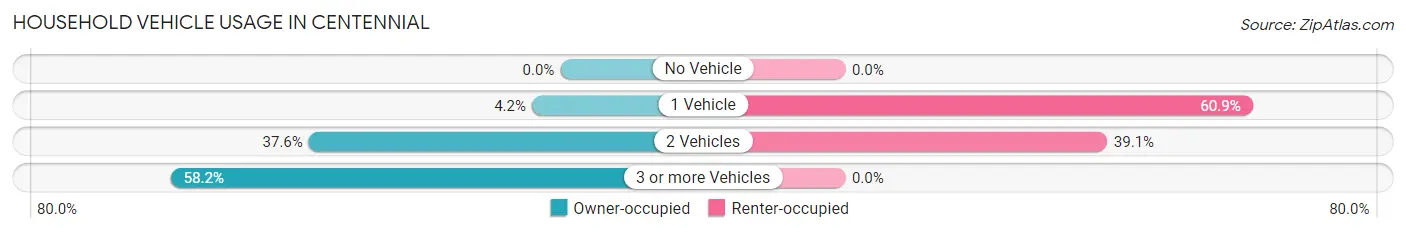
| Vehicles per Household | Owner-occupied | Renter-occupied |
| No Vehicle | 0 (0.0%) | 0 (0.0%) |
| 1 Vehicle | 7 (4.2%) | 14 (60.9%) |
| 2 Vehicles | 62 (37.6%) | 9 (39.1%) |
| 3 or more Vehicles | 96 (58.2%) | 0 (0.0%) |
| Total | 165 (100.0%) | 23 (100.0%) |
Real Estate & Mortgages in Centennial
Real Estate and Mortgage Overview in Centennial
| Characteristic | Without Mortgage | With Mortgage |
| Housing Units | 90 | 75 |
| Median Property Value | $542,600 | $0 |
| Median Household Income | $61,250 | $15 |
| Monthly Housing Costs | $600 | $0 |
| Real Estate Taxes | $2,170 | $0 |
Property Value by Mortgage Status in Centennial
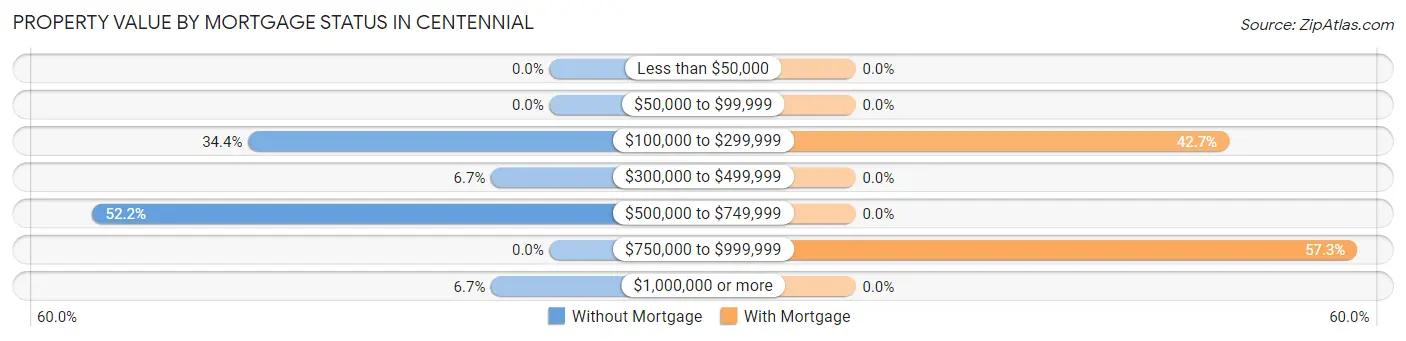
| Property Value | Without Mortgage | With Mortgage |
| Less than $50,000 | 0 (0.0%) | 0 (0.0%) |
| $50,000 to $99,999 | 0 (0.0%) | 0 (0.0%) |
| $100,000 to $299,999 | 31 (34.4%) | 32 (42.7%) |
| $300,000 to $499,999 | 6 (6.7%) | 0 (0.0%) |
| $500,000 to $749,999 | 47 (52.2%) | 0 (0.0%) |
| $750,000 to $999,999 | 0 (0.0%) | 43 (57.3%) |
| $1,000,000 or more | 6 (6.7%) | 0 (0.0%) |
| Total | 90 (100.0%) | 75 (100.0%) |
Household Income by Mortgage Status in Centennial
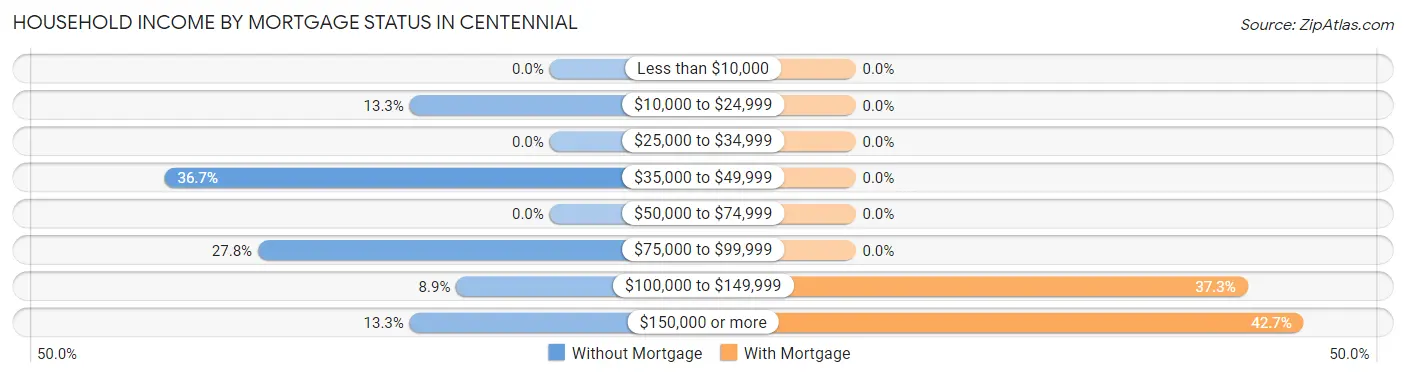
| Household Income | Without Mortgage | With Mortgage |
| Less than $10,000 | 0 (0.0%) | 0 (0.0%) |
| $10,000 to $24,999 | 12 (13.3%) | 0 (0.0%) |
| $25,000 to $34,999 | 0 (0.0%) | 0 (0.0%) |
| $35,000 to $49,999 | 33 (36.7%) | 0 (0.0%) |
| $50,000 to $74,999 | 0 (0.0%) | 0 (0.0%) |
| $75,000 to $99,999 | 25 (27.8%) | 0 (0.0%) |
| $100,000 to $149,999 | 8 (8.9%) | 28 (37.3%) |
| $150,000 or more | 12 (13.3%) | 32 (42.7%) |
| Total | 90 (100.0%) | 75 (100.0%) |
Property Value to Household Income Ratio in Centennial
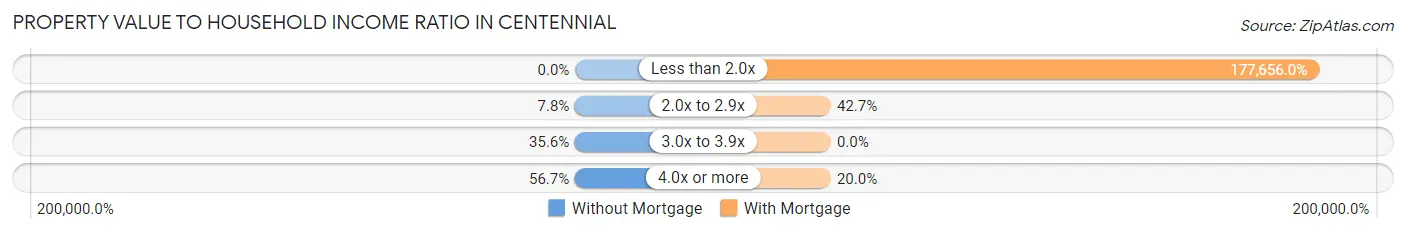
| Value-to-Income Ratio | Without Mortgage | With Mortgage |
| Less than 2.0x | 0 (0.0%) | 133,242 (177,656.0%) |
| 2.0x to 2.9x | 7 (7.8%) | 32 (42.7%) |
| 3.0x to 3.9x | 32 (35.6%) | 0 (0.0%) |
| 4.0x or more | 51 (56.7%) | 15 (20.0%) |
| Total | 90 (100.0%) | 75 (100.0%) |
Real Estate Taxes by Mortgage Status in Centennial
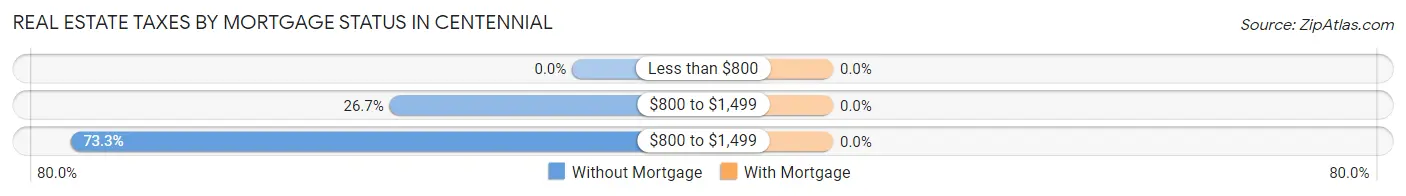
| Property Taxes | Without Mortgage | With Mortgage |
| Less than $800 | 0 (0.0%) | 0 (0.0%) |
| $800 to $1,499 | 24 (26.7%) | 0 (0.0%) |
| $800 to $1,499 | 66 (73.3%) | 0 (0.0%) |
| Total | 90 (100.0%) | 75 (100.0%) |
Health & Disability in Centennial
Health Insurance Coverage by Age in Centennial
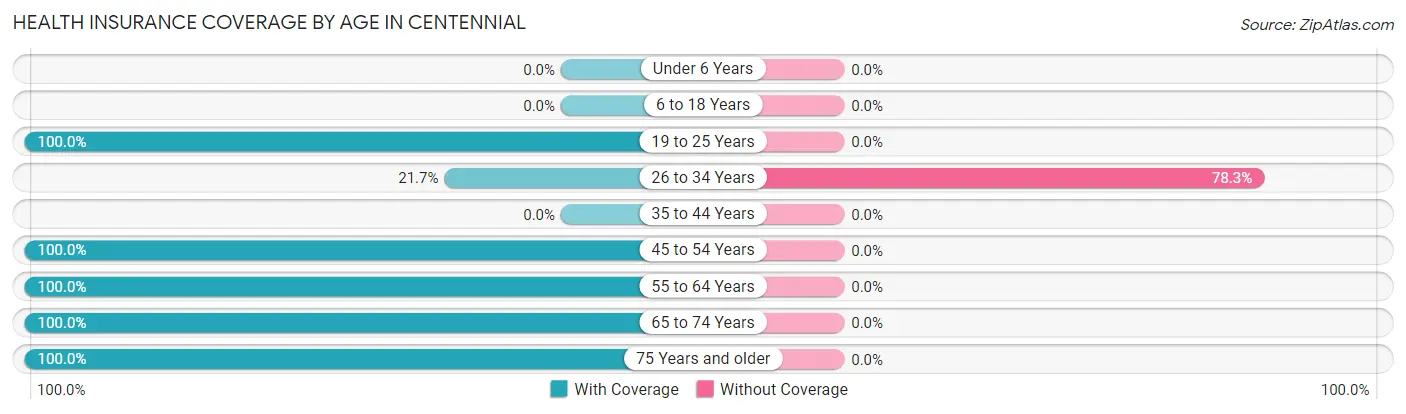
| Age Bracket | With Coverage | Without Coverage |
| Under 6 Years | 0 (0.0%) | 0 (0.0%) |
| 6 to 18 Years | 0 (0.0%) | 0 (0.0%) |
| 19 to 25 Years | 7 (100.0%) | 0 (0.0%) |
| 26 to 34 Years | 5 (21.7%) | 18 (78.3%) |
| 35 to 44 Years | 0 (0.0%) | 0 (0.0%) |
| 45 to 54 Years | 25 (100.0%) | 0 (0.0%) |
| 55 to 64 Years | 138 (100.0%) | 0 (0.0%) |
| 65 to 74 Years | 52 (100.0%) | 0 (0.0%) |
| 75 Years and older | 100 (100.0%) | 0 (0.0%) |
| Total | 327 (94.8%) | 18 (5.2%) |
Health Insurance Coverage by Citizenship Status in Centennial
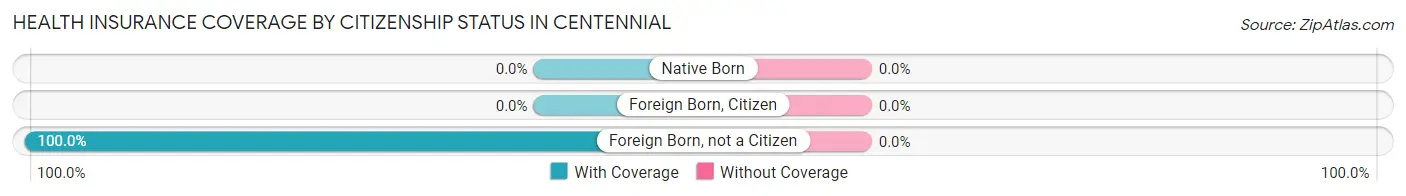
| Citizenship Status | With Coverage | Without Coverage |
| Native Born | 0 (0.0%) | 0 (0.0%) |
| Foreign Born, Citizen | 0 (0.0%) | 0 (0.0%) |
| Foreign Born, not a Citizen | 7 (100.0%) | 0 (0.0%) |
Health Insurance Coverage by Household Income in Centennial
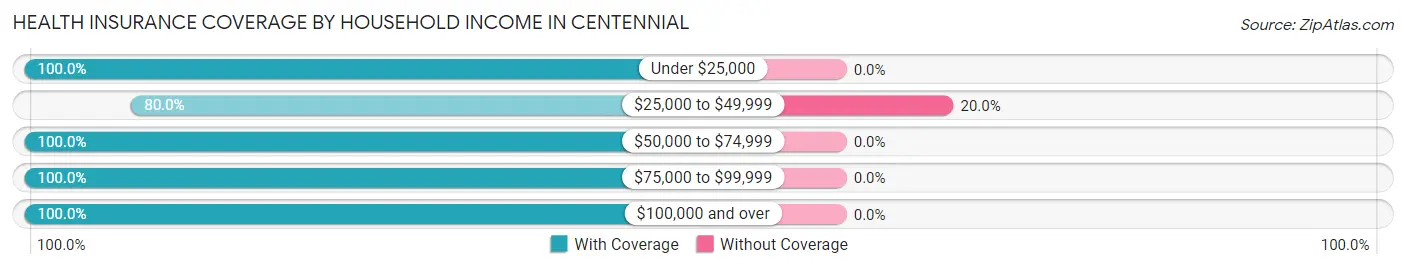
| Household Income | With Coverage | Without Coverage |
| Under $25,000 | 18 (100.0%) | 0 (0.0%) |
| $25,000 to $49,999 | 72 (80.0%) | 18 (20.0%) |
| $50,000 to $74,999 | 14 (100.0%) | 0 (0.0%) |
| $75,000 to $99,999 | 74 (100.0%) | 0 (0.0%) |
| $100,000 and over | 149 (100.0%) | 0 (0.0%) |
Public vs Private Health Insurance Coverage by Age in Centennial
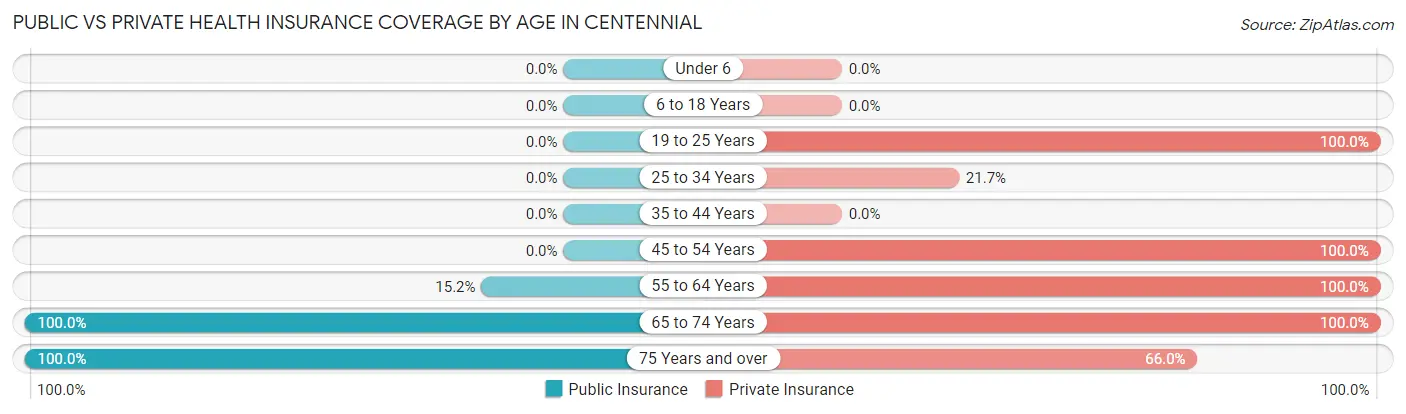
| Age Bracket | Public Insurance | Private Insurance |
| Under 6 | 0 (0.0%) | 0 (0.0%) |
| 6 to 18 Years | 0 (0.0%) | 0 (0.0%) |
| 19 to 25 Years | 0 (0.0%) | 7 (100.0%) |
| 25 to 34 Years | 0 (0.0%) | 5 (21.7%) |
| 35 to 44 Years | 0 (0.0%) | 0 (0.0%) |
| 45 to 54 Years | 0 (0.0%) | 25 (100.0%) |
| 55 to 64 Years | 21 (15.2%) | 138 (100.0%) |
| 65 to 74 Years | 52 (100.0%) | 52 (100.0%) |
| 75 Years and over | 100 (100.0%) | 66 (66.0%) |
| Total | 173 (50.1%) | 293 (84.9%) |
Disability Status by Sex by Age in Centennial
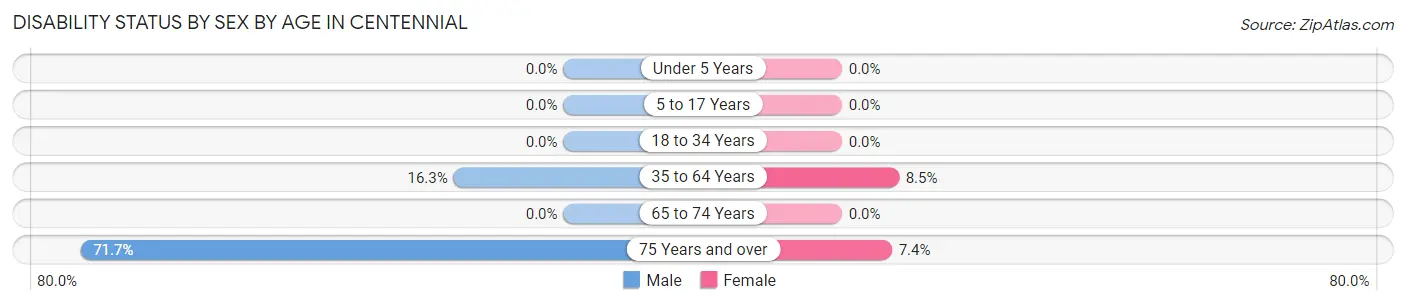
| Age Bracket | Male | Female |
| Under 5 Years | 0 (0.0%) | 0 (0.0%) |
| 5 to 17 Years | 0 (0.0%) | 0 (0.0%) |
| 18 to 34 Years | 0 (0.0%) | 0 (0.0%) |
| 35 to 64 Years | 15 (16.3%) | 6 (8.5%) |
| 65 to 74 Years | 0 (0.0%) | 0 (0.0%) |
| 75 Years and over | 33 (71.7%) | 4 (7.4%) |
Disability Class by Sex by Age in Centennial
Disability Class: Hearing Difficulty
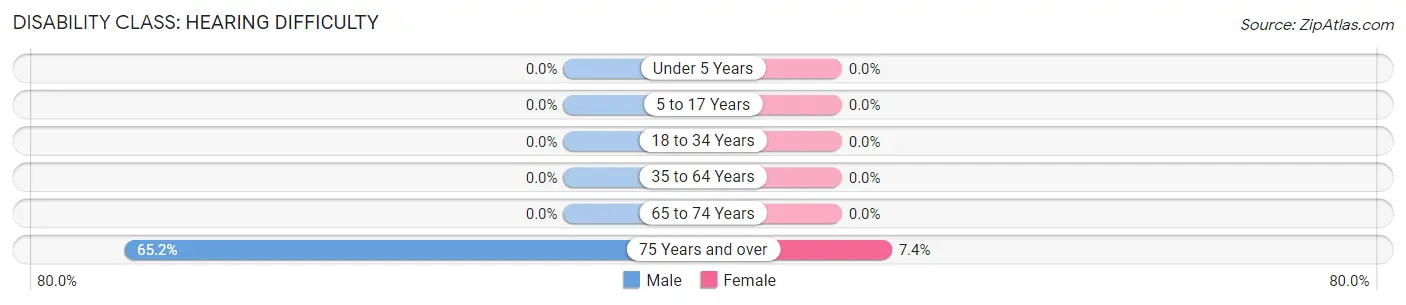
| Age Bracket | Male | Female |
| Under 5 Years | 0 (0.0%) | 0 (0.0%) |
| 5 to 17 Years | 0 (0.0%) | 0 (0.0%) |
| 18 to 34 Years | 0 (0.0%) | 0 (0.0%) |
| 35 to 64 Years | 0 (0.0%) | 0 (0.0%) |
| 65 to 74 Years | 0 (0.0%) | 0 (0.0%) |
| 75 Years and over | 30 (65.2%) | 4 (7.4%) |
Disability Class: Vision Difficulty
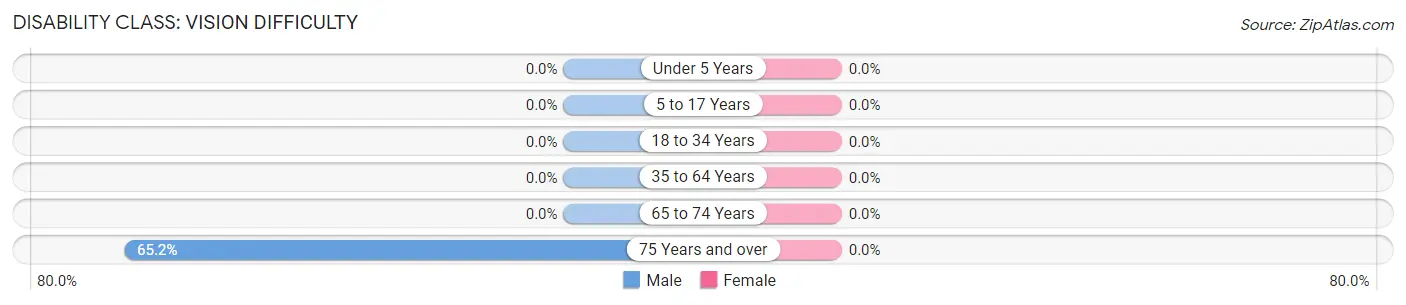
| Age Bracket | Male | Female |
| Under 5 Years | 0 (0.0%) | 0 (0.0%) |
| 5 to 17 Years | 0 (0.0%) | 0 (0.0%) |
| 18 to 34 Years | 0 (0.0%) | 0 (0.0%) |
| 35 to 64 Years | 0 (0.0%) | 0 (0.0%) |
| 65 to 74 Years | 0 (0.0%) | 0 (0.0%) |
| 75 Years and over | 30 (65.2%) | 0 (0.0%) |
Disability Class: Cognitive Difficulty
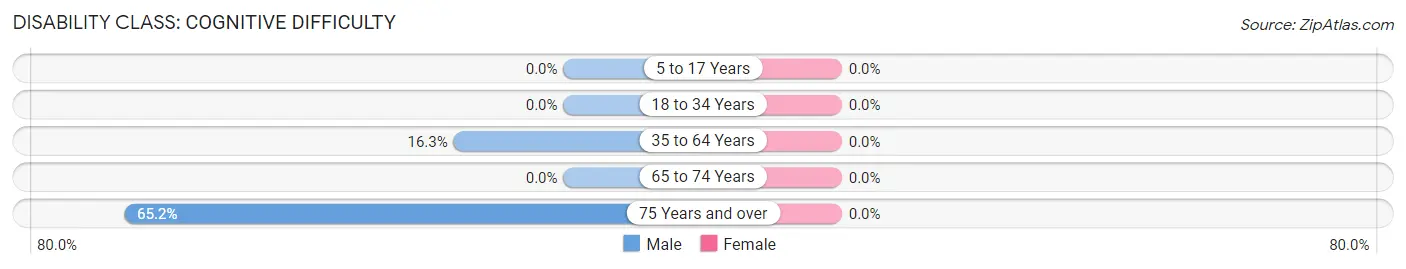
| Age Bracket | Male | Female |
| 5 to 17 Years | 0 (0.0%) | 0 (0.0%) |
| 18 to 34 Years | 0 (0.0%) | 0 (0.0%) |
| 35 to 64 Years | 15 (16.3%) | 0 (0.0%) |
| 65 to 74 Years | 0 (0.0%) | 0 (0.0%) |
| 75 Years and over | 30 (65.2%) | 0 (0.0%) |
Disability Class: Ambulatory Difficulty
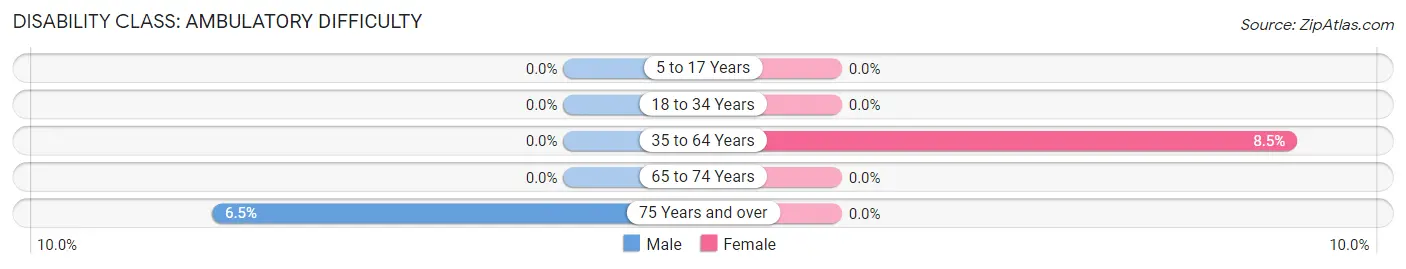
| Age Bracket | Male | Female |
| 5 to 17 Years | 0 (0.0%) | 0 (0.0%) |
| 18 to 34 Years | 0 (0.0%) | 0 (0.0%) |
| 35 to 64 Years | 0 (0.0%) | 6 (8.5%) |
| 65 to 74 Years | 0 (0.0%) | 0 (0.0%) |
| 75 Years and over | 3 (6.5%) | 0 (0.0%) |
Disability Class: Self-Care Difficulty
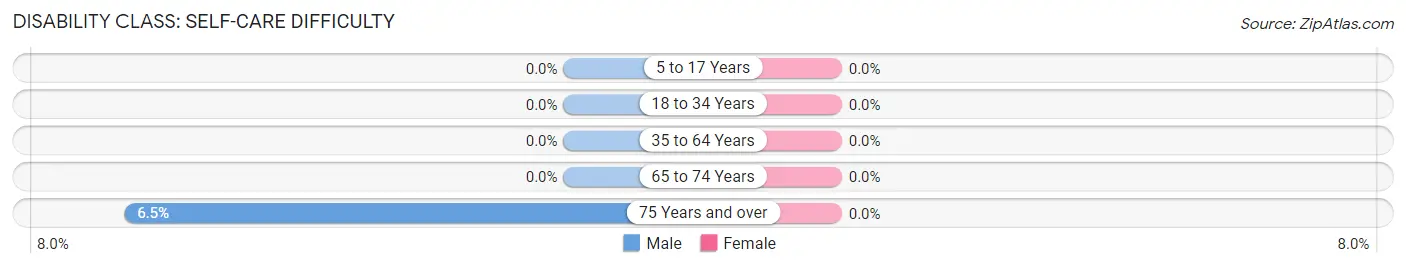
| Age Bracket | Male | Female |
| 5 to 17 Years | 0 (0.0%) | 0 (0.0%) |
| 18 to 34 Years | 0 (0.0%) | 0 (0.0%) |
| 35 to 64 Years | 0 (0.0%) | 0 (0.0%) |
| 65 to 74 Years | 0 (0.0%) | 0 (0.0%) |
| 75 Years and over | 3 (6.5%) | 0 (0.0%) |
Technology Access in Centennial
Computing Device Access in Centennial
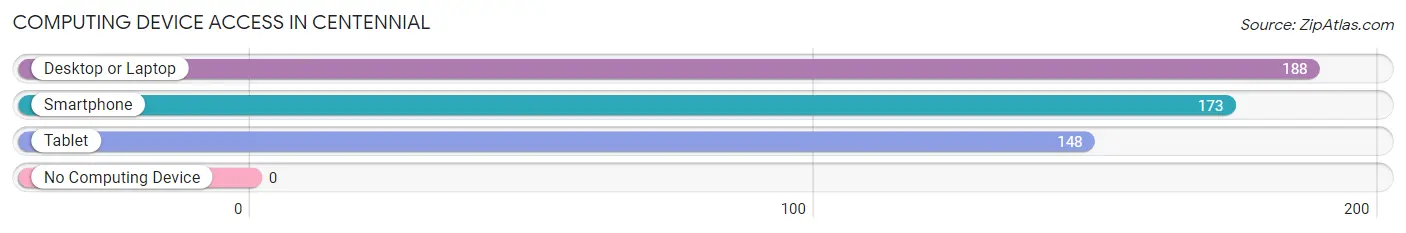
| Device Type | # Households | % Households |
| Desktop or Laptop | 188 | 100.0% |
| Smartphone | 173 | 92.0% |
| Tablet | 148 | 78.7% |
| No Computing Device | 0 | 0.0% |
| Total | 188 | 100.0% |
Internet Access in Centennial
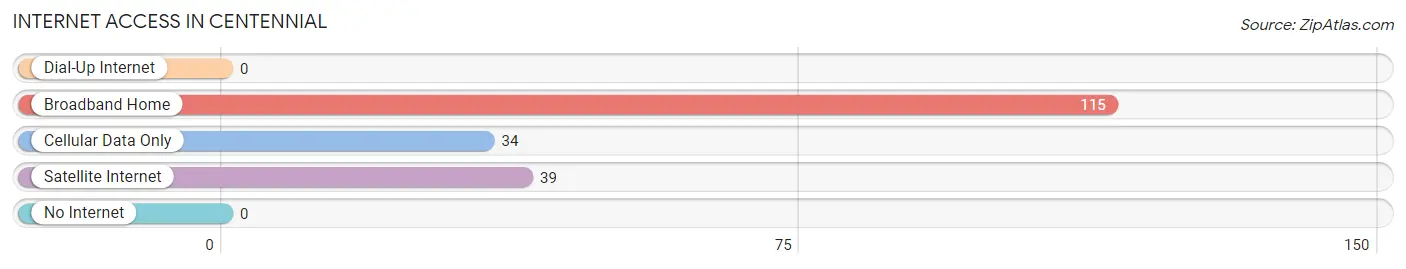
| Internet Type | # Households | % Households |
| Dial-Up Internet | 0 | 0.0% |
| Broadband Home | 115 | 61.2% |
| Cellular Data Only | 34 | 18.1% |
| Satellite Internet | 39 | 20.7% |
| No Internet | 0 | 0.0% |
| Total | 188 | 100.0% |
Centennial Summary
Centennial, Wyoming is a small town located in the southeastern corner of the state. It is situated in the foothills of the Rocky Mountains, and is surrounded by the Medicine Bow National Forest. The town was founded in 1876, and is the oldest incorporated town in Wyoming. The town has a population of approximately 1,000 people, and is the county seat of Carbon County.
Geography
Centennial is located in the southeastern corner of Wyoming, in the foothills of the Rocky Mountains. The town is situated at an elevation of 6,400 feet, and is surrounded by the Medicine Bow National Forest. The town is located on the banks of the North Platte River, and is approximately 30 miles from the Colorado border. The town is located in a semi-arid climate, with hot summers and cold winters.
Economy
The economy of Centennial is largely based on agriculture and tourism. The town is home to several small farms, which produce hay, wheat, and other crops. The town is also home to several small businesses, including restaurants, shops, and other services. Tourism is also an important part of the local economy, as the town is located near several popular outdoor recreation areas, including the Medicine Bow National Forest and the North Platte River.
Demographics
As of the 2010 census, the population of Centennial was 1,000 people. The racial makeup of the town was 97.2% White, 0.7% Native American, 0.3% Asian, 0.2% from other races, and 1.6% from two or more races. The median household income was $41,250, and the median family income was $50,000. The per capita income was $20,000.
History
Centennial was founded in 1876, and is the oldest incorporated town in Wyoming. The town was originally established as a trading post for settlers traveling along the Oregon Trail. The town was named after the centennial anniversary of the United States Declaration of Independence. In the late 19th century, the town was a major stop on the Union Pacific Railroad, and was a popular destination for travelers. In the early 20th century, the town was a major center for coal mining, and the town's population grew rapidly. In the late 20th century, the town's economy shifted to agriculture and tourism, and the population began to decline.
Today, Centennial is a small, rural town with a population of approximately 1,000 people. The town is home to several small businesses, and is a popular destination for outdoor recreation. The town is also home to several historic sites, including the Centennial Museum and the Union Pacific Railroad Depot.
Common Questions
What is Per Capita Income in Centennial?
Per Capita income in Centennial is $51,760.
What is the Median Family Income in Centennial?
Median Family Income in Centennial is $133,906.
What is the Median Household income in Centennial?
Median Household Income in Centennial is $97,589.
What is Income or Wage Gap in Centennial?
Income or Wage Gap in Centennial is 69.5%.
Women in Centennial earn 30.5 cents for every dollar earned by a man.
What is Inequality or Gini Index in Centennial?
Inequality or Gini Index in Centennial is 0.31.
What is the Total Population of Centennial?
Total Population of Centennial is 345.
What is the Total Male Population of Centennial?
Total Male Population of Centennial is 170.
What is the Total Female Population of Centennial?
Total Female Population of Centennial is 175.
What is the Ratio of Males per 100 Females in Centennial?
There are 97.14 Males per 100 Females in Centennial.
What is the Ratio of Females per 100 Males in Centennial?
There are 102.94 Females per 100 Males in Centennial.
What is the Median Population Age in Centennial?
Median Population Age in Centennial is 63.9 Years.
What is the Average Family Size in Centennial
Average Family Size in Centennial is 2.1 People.
What is the Average Household Size in Centennial
Average Household Size in Centennial is 1.8 People.
How Large is the Labor Force in Centennial?
There are 98 People in the Labor Forcein in Centennial.
What is the Percentage of People in the Labor Force in Centennial?
28.4% of People are in the Labor Force in Centennial.