Arapahoe, WY Map & Demographics
Arapahoe Map
Arapahoe Overview
$23,312
PER CAPITA INCOME
$64,432
AVG FAMILY INCOME
$64,886
AVG HOUSEHOLD INCOME
17.0%
WAGE / INCOME GAP [ % ]
83.0¢/ $1
WAGE / INCOME GAP [ $ ]
$9,059
FAMILY INCOME DEFICIT
0.46
INEQUALITY / GINI INDEX
1,596
TOTAL POPULATION
877
MALE POPULATION
719
FEMALE POPULATION
121.97
MALES / 100 FEMALES
81.98
FEMALES / 100 MALES
32.5
MEDIAN AGE
4.3
AVG FAMILY SIZE
3.9
AVG HOUSEHOLD SIZE
716
LABOR FORCE [ PEOPLE ]
58.4%
PERCENT IN LABOR FORCE
18.6%
UNEMPLOYMENT RATE
Arapahoe Zip Codes
Arapahoe Area Codes
Income in Arapahoe
Income Overview in Arapahoe
Per Capita Income in Arapahoe is $23,312, while median incomes of families and households are $64,432 and $64,886 respectively.
| Characteristic | Number | Measure |
| Per Capita Income | 1,596 | $23,312 |
| Median Family Income | 329 | $64,432 |
| Mean Family Income | 329 | $87,660 |
| Median Household Income | 403 | $64,886 |
| Mean Household Income | 403 | $85,705 |
| Income Deficit | 329 | $9,059 |
| Wage / Income Gap (%) | 1,596 | 17.00% |
| Wage / Income Gap ($) | 1,596 | 83.00¢ per $1 |
| Gini / Inequality Index | 1,596 | 0.46 |
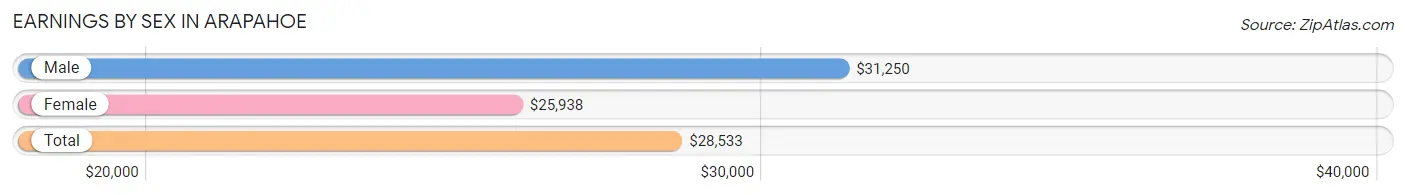
Earnings by Sex in Arapahoe
Average Earnings in Arapahoe are $28,533, $31,250 for men and $25,938 for women, a difference of 17.0%.
| Sex | Number | Average Earnings |
| Male | 406 (57.3%) | $31,250 |
| Female | 303 (42.7%) | $25,938 |
| Total | 709 (100.0%) | $28,533 |
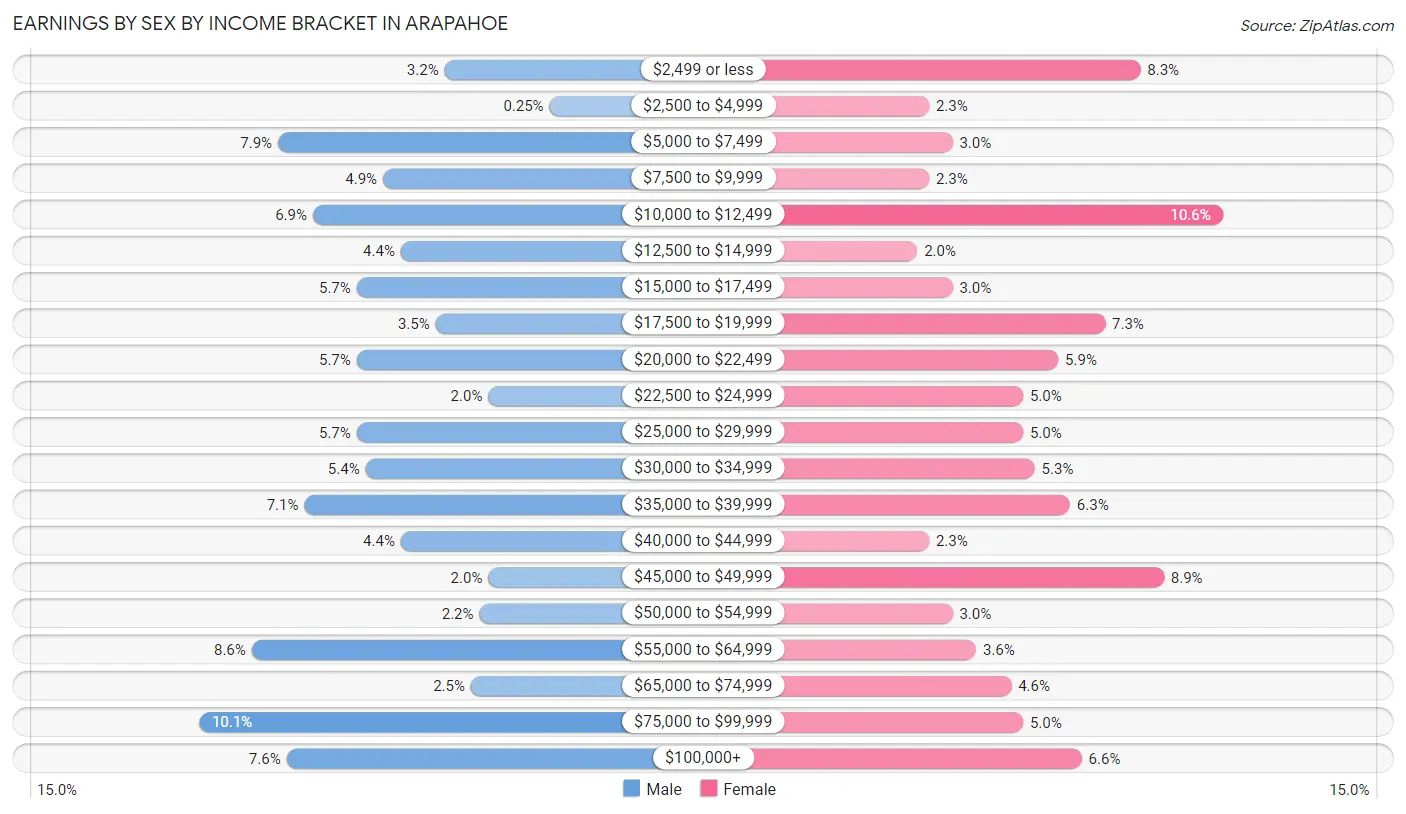
Earnings by Sex by Income Bracket in Arapahoe
The most common earnings brackets in Arapahoe are $75,000 to $99,999 for men (41 | 10.1%) and $10,000 to $12,499 for women (32 | 10.6%).
| Income | Male | Female |
| $2,499 or less | 13 (3.2%) | 25 (8.3%) |
| $2,500 to $4,999 | 1 (0.3%) | 7 (2.3%) |
| $5,000 to $7,499 | 32 (7.9%) | 9 (3.0%) |
| $7,500 to $9,999 | 20 (4.9%) | 7 (2.3%) |
| $10,000 to $12,499 | 28 (6.9%) | 32 (10.6%) |
| $12,500 to $14,999 | 18 (4.4%) | 6 (2.0%) |
| $15,000 to $17,499 | 23 (5.7%) | 9 (3.0%) |
| $17,500 to $19,999 | 14 (3.5%) | 22 (7.3%) |
| $20,000 to $22,499 | 23 (5.7%) | 18 (5.9%) |
| $22,500 to $24,999 | 8 (2.0%) | 15 (5.0%) |
| $25,000 to $29,999 | 23 (5.7%) | 15 (5.0%) |
| $30,000 to $34,999 | 22 (5.4%) | 16 (5.3%) |
| $35,000 to $39,999 | 29 (7.1%) | 19 (6.3%) |
| $40,000 to $44,999 | 18 (4.4%) | 7 (2.3%) |
| $45,000 to $49,999 | 8 (2.0%) | 27 (8.9%) |
| $50,000 to $54,999 | 9 (2.2%) | 9 (3.0%) |
| $55,000 to $64,999 | 35 (8.6%) | 11 (3.6%) |
| $65,000 to $74,999 | 10 (2.5%) | 14 (4.6%) |
| $75,000 to $99,999 | 41 (10.1%) | 15 (5.0%) |
| $100,000+ | 31 (7.6%) | 20 (6.6%) |
| Total | 406 (100.0%) | 303 (100.0%) |
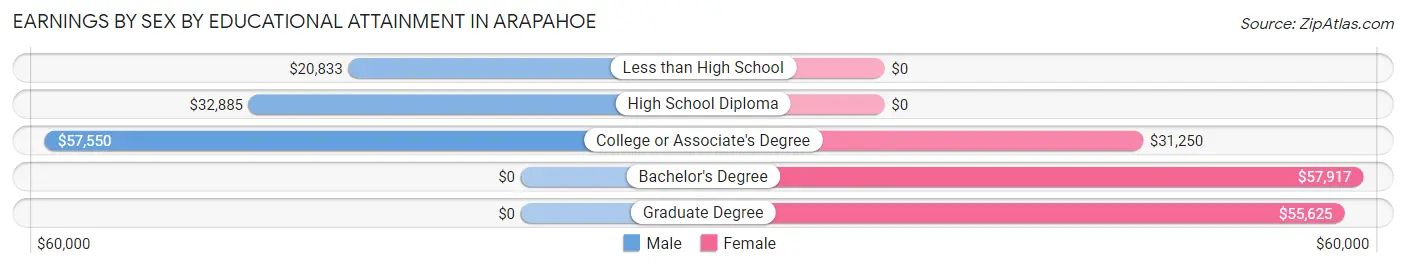
Earnings by Sex by Educational Attainment in Arapahoe
Average earnings in Arapahoe are $38,542 for men and $34,219 for women, a difference of 11.2%. Men with an educational attainment of college or associate's degree enjoy the highest average annual earnings of $57,550, while those with less than high school education earn the least with $20,833. Women with an educational attainment of bachelor's degree earn the most with the average annual earnings of $57,917, while those with college or associate's degree education have the smallest earnings of $31,250.
| Educational Attainment | Male Income | Female Income |
| Less than High School | $20,833 | $0 |
| High School Diploma | $32,885 | $0 |
| College or Associate's Degree | $57,550 | $31,250 |
| Bachelor's Degree | - | - |
| Graduate Degree | - | - |
| Total | $38,542 | $34,219 |
Family Income in Arapahoe
Family Income Brackets in Arapahoe
According to the Arapahoe family income data, there are 59 families falling into the $50,000 to $74,999 income range, which is the most common income bracket and makes up 17.9% of all families. Conversely, the less than $10,000 income bracket is the least frequent group with only 4 families (1.2%) belonging to this category.
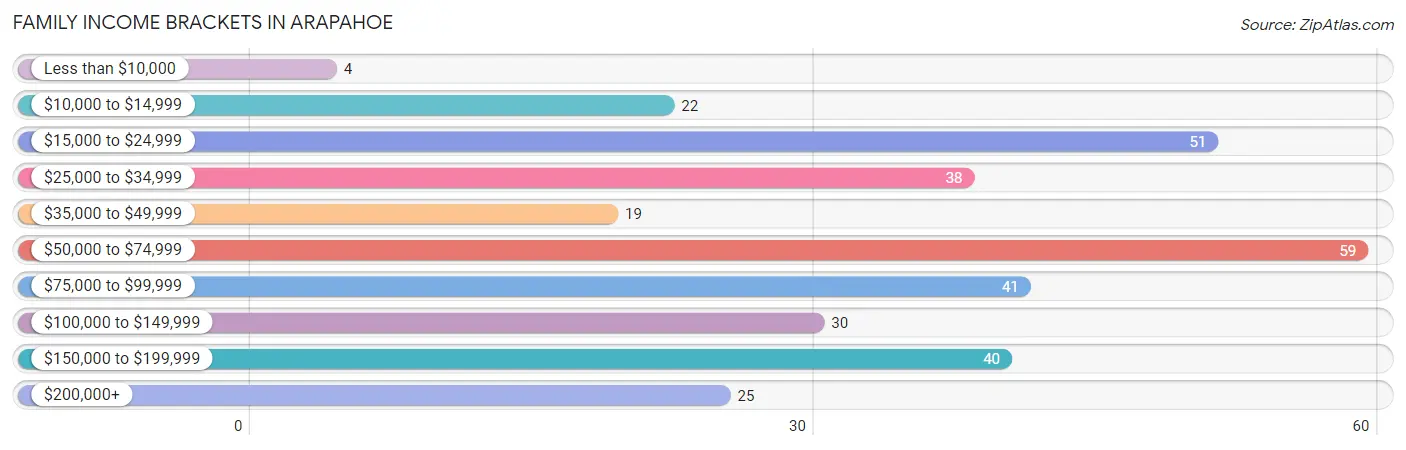
| Income Bracket | # Families | % Families |
| Less than $10,000 | 4 | 1.2% |
| $10,000 to $14,999 | 22 | 6.7% |
| $15,000 to $24,999 | 51 | 15.5% |
| $25,000 to $34,999 | 38 | 11.6% |
| $35,000 to $49,999 | 19 | 5.8% |
| $50,000 to $74,999 | 59 | 17.9% |
| $75,000 to $99,999 | 41 | 12.5% |
| $100,000 to $149,999 | 30 | 9.1% |
| $150,000 to $199,999 | 40 | 12.2% |
| $200,000+ | 25 | 7.6% |
Family Income by Famaliy Size in Arapahoe
6-person families (39 | 11.8%) account for the highest median family income in Arapahoe with $180,550 per family, while 2-person families (82 | 24.9%) have the highest median income of $35,250 per family member.
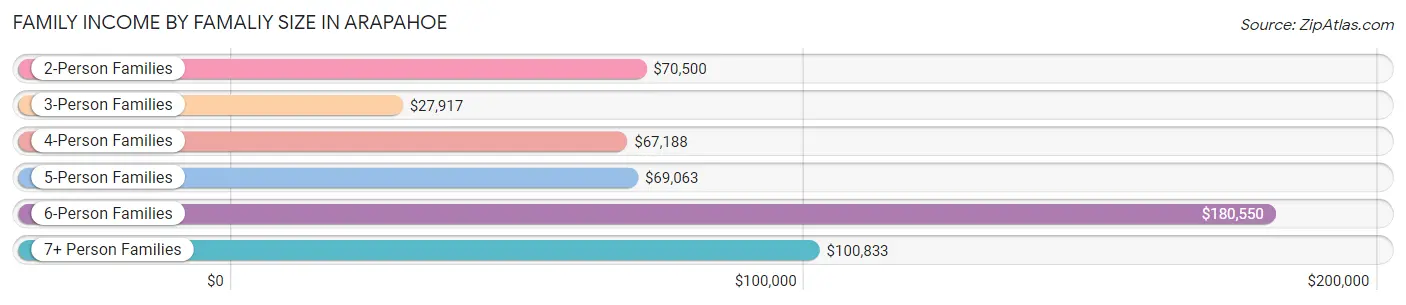
| Income Bracket | # Families | Median Income |
| 2-Person Families | 82 (24.9%) | $70,500 |
| 3-Person Families | 88 (26.8%) | $27,917 |
| 4-Person Families | 57 (17.3%) | $67,188 |
| 5-Person Families | 33 (10.0%) | $69,063 |
| 6-Person Families | 39 (11.8%) | $180,550 |
| 7+ Person Families | 30 (9.1%) | $100,833 |
| Total | 329 (100.0%) | $64,432 |
Family Income by Number of Earners in Arapahoe
The median family income in Arapahoe is $64,432, with families comprising 3+ earners (73) having the highest median family income of $180,050, while families with no earners (68) have the lowest median family income of $22,941, accounting for 22.2% and 20.7% of families, respectively.
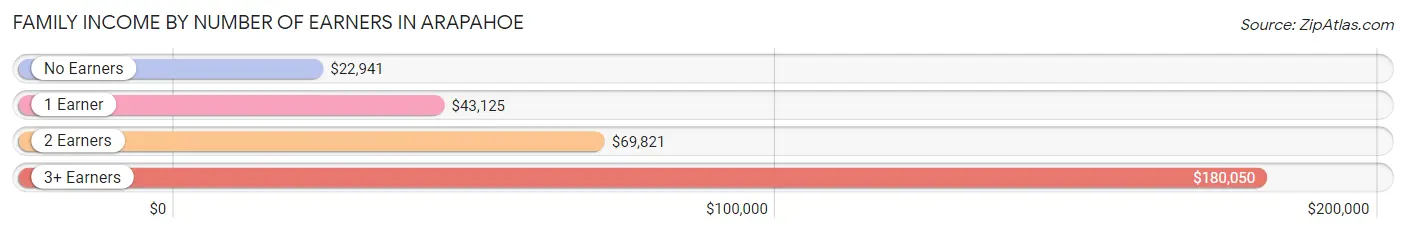
| Number of Earners | # Families | Median Income |
| No Earners | 68 (20.7%) | $22,941 |
| 1 Earner | 87 (26.4%) | $43,125 |
| 2 Earners | 101 (30.7%) | $69,821 |
| 3+ Earners | 73 (22.2%) | $180,050 |
| Total | 329 (100.0%) | $64,432 |
Household Income in Arapahoe
Household Income Brackets in Arapahoe
With 62 households falling in the category, the $50,000 to $74,999 income range is the most frequent in Arapahoe, accounting for 15.4% of all households. In contrast, only 10 households (2.5%) fall into the less than $10,000 income bracket, making it the least populous group.
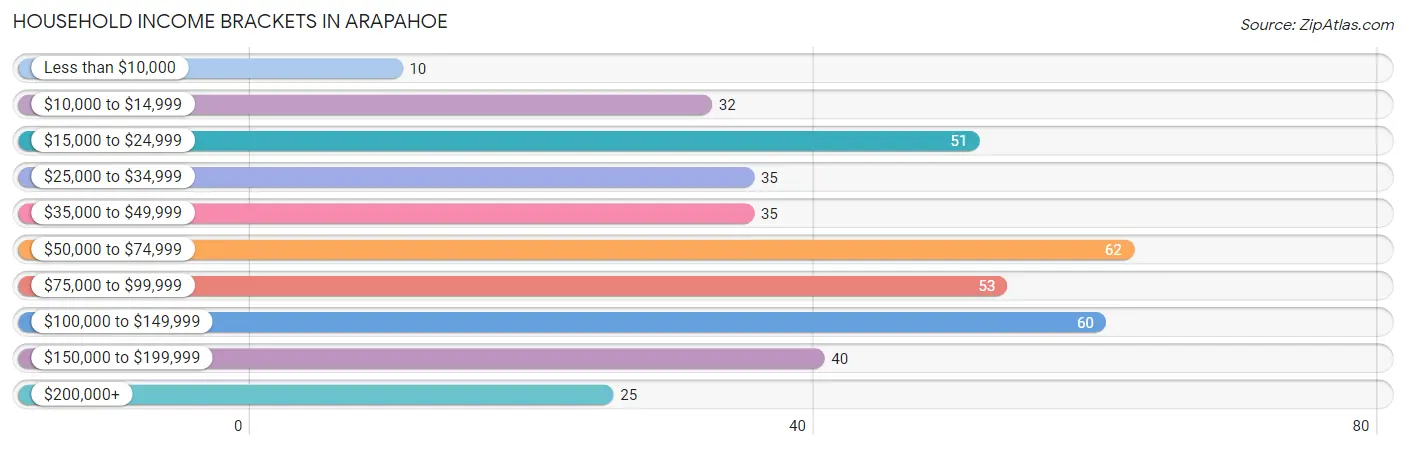
| Income Bracket | # Households | % Households |
| Less than $10,000 | 10 | 2.5% |
| $10,000 to $14,999 | 32 | 7.9% |
| $15,000 to $24,999 | 51 | 12.7% |
| $25,000 to $34,999 | 35 | 8.7% |
| $35,000 to $49,999 | 35 | 8.7% |
| $50,000 to $74,999 | 62 | 15.4% |
| $75,000 to $99,999 | 53 | 13.2% |
| $100,000 to $149,999 | 60 | 14.9% |
| $150,000 to $199,999 | 40 | 9.9% |
| $200,000+ | 25 | 6.2% |
Household Income by Householder Age in Arapahoe
The median household income in Arapahoe is $64,886, with the highest median household income of $72,250 found in the 65+ years age bracket for the primary householder. A total of 137 households (34.0%) fall into this category. Meanwhile, the 15 to 24 years age bracket for the primary householder has the lowest median household income of $0, with 7 households (1.7%) in this group.
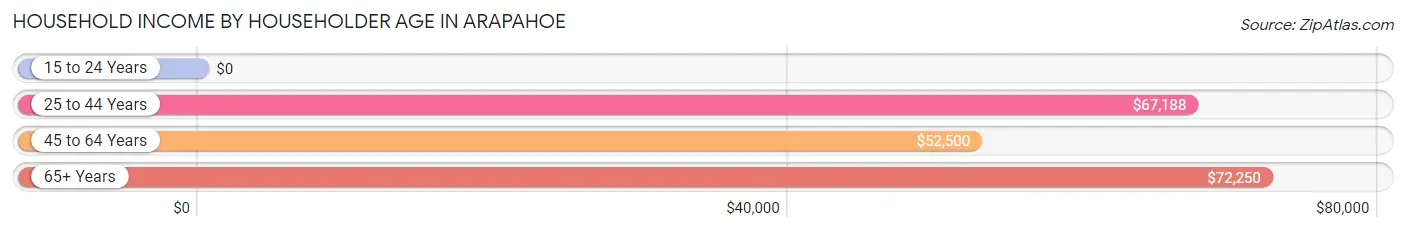
| Income Bracket | # Households | Median Income |
| 15 to 24 Years | 7 (1.7%) | $0 |
| 25 to 44 Years | 71 (17.6%) | $67,188 |
| 45 to 64 Years | 188 (46.7%) | $52,500 |
| 65+ Years | 137 (34.0%) | $72,250 |
| Total | 403 (100.0%) | $64,886 |
Poverty in Arapahoe
Income Below Poverty by Sex and Age in Arapahoe
With 17.3% poverty level for males and 20.7% for females among the residents of Arapahoe, 35 to 44 year old males and 5 year old females are the most vulnerable to poverty, with 33 males (30.6%) and 10 females (71.4%) in their respective age groups living below the poverty level.
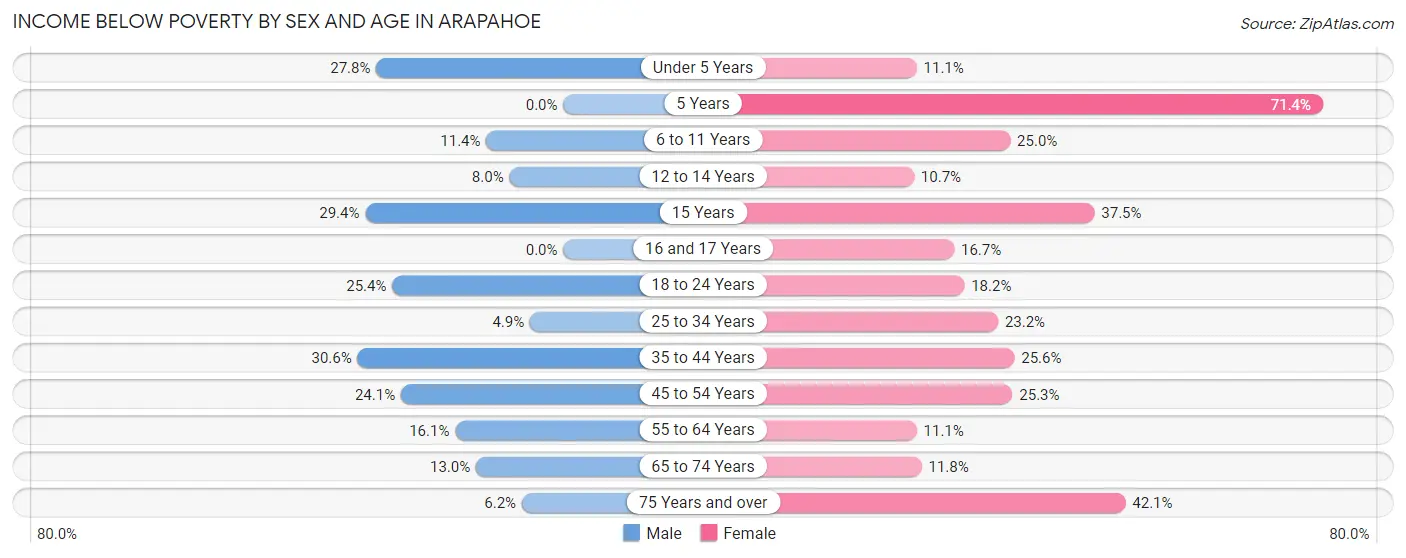
| Age Bracket | Male | Female |
| Under 5 Years | 15 (27.8%) | 3 (11.1%) |
| 5 Years | 0 (0.0%) | 10 (71.4%) |
| 6 to 11 Years | 8 (11.4%) | 20 (25.0%) |
| 12 to 14 Years | 4 (8.0%) | 3 (10.7%) |
| 15 Years | 5 (29.4%) | 3 (37.5%) |
| 16 and 17 Years | 0 (0.0%) | 4 (16.7%) |
| 18 to 24 Years | 32 (25.4%) | 20 (18.2%) |
| 25 to 34 Years | 4 (4.9%) | 16 (23.2%) |
| 35 to 44 Years | 33 (30.6%) | 21 (25.6%) |
| 45 to 54 Years | 27 (24.1%) | 19 (25.3%) |
| 55 to 64 Years | 13 (16.1%) | 11 (11.1%) |
| 65 to 74 Years | 7 (13.0%) | 9 (11.8%) |
| 75 Years and over | 4 (6.1%) | 8 (42.1%) |
| Total | 152 (17.3%) | 147 (20.7%) |
Income Above Poverty by Sex and Age in Arapahoe
According to the poverty statistics in Arapahoe, males aged 5 years and females aged 12 to 14 years are the age groups that are most secure financially, with 100.0% of males and 89.3% of females in these age groups living above the poverty line.
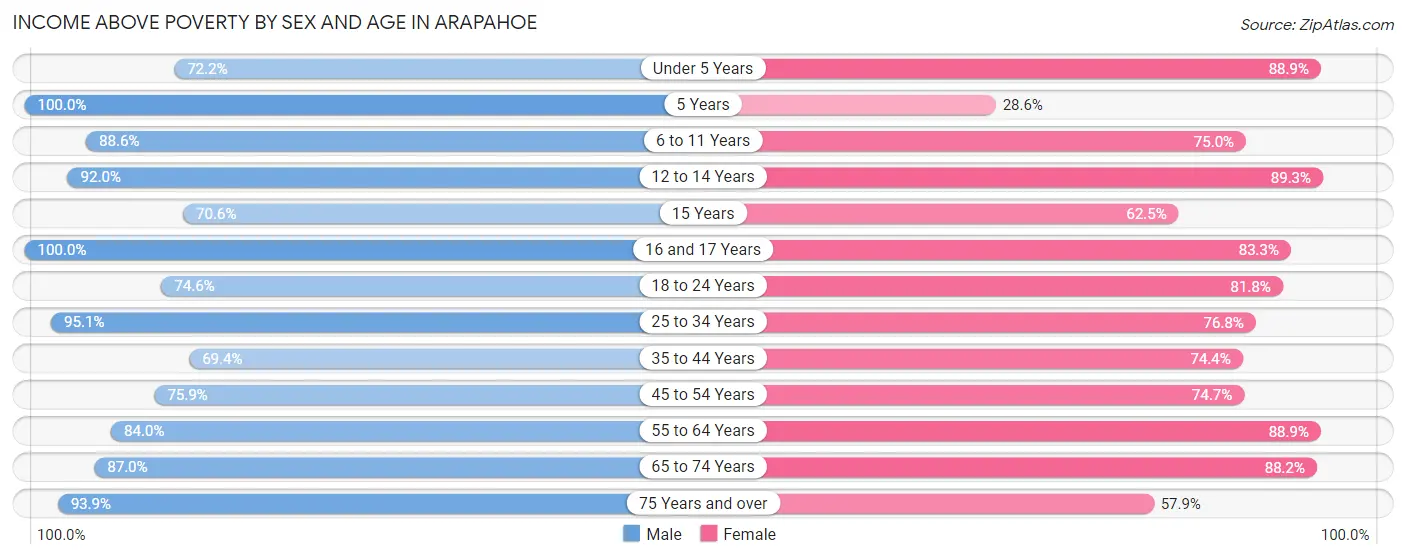
| Age Bracket | Male | Female |
| Under 5 Years | 39 (72.2%) | 24 (88.9%) |
| 5 Years | 14 (100.0%) | 4 (28.6%) |
| 6 to 11 Years | 62 (88.6%) | 60 (75.0%) |
| 12 to 14 Years | 46 (92.0%) | 25 (89.3%) |
| 15 Years | 12 (70.6%) | 5 (62.5%) |
| 16 and 17 Years | 45 (100.0%) | 20 (83.3%) |
| 18 to 24 Years | 94 (74.6%) | 90 (81.8%) |
| 25 to 34 Years | 77 (95.1%) | 53 (76.8%) |
| 35 to 44 Years | 75 (69.4%) | 61 (74.4%) |
| 45 to 54 Years | 85 (75.9%) | 56 (74.7%) |
| 55 to 64 Years | 68 (84.0%) | 88 (88.9%) |
| 65 to 74 Years | 47 (87.0%) | 67 (88.2%) |
| 75 Years and over | 61 (93.9%) | 11 (57.9%) |
| Total | 725 (82.7%) | 564 (79.3%) |
Income Below Poverty Among Married-Couple Families in Arapahoe
The poverty statistics for married-couple families in Arapahoe show that 11.0% or 15 of the total 136 families live below the poverty line. Families with 3 or 4 children have the highest poverty rate of 33.3%, comprising of 4 families. On the other hand, families with 5 or more children have the lowest poverty rate of 0.0%, which includes 0 families.
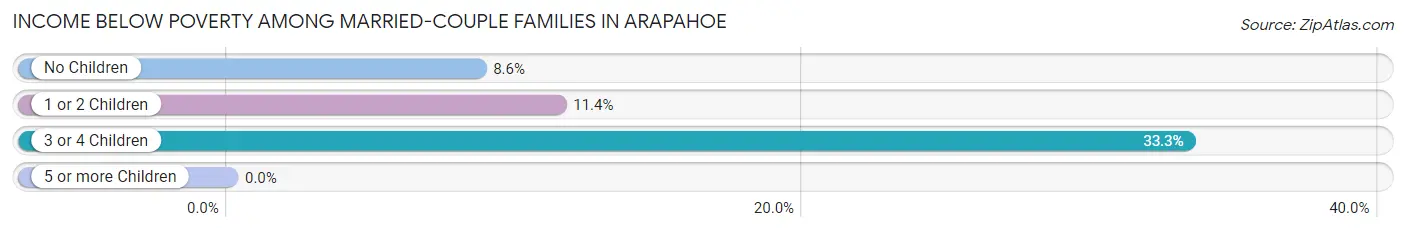
| Children | Above Poverty | Below Poverty |
| No Children | 74 (91.4%) | 7 (8.6%) |
| 1 or 2 Children | 31 (88.6%) | 4 (11.4%) |
| 3 or 4 Children | 8 (66.7%) | 4 (33.3%) |
| 5 or more Children | 8 (100.0%) | 0 (0.0%) |
| Total | 121 (89.0%) | 15 (11.0%) |
Income Below Poverty Among Single-Parent Households in Arapahoe
According to the poverty data in Arapahoe, 15.2% or 14 single-father households and 31.7% or 32 single-mother households are living below the poverty line. Among single-father households, those with no children have the highest poverty rate, with 6 households (19.4%) experiencing poverty. Likewise, among single-mother households, those with 1 or 2 children have the highest poverty rate, with 23 households (44.2%) falling below the poverty line.
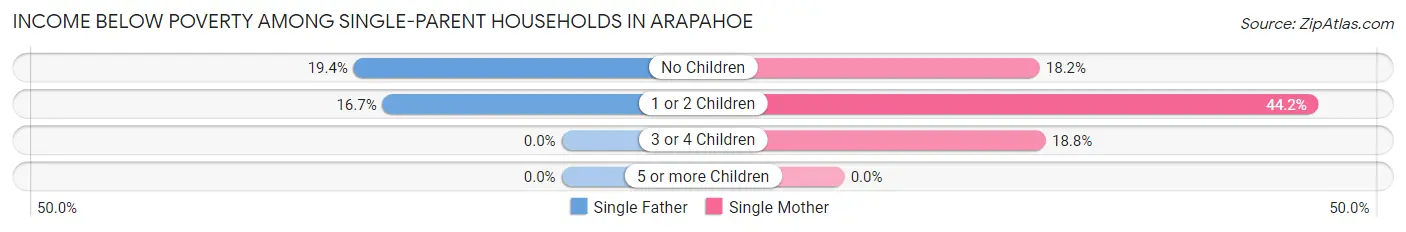
| Children | Single Father | Single Mother |
| No Children | 6 (19.4%) | 6 (18.2%) |
| 1 or 2 Children | 8 (16.7%) | 23 (44.2%) |
| 3 or 4 Children | 0 (0.0%) | 3 (18.8%) |
| 5 or more Children | 0 (0.0%) | 0 (0.0%) |
| Total | 14 (15.2%) | 32 (31.7%) |
Income Below Poverty Among Married-Couple vs Single-Parent Households in Arapahoe
The poverty data for Arapahoe shows that 15 of the married-couple family households (11.0%) and 46 of the single-parent households (23.8%) are living below the poverty level. Within the married-couple family households, those with 3 or 4 children have the highest poverty rate, with 4 households (33.3%) falling below the poverty line. Among the single-parent households, those with 1 or 2 children have the highest poverty rate, with 31 household (31.0%) living below poverty.
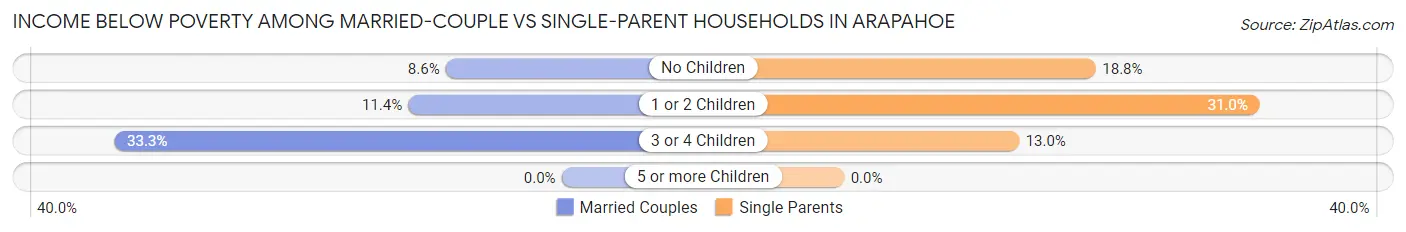
| Children | Married-Couple Families | Single-Parent Households |
| No Children | 7 (8.6%) | 12 (18.8%) |
| 1 or 2 Children | 4 (11.4%) | 31 (31.0%) |
| 3 or 4 Children | 4 (33.3%) | 3 (13.0%) |
| 5 or more Children | 0 (0.0%) | 0 (0.0%) |
| Total | 15 (11.0%) | 46 (23.8%) |
Race in Arapahoe
The most populous races in Arapahoe are Native / Alaskan (1,220 | 76.4%), White / Caucasian (242 | 15.2%), and Hispanic or Latino (169 | 10.6%).
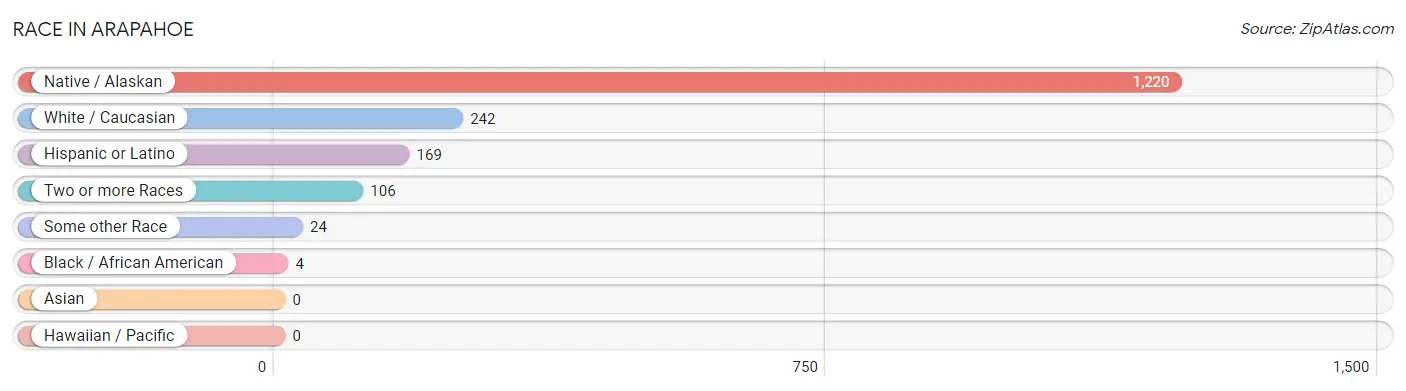
| Race | # Population | % Population |
| Asian | 0 | 0.0% |
| Black / African American | 4 | 0.3% |
| Hawaiian / Pacific | 0 | 0.0% |
| Hispanic or Latino | 169 | 10.6% |
| Native / Alaskan | 1,220 | 76.4% |
| White / Caucasian | 242 | 15.2% |
| Two or more Races | 106 | 6.6% |
| Some other Race | 24 | 1.5% |
| Total | 1,596 | 100.0% |
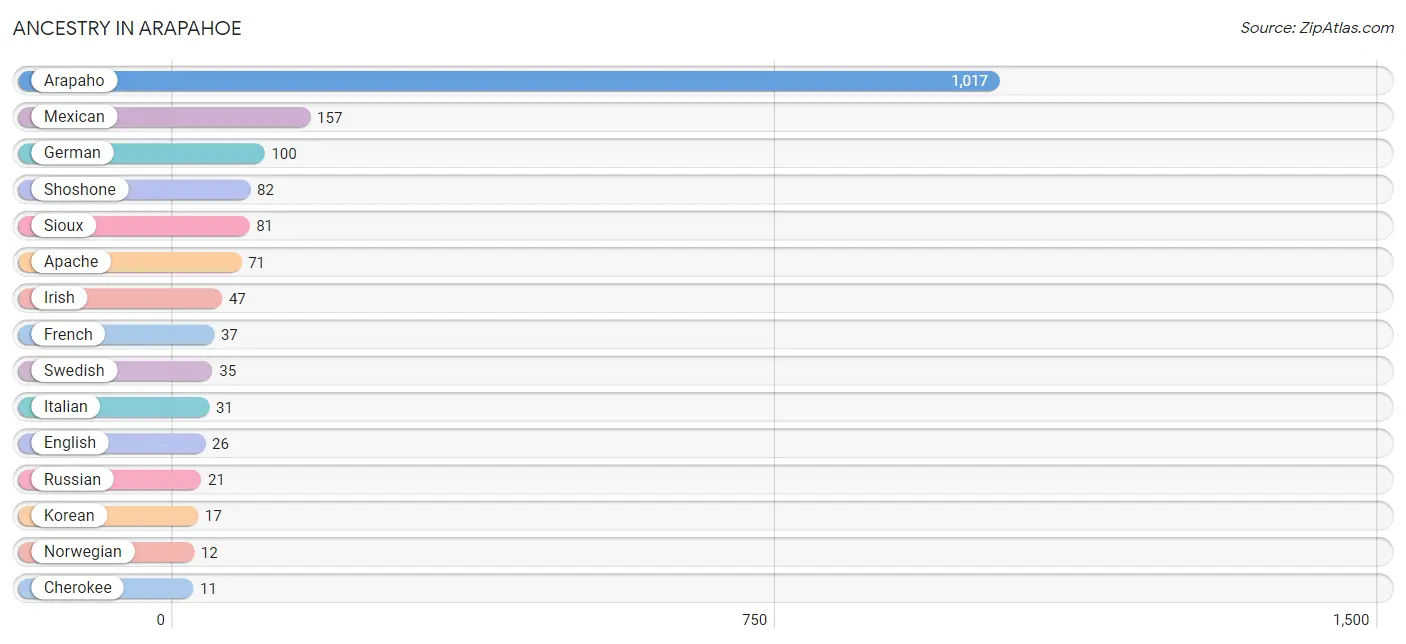
Ancestry in Arapahoe
The most populous ancestries reported in Arapahoe are Arapaho (1,017 | 63.7%), Mexican (157 | 9.8%), German (100 | 6.3%), Shoshone (82 | 5.1%), and Sioux (81 | 5.1%), together accounting for 90.0% of all Arapahoe residents.
| Ancestry | # Population | % Population |
| American | 9 | 0.6% |
| Apache | 71 | 4.4% |
| Arapaho | 1,017 | 63.7% |
| Cherokee | 11 | 0.7% |
| Cheyenne | 3 | 0.2% |
| Chickasaw | 4 | 0.3% |
| Crow | 8 | 0.5% |
| Dominican | 1 | 0.1% |
| Dutch | 8 | 0.5% |
| English | 26 | 1.6% |
| European | 8 | 0.5% |
| French | 37 | 2.3% |
| German | 100 | 6.3% |
| Irish | 47 | 2.9% |
| Italian | 31 | 1.9% |
| Korean | 17 | 1.1% |
| Mexican | 157 | 9.8% |
| Navajo | 8 | 0.5% |
| Norwegian | 12 | 0.7% |
| Polish | 6 | 0.4% |
| Portuguese | 1 | 0.1% |
| Russian | 21 | 1.3% |
| Scottish | 8 | 0.5% |
| Shoshone | 82 | 5.1% |
| Sioux | 81 | 5.1% |
| Slovak | 3 | 0.2% |
| Spanish | 11 | 0.7% |
| Swedish | 35 | 2.2% |
| Tlingit-Haida | 9 | 0.6% | View All 29 Rows |
Immigrants in Arapahoe
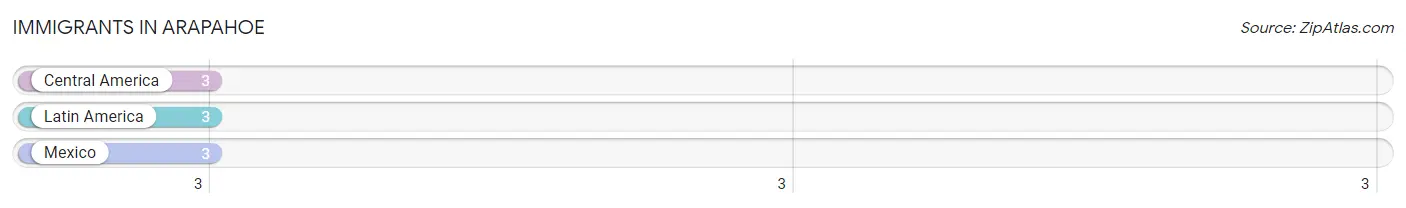
The most numerous immigrant groups reported in Arapahoe came from Central America (3 | 0.2%), Latin America (3 | 0.2%), and Mexico (3 | 0.2%), together accounting for 0.6% of all Arapahoe residents.
| Immigration Origin | # Population | % Population |
| Central America | 3 | 0.2% |
| Latin America | 3 | 0.2% |
| Mexico | 3 | 0.2% | View All 3 Rows |
Sex and Age in Arapahoe
Sex and Age in Arapahoe
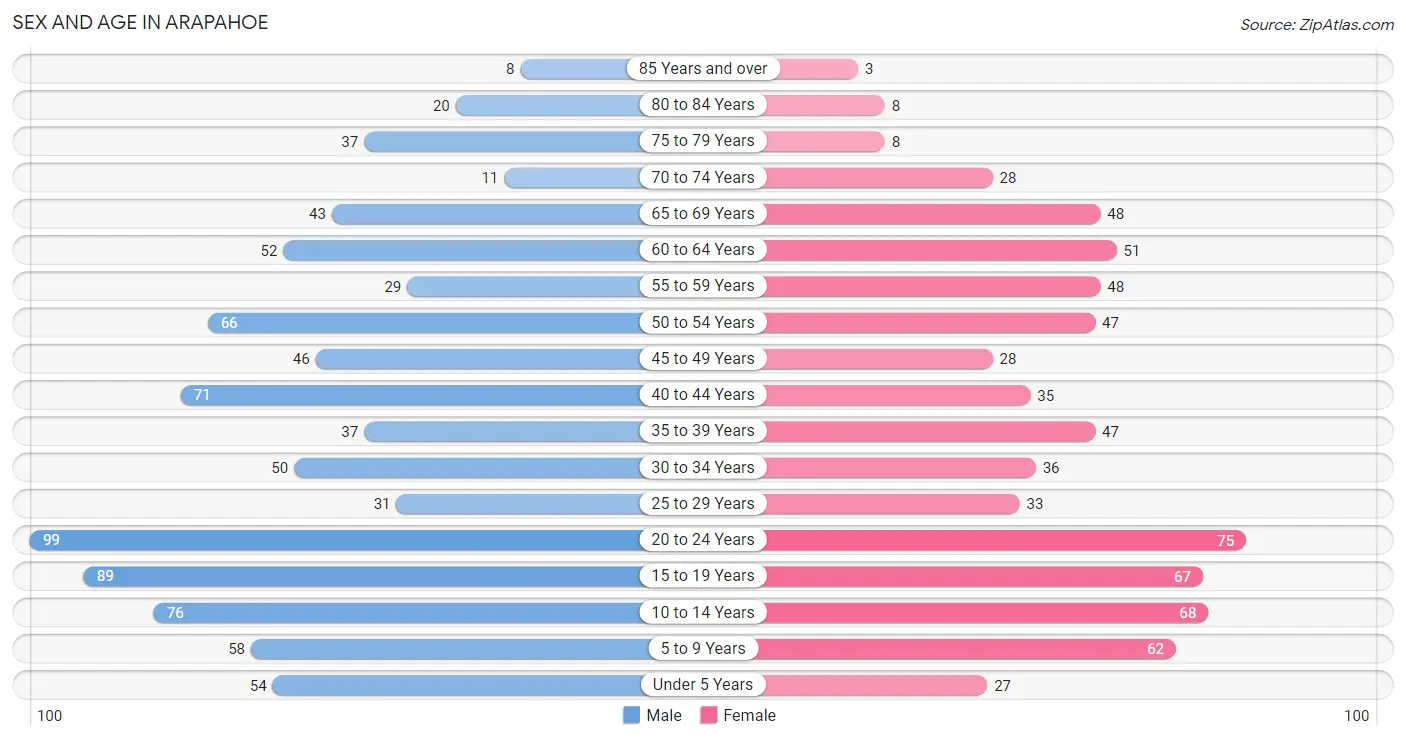
The most populous age groups in Arapahoe are 20 to 24 Years (99 | 11.3%) for men and 20 to 24 Years (75 | 10.4%) for women.
| Age Bracket | Male | Female |
| Under 5 Years | 54 (6.2%) | 27 (3.8%) |
| 5 to 9 Years | 58 (6.6%) | 62 (8.6%) |
| 10 to 14 Years | 76 (8.7%) | 68 (9.5%) |
| 15 to 19 Years | 89 (10.2%) | 67 (9.3%) |
| 20 to 24 Years | 99 (11.3%) | 75 (10.4%) |
| 25 to 29 Years | 31 (3.5%) | 33 (4.6%) |
| 30 to 34 Years | 50 (5.7%) | 36 (5.0%) |
| 35 to 39 Years | 37 (4.2%) | 47 (6.5%) |
| 40 to 44 Years | 71 (8.1%) | 35 (4.9%) |
| 45 to 49 Years | 46 (5.2%) | 28 (3.9%) |
| 50 to 54 Years | 66 (7.5%) | 47 (6.5%) |
| 55 to 59 Years | 29 (3.3%) | 48 (6.7%) |
| 60 to 64 Years | 52 (5.9%) | 51 (7.1%) |
| 65 to 69 Years | 43 (4.9%) | 48 (6.7%) |
| 70 to 74 Years | 11 (1.3%) | 28 (3.9%) |
| 75 to 79 Years | 37 (4.2%) | 8 (1.1%) |
| 80 to 84 Years | 20 (2.3%) | 8 (1.1%) |
| 85 Years and over | 8 (0.9%) | 3 (0.4%) |
| Total | 877 (100.0%) | 719 (100.0%) |
Families and Households in Arapahoe
Median Family Size in Arapahoe
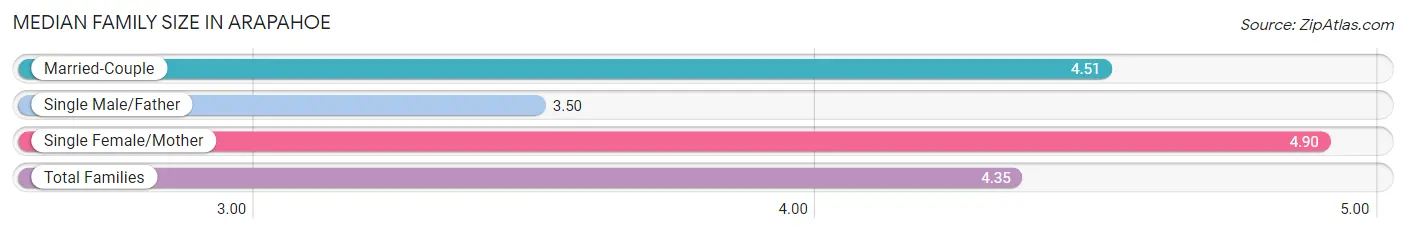
The median family size in Arapahoe is 4.35 persons per family, with single female/mother families (101 | 30.7%) accounting for the largest median family size of 4.9 persons per family. On the other hand, single male/father families (92 | 28.0%) represent the smallest median family size with 3.50 persons per family.
| Family Type | # Families | Family Size |
| Married-Couple | 136 (41.3%) | 4.51 |
| Single Male/Father | 92 (28.0%) | 3.50 |
| Single Female/Mother | 101 (30.7%) | 4.90 |
| Total Families | 329 (100.0%) | 4.35 |
Median Household Size in Arapahoe
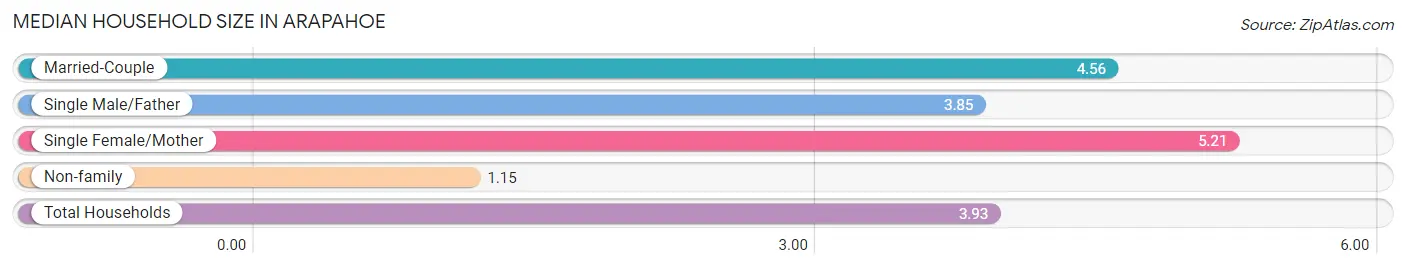
The median household size in Arapahoe is 3.93 persons per household, with single female/mother households (101 | 25.1%) accounting for the largest median household size of 5.21 persons per household. non-family households (74 | 18.4%) represent the smallest median household size with 1.15 persons per household.
| Household Type | # Households | Household Size |
| Married-Couple | 136 (33.8%) | 4.56 |
| Single Male/Father | 92 (22.8%) | 3.85 |
| Single Female/Mother | 101 (25.1%) | 5.21 |
| Non-family | 74 (18.4%) | 1.15 |
| Total Households | 403 (100.0%) | 3.93 |
Household Size by Marriage Status in Arapahoe
Out of a total of 403 households in Arapahoe, 329 (81.6%) are family households, while 74 (18.4%) are nonfamily households. The most numerous type of family households are 2-person households, comprising 75, and the most common type of nonfamily households are 1-person households, comprising 66.
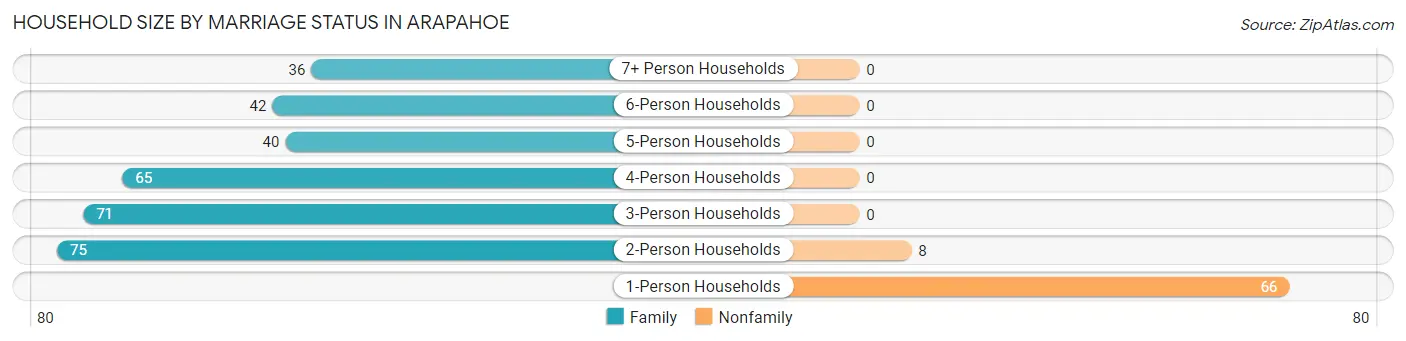
| Household Size | Family Households | Nonfamily Households |
| 1-Person Households | - | 66 (16.4%) |
| 2-Person Households | 75 (18.6%) | 8 (2.0%) |
| 3-Person Households | 71 (17.6%) | 0 (0.0%) |
| 4-Person Households | 65 (16.1%) | 0 (0.0%) |
| 5-Person Households | 40 (9.9%) | 0 (0.0%) |
| 6-Person Households | 42 (10.4%) | 0 (0.0%) |
| 7+ Person Households | 36 (8.9%) | 0 (0.0%) |
| Total | 329 (81.6%) | 74 (18.4%) |
Female Fertility in Arapahoe
Fertility by Age in Arapahoe
Average fertility rate in Arapahoe is 36.0 births per 1,000 women. Women in the age bracket of 20 to 34 years have the highest fertility rate with 63.0 births per 1,000 women. Women in the age bracket of 20 to 34 years acount for 75.0% of all women with births.
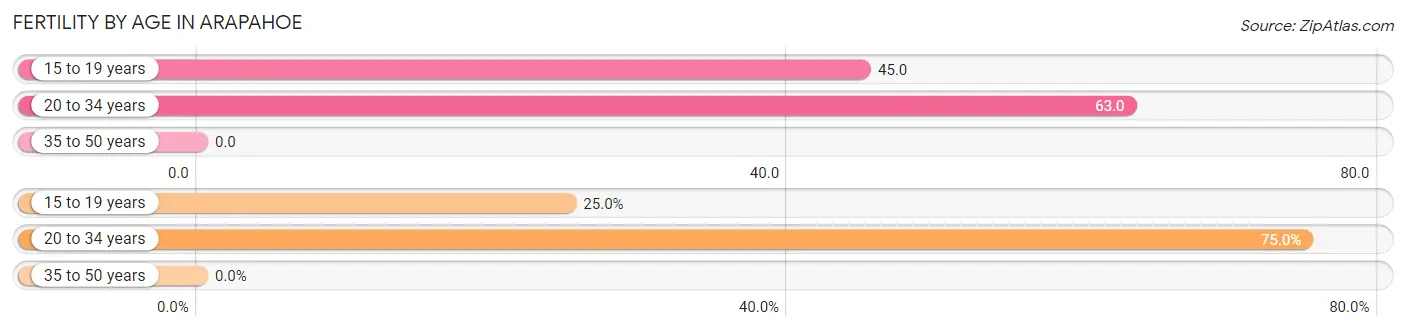
| Age Bracket | Women with Births | Births / 1,000 Women |
| 15 to 19 years | 3 (25.0%) | 45.0 |
| 20 to 34 years | 9 (75.0%) | 63.0 |
| 35 to 50 years | 0 (0.0%) | 0.0 |
| Total | 12 (100.0%) | 36.0 |
Fertility by Age by Marriage Status in Arapahoe
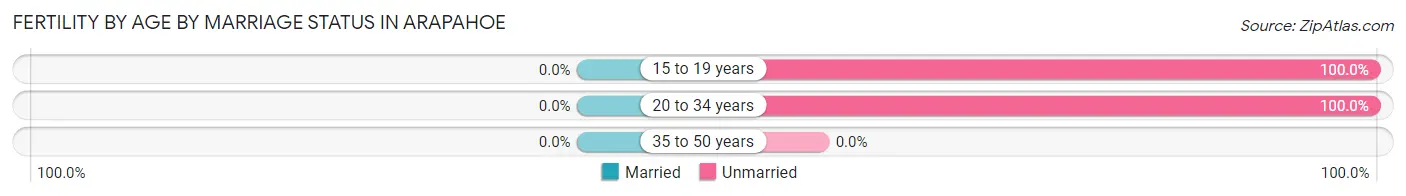
| Age Bracket | Married | Unmarried |
| 15 to 19 years | 0 (0.0%) | 3 (100.0%) |
| 20 to 34 years | 0 (0.0%) | 9 (100.0%) |
| 35 to 50 years | 0 (0.0%) | 0 (0.0%) |
| Total | 0 (0.0%) | 12 (100.0%) |
Fertility by Education in Arapahoe
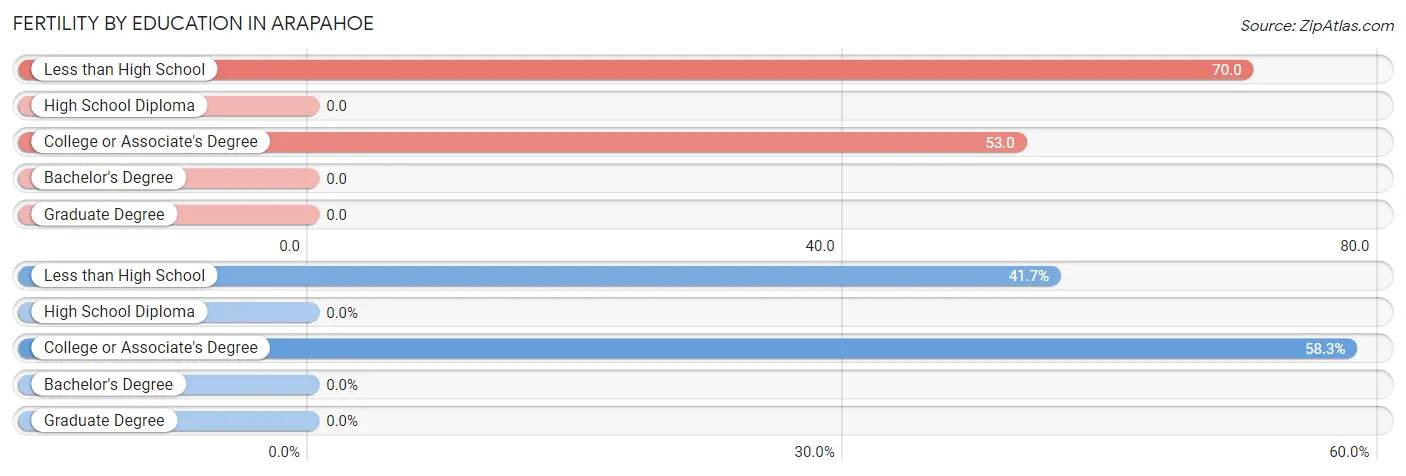
| Educational Attainment | Women with Births | Births / 1,000 Women |
| Less than High School | 5 (41.7%) | 70.0 |
| High School Diploma | 0 (0.0%) | 0.0 |
| College or Associate's Degree | 7 (58.3%) | 53.0 |
| Bachelor's Degree | 0 (0.0%) | 0.0 |
| Graduate Degree | 0 (0.0%) | 0.0 |
| Total | 12 (100.0%) | 36.0 |
Fertility by Education by Marriage Status in Arapahoe
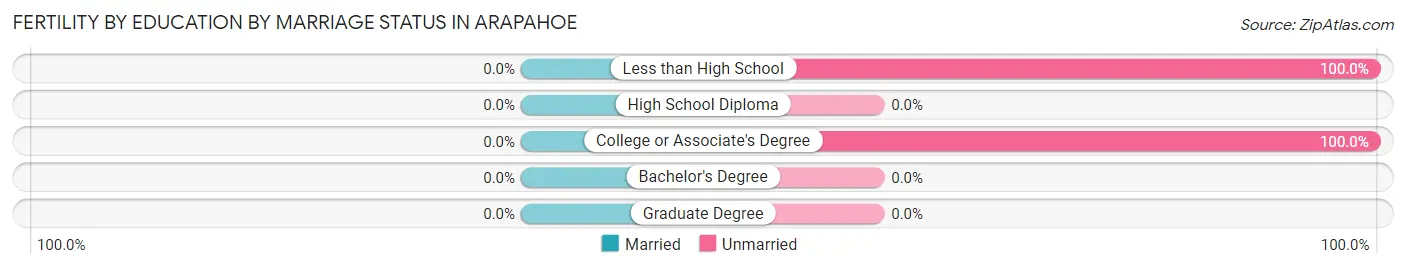
| Educational Attainment | Married | Unmarried |
| Less than High School | 0 (0.0%) | 5 (100.0%) |
| High School Diploma | 0 (0.0%) | 0 (0.0%) |
| College or Associate's Degree | 0 (0.0%) | 7 (100.0%) |
| Bachelor's Degree | 0 (0.0%) | 0 (0.0%) |
| Graduate Degree | 0 (0.0%) | 0 (0.0%) |
| Total | 0 (0.0%) | 12 (100.0%) |
Employment Characteristics in Arapahoe
Employment by Class of Employer in Arapahoe
Among the 540 employed individuals in Arapahoe, local government employees (196 | 36.3%), private company employees (167 | 30.9%), and federal government employees (79 | 14.6%) make up the most common classes of employment.
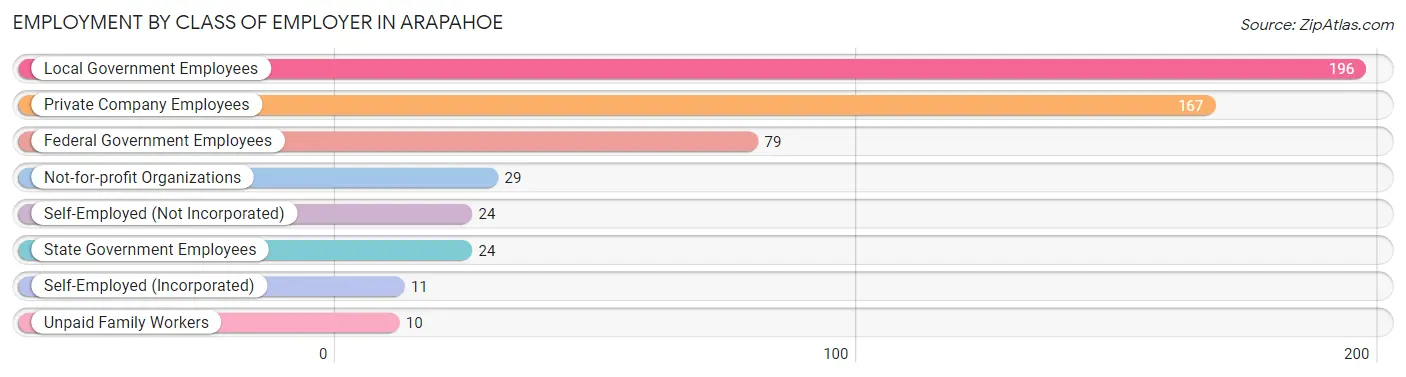
| Employer Class | # Employees | % Employees |
| Private Company Employees | 167 | 30.9% |
| Self-Employed (Incorporated) | 11 | 2.0% |
| Self-Employed (Not Incorporated) | 24 | 4.4% |
| Not-for-profit Organizations | 29 | 5.4% |
| Local Government Employees | 196 | 36.3% |
| State Government Employees | 24 | 4.4% |
| Federal Government Employees | 79 | 14.6% |
| Unpaid Family Workers | 10 | 1.8% |
| Total | 540 | 100.0% |
Employment Status by Age in Arapahoe
According to the labor force statistics for Arapahoe, out of the total population over 16 years of age (1,226), 58.4% or 716 individuals are in the labor force, with 18.6% or 133 of them unemployed. The age group with the highest labor force participation rate is 30 to 34 years, with 90.7% or 78 individuals in the labor force. Within the labor force, the 20 to 24 years age range has the highest percentage of unemployed individuals, with 35.0% or 42 of them being unemployed.
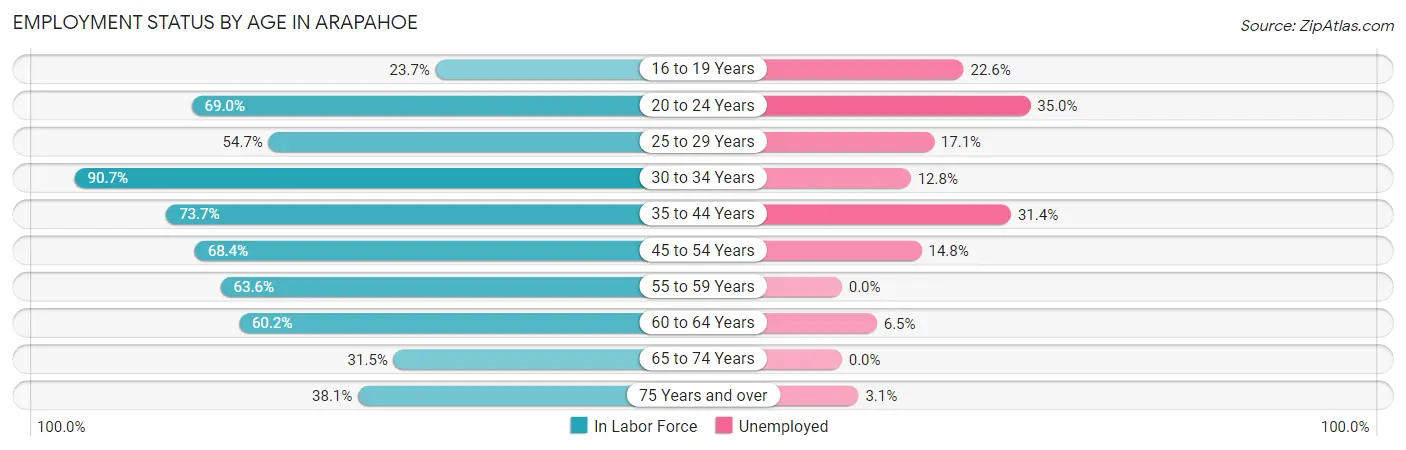
| Age Bracket | In Labor Force | Unemployed |
| 16 to 19 Years | 31 (23.7%) | 7 (22.6%) |
| 20 to 24 Years | 120 (69.0%) | 42 (35.0%) |
| 25 to 29 Years | 35 (54.7%) | 6 (17.1%) |
| 30 to 34 Years | 78 (90.7%) | 10 (12.8%) |
| 35 to 44 Years | 140 (73.7%) | 44 (31.4%) |
| 45 to 54 Years | 128 (68.4%) | 19 (14.8%) |
| 55 to 59 Years | 49 (63.6%) | 0 (0.0%) |
| 60 to 64 Years | 62 (60.2%) | 4 (6.5%) |
| 65 to 74 Years | 41 (31.5%) | 0 (0.0%) |
| 75 Years and over | 32 (38.1%) | 1 (3.1%) |
| Total | 716 (58.4%) | 133 (18.6%) |
Employment Status by Educational Attainment in Arapahoe
According to labor force statistics for Arapahoe, 69.6% of individuals (492) out of the total population between 25 and 64 years of age (707) are in the labor force, with 16.9% or 83 of them being unemployed. The group with the highest labor force participation rate are those with the educational attainment of bachelor's degree or higher, with 88.3% or 53 individuals in the labor force. Within the labor force, individuals with less than high school education have the highest percentage of unemployment, with 44.2% or 19 of them being unemployed.
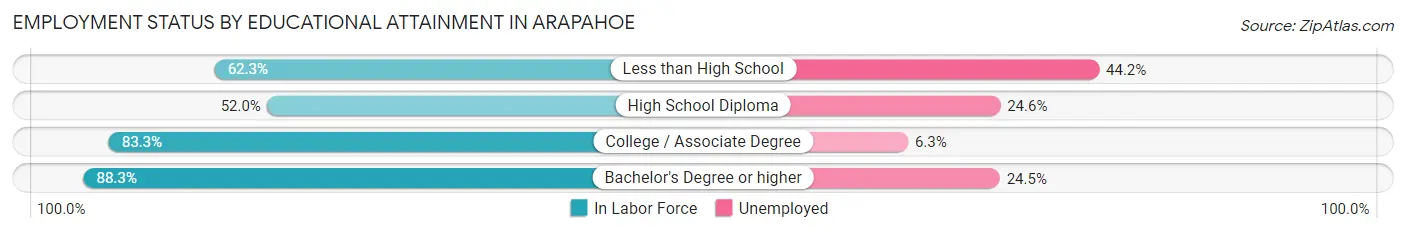
| Educational Attainment | In Labor Force | Unemployed |
| Less than High School | 43 (62.3%) | 30 (44.2%) |
| High School Diploma | 142 (52.0%) | 67 (24.6%) |
| College / Associate Degree | 254 (83.3%) | 19 (6.3%) |
| Bachelor's Degree or higher | 53 (88.3%) | 15 (24.5%) |
| Total | 492 (69.6%) | 119 (16.9%) |
Employment Occupations by Sex in Arapahoe
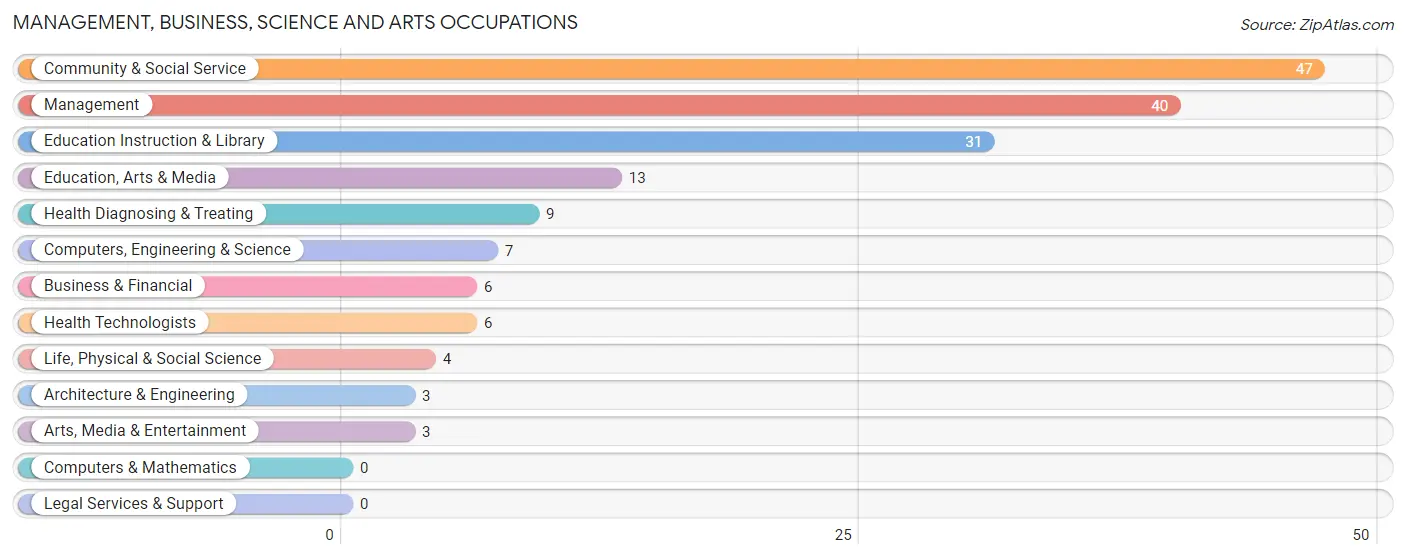
Management, Business, Science and Arts Occupations
The most common Management, Business, Science and Arts occupations in Arapahoe are Community & Social Service (47 | 8.1%), Management (40 | 6.9%), Education Instruction & Library (31 | 5.3%), Education, Arts & Media (13 | 2.2%), and Health Diagnosing & Treating (9 | 1.5%).
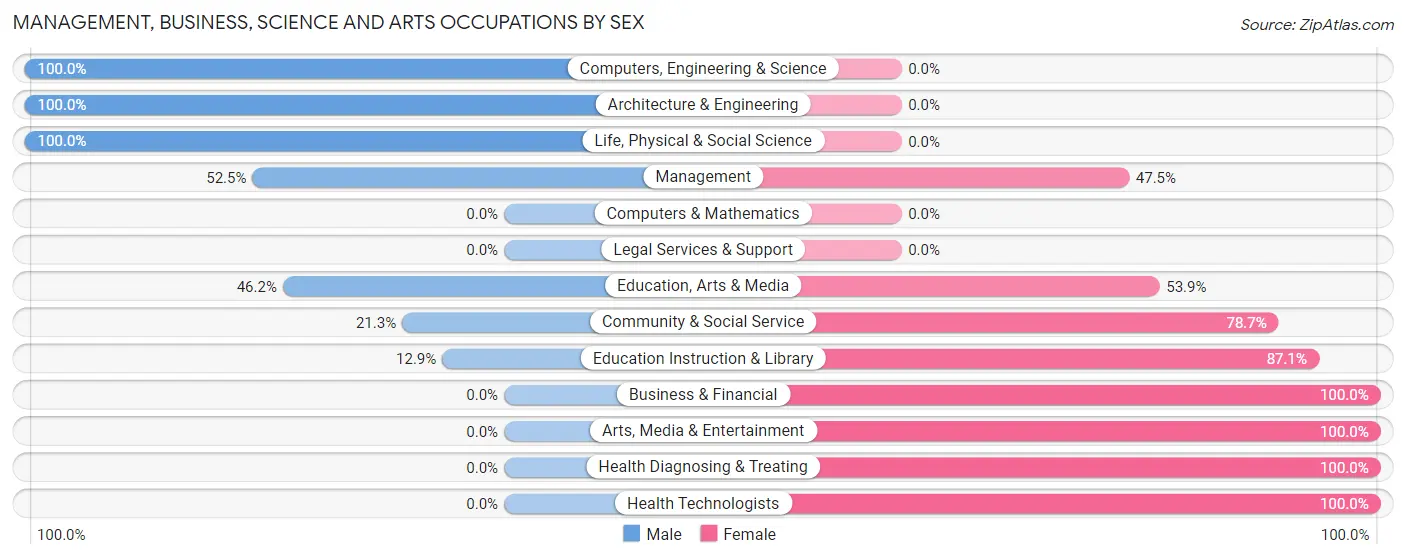
Management, Business, Science and Arts Occupations by Sex
Within the Management, Business, Science and Arts occupations in Arapahoe, the most male-oriented occupations are Computers, Engineering & Science (100.0%), Architecture & Engineering (100.0%), and Life, Physical & Social Science (100.0%), while the most female-oriented occupations are Business & Financial (100.0%), Arts, Media & Entertainment (100.0%), and Health Diagnosing & Treating (100.0%).
| Occupation | Male | Female |
| Management | 21 (52.5%) | 19 (47.5%) |
| Business & Financial | 0 (0.0%) | 6 (100.0%) |
| Computers, Engineering & Science | 7 (100.0%) | 0 (0.0%) |
| Computers & Mathematics | 0 (0.0%) | 0 (0.0%) |
| Architecture & Engineering | 3 (100.0%) | 0 (0.0%) |
| Life, Physical & Social Science | 4 (100.0%) | 0 (0.0%) |
| Community & Social Service | 10 (21.3%) | 37 (78.7%) |
| Education, Arts & Media | 6 (46.2%) | 7 (53.8%) |
| Legal Services & Support | 0 (0.0%) | 0 (0.0%) |
| Education Instruction & Library | 4 (12.9%) | 27 (87.1%) |
| Arts, Media & Entertainment | 0 (0.0%) | 3 (100.0%) |
| Health Diagnosing & Treating | 0 (0.0%) | 9 (100.0%) |
| Health Technologists | 0 (0.0%) | 6 (100.0%) |
| Total (Category) | 38 (34.9%) | 71 (65.1%) |
| Total (Overall) | 333 (57.1%) | 250 (42.9%) |
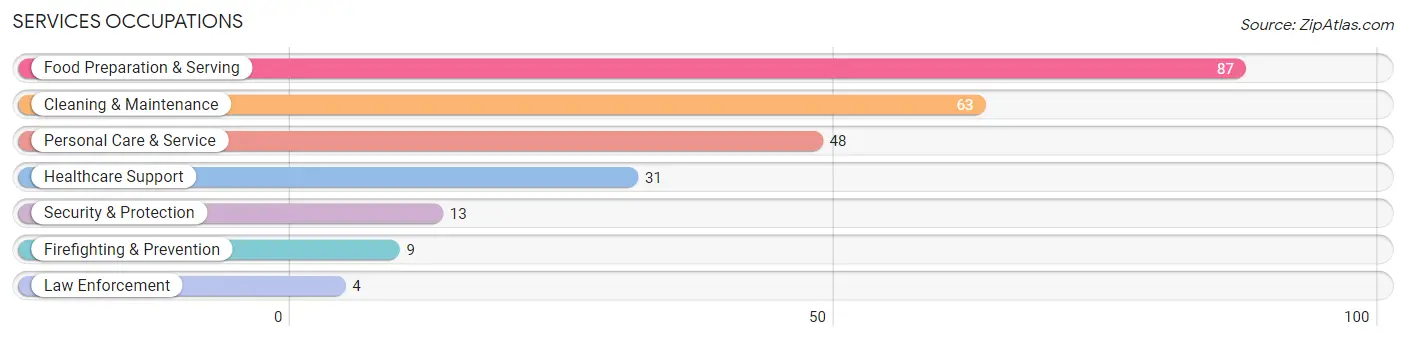
Services Occupations
The most common Services occupations in Arapahoe are Food Preparation & Serving (87 | 14.9%), Cleaning & Maintenance (63 | 10.8%), Personal Care & Service (48 | 8.2%), Healthcare Support (31 | 5.3%), and Security & Protection (13 | 2.2%).
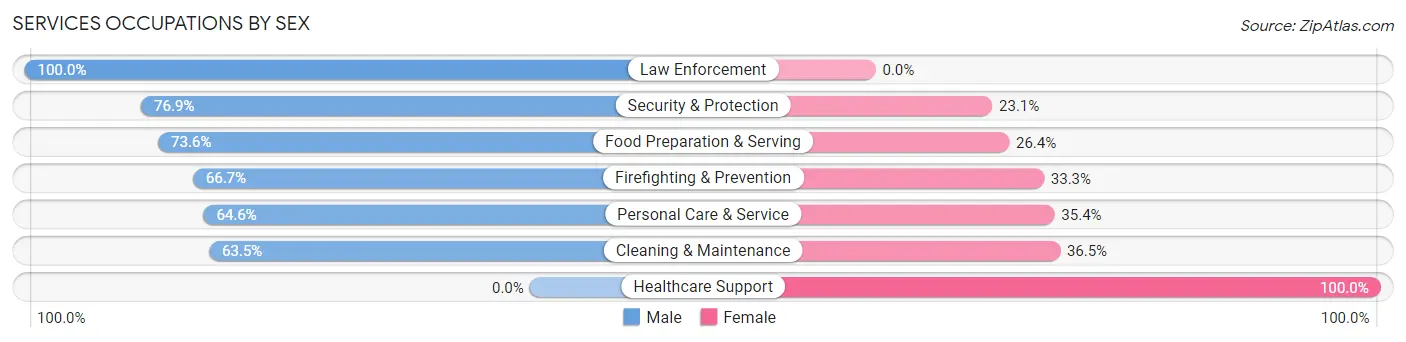
Services Occupations by Sex
Within the Services occupations in Arapahoe, the most male-oriented occupations are Law Enforcement (100.0%), Security & Protection (76.9%), and Food Preparation & Serving (73.6%), while the most female-oriented occupations are Healthcare Support (100.0%), Cleaning & Maintenance (36.5%), and Personal Care & Service (35.4%).
| Occupation | Male | Female |
| Healthcare Support | 0 (0.0%) | 31 (100.0%) |
| Security & Protection | 10 (76.9%) | 3 (23.1%) |
| Firefighting & Prevention | 6 (66.7%) | 3 (33.3%) |
| Law Enforcement | 4 (100.0%) | 0 (0.0%) |
| Food Preparation & Serving | 64 (73.6%) | 23 (26.4%) |
| Cleaning & Maintenance | 40 (63.5%) | 23 (36.5%) |
| Personal Care & Service | 31 (64.6%) | 17 (35.4%) |
| Total (Category) | 145 (59.9%) | 97 (40.1%) |
| Total (Overall) | 333 (57.1%) | 250 (42.9%) |
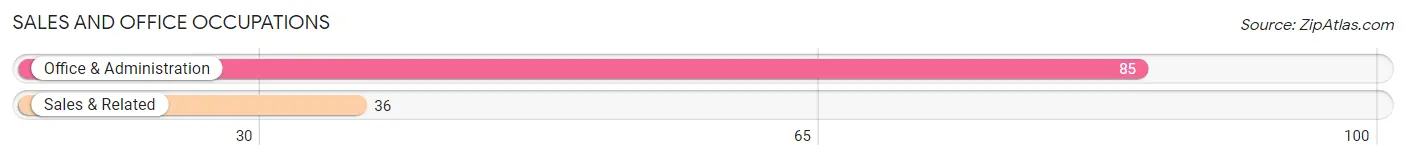
Sales and Office Occupations
The most common Sales and Office occupations in Arapahoe are Office & Administration (85 | 14.6%), and Sales & Related (36 | 6.2%).
Sales and Office Occupations by Sex
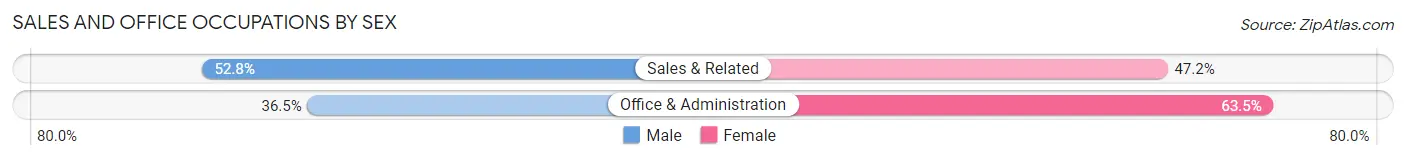
| Occupation | Male | Female |
| Sales & Related | 19 (52.8%) | 17 (47.2%) |
| Office & Administration | 31 (36.5%) | 54 (63.5%) |
| Total (Category) | 50 (41.3%) | 71 (58.7%) |
| Total (Overall) | 333 (57.1%) | 250 (42.9%) |
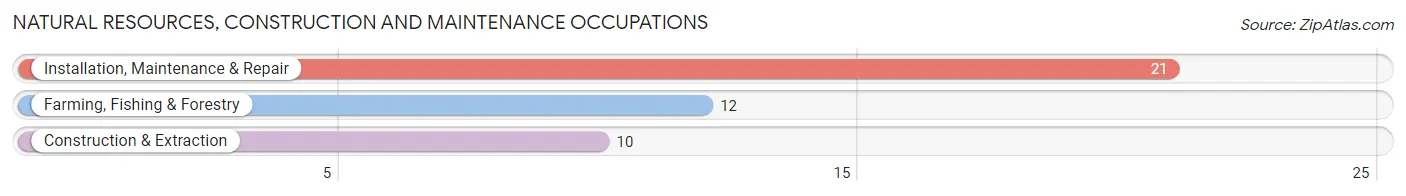
Natural Resources, Construction and Maintenance Occupations
The most common Natural Resources, Construction and Maintenance occupations in Arapahoe are Installation, Maintenance & Repair (21 | 3.6%), Farming, Fishing & Forestry (12 | 2.1%), and Construction & Extraction (10 | 1.7%).
Natural Resources, Construction and Maintenance Occupations by Sex
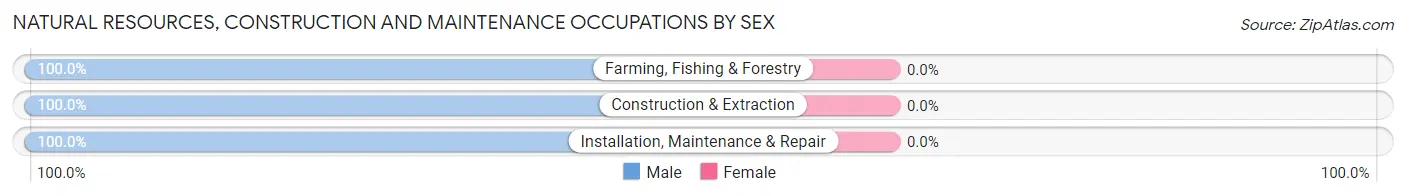
| Occupation | Male | Female |
| Farming, Fishing & Forestry | 12 (100.0%) | 0 (0.0%) |
| Construction & Extraction | 10 (100.0%) | 0 (0.0%) |
| Installation, Maintenance & Repair | 21 (100.0%) | 0 (0.0%) |
| Total (Category) | 43 (100.0%) | 0 (0.0%) |
| Total (Overall) | 333 (57.1%) | 250 (42.9%) |
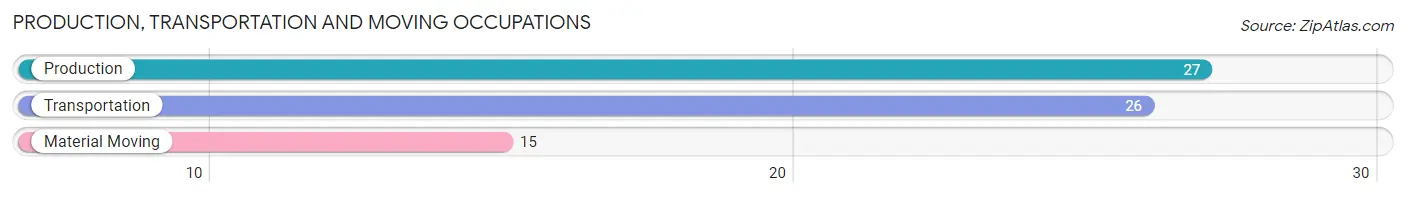
Production, Transportation and Moving Occupations
The most common Production, Transportation and Moving occupations in Arapahoe are Production (27 | 4.6%), Transportation (26 | 4.5%), and Material Moving (15 | 2.6%).
Production, Transportation and Moving Occupations by Sex
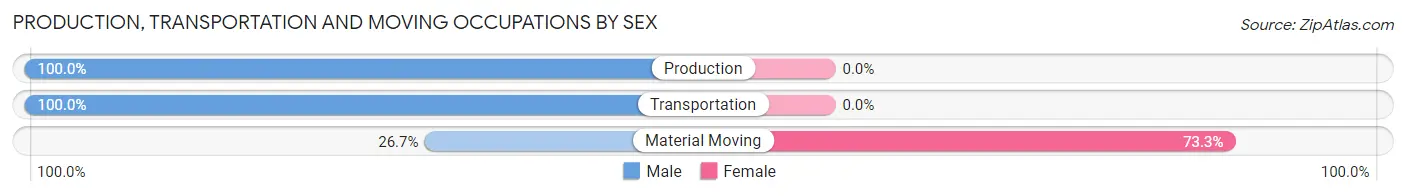
| Occupation | Male | Female |
| Production | 27 (100.0%) | 0 (0.0%) |
| Transportation | 26 (100.0%) | 0 (0.0%) |
| Material Moving | 4 (26.7%) | 11 (73.3%) |
| Total (Category) | 57 (83.8%) | 11 (16.2%) |
| Total (Overall) | 333 (57.1%) | 250 (42.9%) |
Employment Industries by Sex in Arapahoe
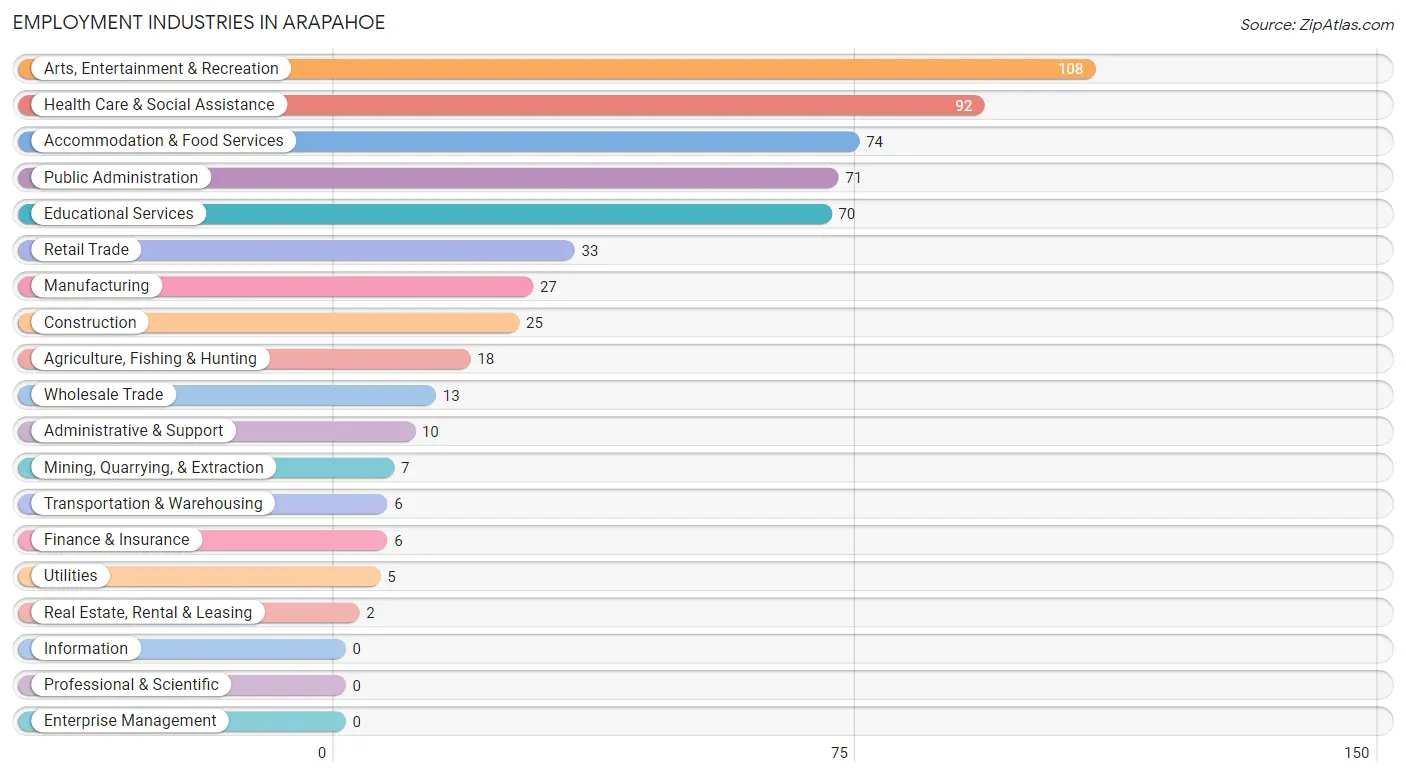
Employment Industries in Arapahoe
The major employment industries in Arapahoe include Arts, Entertainment & Recreation (108 | 18.5%), Health Care & Social Assistance (92 | 15.8%), Accommodation & Food Services (74 | 12.7%), Public Administration (71 | 12.2%), and Educational Services (70 | 12.0%).
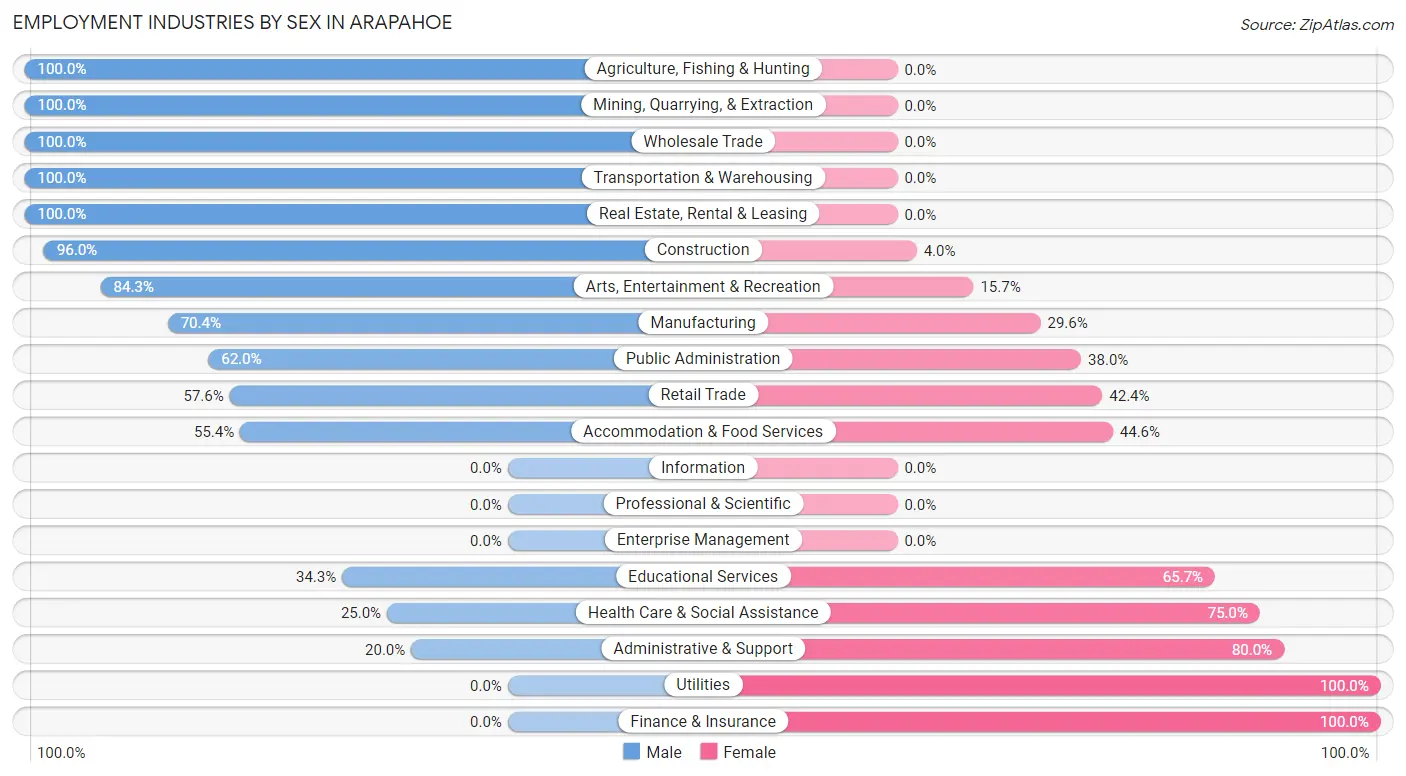
Employment Industries by Sex in Arapahoe
The Arapahoe industries that see more men than women are Agriculture, Fishing & Hunting (100.0%), Mining, Quarrying, & Extraction (100.0%), and Wholesale Trade (100.0%), whereas the industries that tend to have a higher number of women are Utilities (100.0%), Finance & Insurance (100.0%), and Administrative & Support (80.0%).
| Industry | Male | Female |
| Agriculture, Fishing & Hunting | 18 (100.0%) | 0 (0.0%) |
| Mining, Quarrying, & Extraction | 7 (100.0%) | 0 (0.0%) |
| Construction | 24 (96.0%) | 1 (4.0%) |
| Manufacturing | 19 (70.4%) | 8 (29.6%) |
| Wholesale Trade | 13 (100.0%) | 0 (0.0%) |
| Retail Trade | 19 (57.6%) | 14 (42.4%) |
| Transportation & Warehousing | 6 (100.0%) | 0 (0.0%) |
| Utilities | 0 (0.0%) | 5 (100.0%) |
| Information | 0 (0.0%) | 0 (0.0%) |
| Finance & Insurance | 0 (0.0%) | 6 (100.0%) |
| Real Estate, Rental & Leasing | 2 (100.0%) | 0 (0.0%) |
| Professional & Scientific | 0 (0.0%) | 0 (0.0%) |
| Enterprise Management | 0 (0.0%) | 0 (0.0%) |
| Administrative & Support | 2 (20.0%) | 8 (80.0%) |
| Educational Services | 24 (34.3%) | 46 (65.7%) |
| Health Care & Social Assistance | 23 (25.0%) | 69 (75.0%) |
| Arts, Entertainment & Recreation | 91 (84.3%) | 17 (15.7%) |
| Accommodation & Food Services | 41 (55.4%) | 33 (44.6%) |
| Public Administration | 44 (62.0%) | 27 (38.0%) |
| Total | 333 (57.1%) | 250 (42.9%) |
Education in Arapahoe
School Enrollment in Arapahoe
The most common levels of schooling among the 389 students in Arapahoe are middle school (119 | 30.6%), high school (116 | 29.8%), and elementary school (83 | 21.3%).
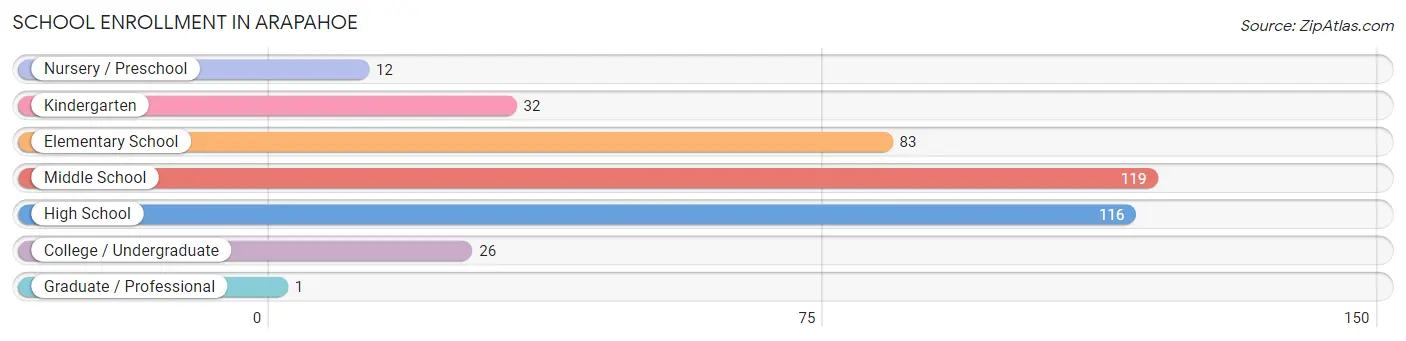
| School Level | # Students | % Students |
| Nursery / Preschool | 12 | 3.1% |
| Kindergarten | 32 | 8.2% |
| Elementary School | 83 | 21.3% |
| Middle School | 119 | 30.6% |
| High School | 116 | 29.8% |
| College / Undergraduate | 26 | 6.7% |
| Graduate / Professional | 1 | 0.3% |
| Total | 389 | 100.0% |
School Enrollment by Age by Funding Source in Arapahoe
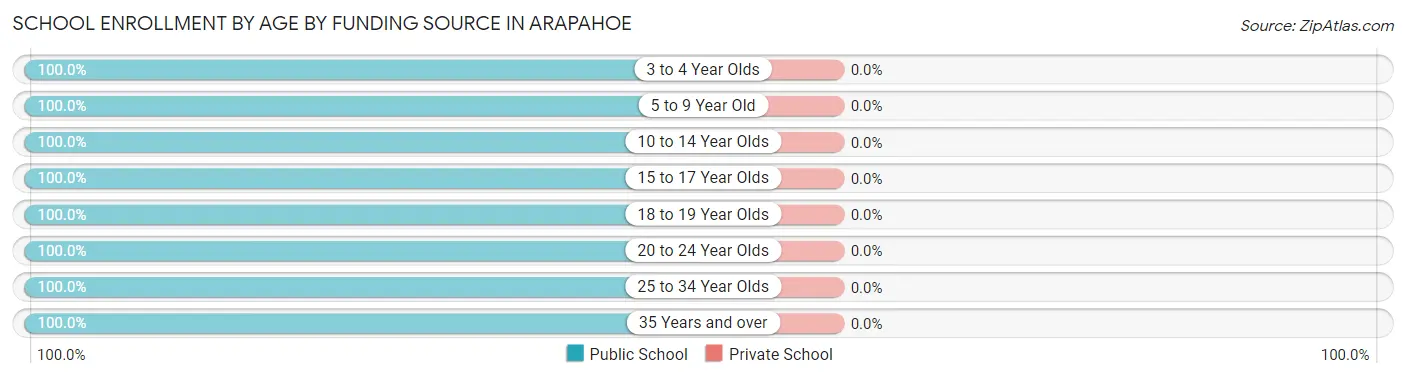
| Age Bracket | Public School | Private School |
| 3 to 4 Year Olds | 20 (100.0%) | 0 (0.0%) |
| 5 to 9 Year Old | 97 (100.0%) | 0 (0.0%) |
| 10 to 14 Year Olds | 141 (100.0%) | 0 (0.0%) |
| 15 to 17 Year Olds | 75 (100.0%) | 0 (0.0%) |
| 18 to 19 Year Olds | 29 (100.0%) | 0 (0.0%) |
| 20 to 24 Year Olds | 7 (100.0%) | 0 (0.0%) |
| 25 to 34 Year Olds | 9 (100.0%) | 0 (0.0%) |
| 35 Years and over | 11 (100.0%) | 0 (0.0%) |
| Total | 389 (100.0%) | 0 (0.0%) |
Educational Attainment by Field of Study in Arapahoe
Education (20 | 25.0%), business (17 | 21.2%), arts & humanities (13 | 16.3%), social sciences (9 | 11.3%), and psychology (7 | 8.7%) are the most common fields of study among 80 individuals in Arapahoe who have obtained a bachelor's degree or higher.
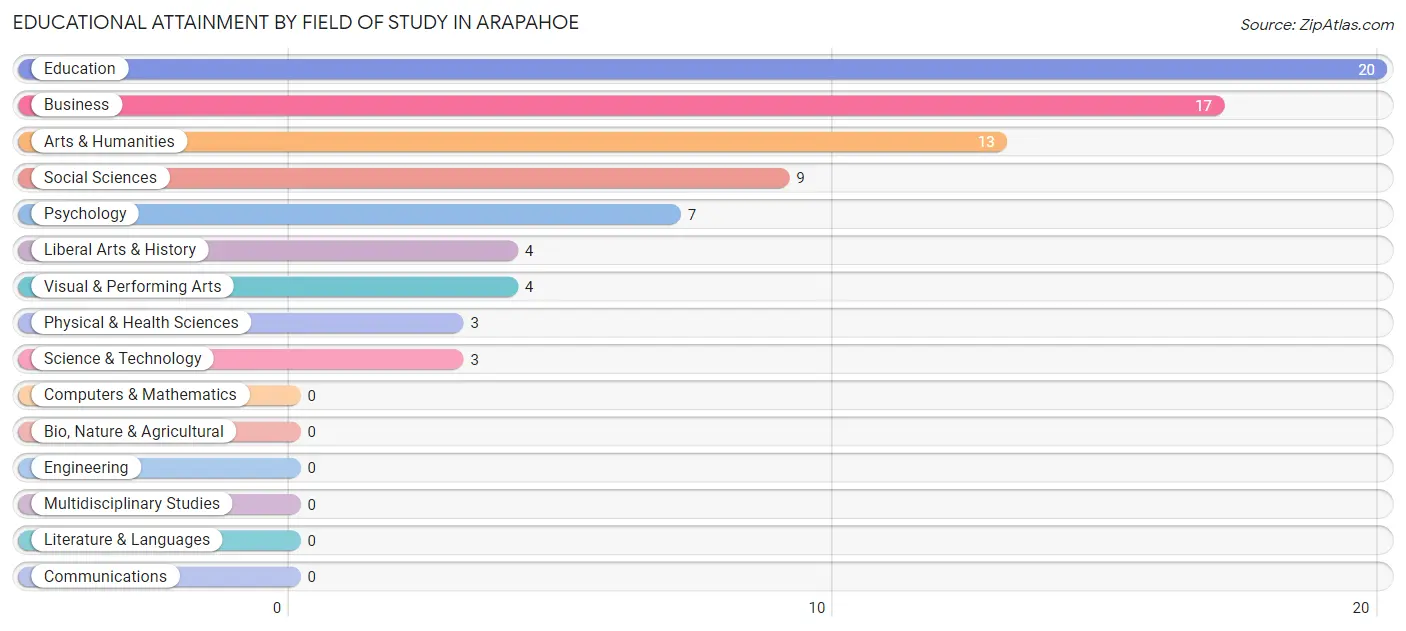
| Field of Study | # Graduates | % Graduates |
| Computers & Mathematics | 0 | 0.0% |
| Bio, Nature & Agricultural | 0 | 0.0% |
| Physical & Health Sciences | 3 | 3.7% |
| Psychology | 7 | 8.7% |
| Social Sciences | 9 | 11.3% |
| Engineering | 0 | 0.0% |
| Multidisciplinary Studies | 0 | 0.0% |
| Science & Technology | 3 | 3.7% |
| Business | 17 | 21.2% |
| Education | 20 | 25.0% |
| Literature & Languages | 0 | 0.0% |
| Liberal Arts & History | 4 | 5.0% |
| Visual & Performing Arts | 4 | 5.0% |
| Communications | 0 | 0.0% |
| Arts & Humanities | 13 | 16.3% |
| Total | 80 | 100.0% |
Transportation & Commute in Arapahoe
Vehicle Availability by Sex in Arapahoe
The most prevalent vehicle ownership categories in Arapahoe are males with 2 vehicles (131, accounting for 41.2%) and females with 2 vehicles (56, making up 60.1%).
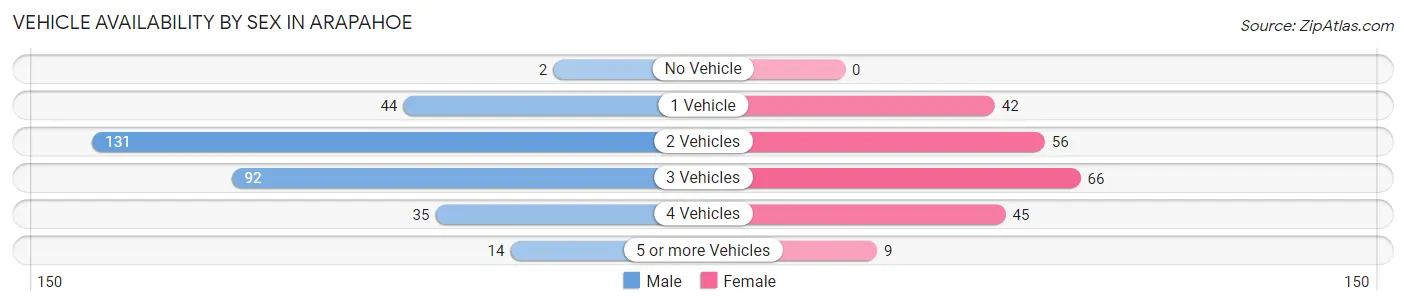
| Vehicles Available | Male | Female |
| No Vehicle | 2 (0.6%) | 0 (0.0%) |
| 1 Vehicle | 44 (13.8%) | 42 (19.3%) |
| 2 Vehicles | 131 (41.2%) | 56 (25.7%) |
| 3 Vehicles | 92 (28.9%) | 66 (30.3%) |
| 4 Vehicles | 35 (11.0%) | 45 (20.6%) |
| 5 or more Vehicles | 14 (4.4%) | 9 (4.1%) |
| Total | 318 (100.0%) | 218 (100.0%) |
Commute Time in Arapahoe
The most frequently occuring commute durations in Arapahoe are 15 to 19 minutes (137 commuters, 26.9%), 5 to 9 minutes (119 commuters, 23.3%), and 10 to 14 minutes (93 commuters, 18.2%).
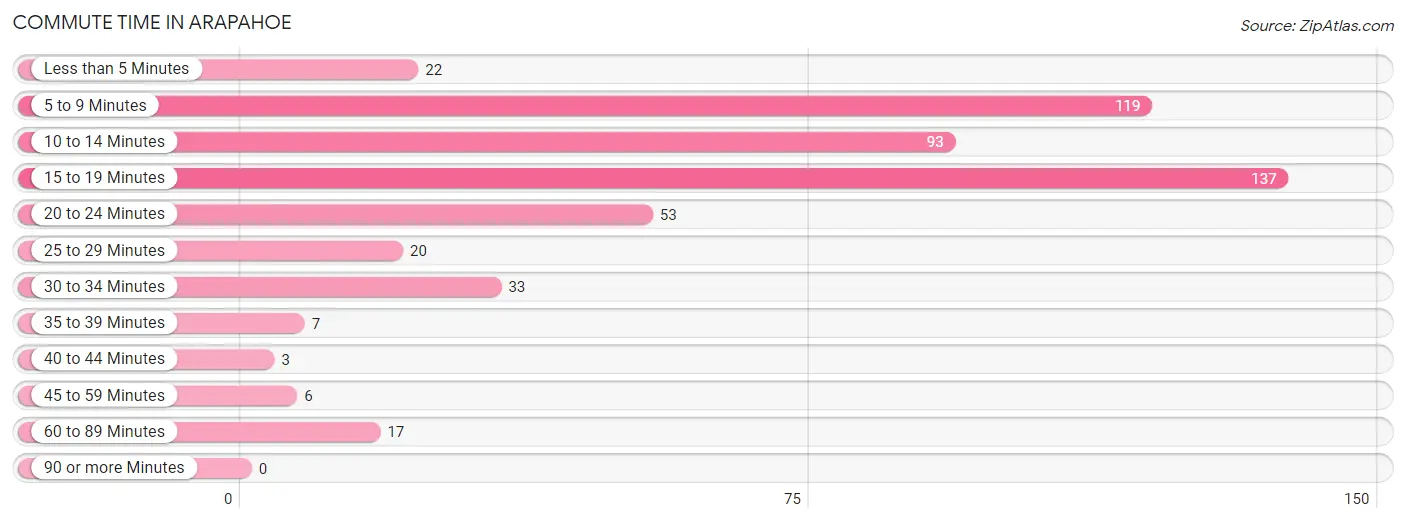
| Commute Time | # Commuters | % Commuters |
| Less than 5 Minutes | 22 | 4.3% |
| 5 to 9 Minutes | 119 | 23.3% |
| 10 to 14 Minutes | 93 | 18.2% |
| 15 to 19 Minutes | 137 | 26.9% |
| 20 to 24 Minutes | 53 | 10.4% |
| 25 to 29 Minutes | 20 | 3.9% |
| 30 to 34 Minutes | 33 | 6.5% |
| 35 to 39 Minutes | 7 | 1.4% |
| 40 to 44 Minutes | 3 | 0.6% |
| 45 to 59 Minutes | 6 | 1.2% |
| 60 to 89 Minutes | 17 | 3.3% |
| 90 or more Minutes | 0 | 0.0% |
Commute Time by Sex in Arapahoe
The most common commute times in Arapahoe are 15 to 19 minutes (109 commuters, 35.9%) for males and 10 to 14 minutes (42 commuters, 20.4%) for females.
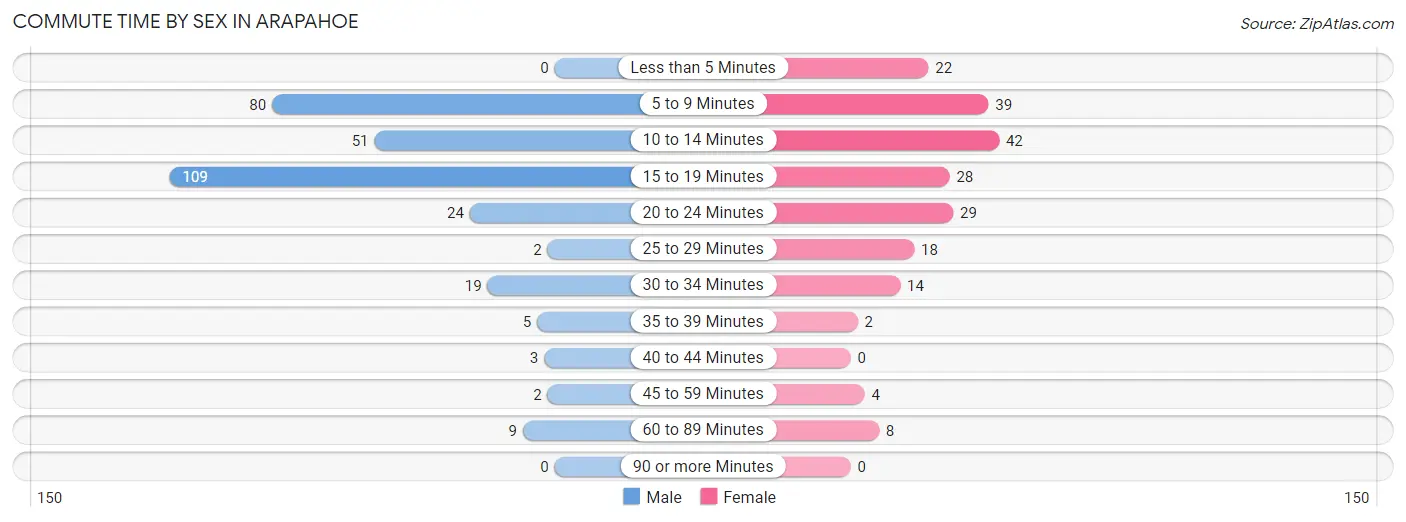
| Commute Time | Male | Female |
| Less than 5 Minutes | 0 (0.0%) | 22 (10.7%) |
| 5 to 9 Minutes | 80 (26.3%) | 39 (18.9%) |
| 10 to 14 Minutes | 51 (16.8%) | 42 (20.4%) |
| 15 to 19 Minutes | 109 (35.9%) | 28 (13.6%) |
| 20 to 24 Minutes | 24 (7.9%) | 29 (14.1%) |
| 25 to 29 Minutes | 2 (0.7%) | 18 (8.7%) |
| 30 to 34 Minutes | 19 (6.2%) | 14 (6.8%) |
| 35 to 39 Minutes | 5 (1.6%) | 2 (1.0%) |
| 40 to 44 Minutes | 3 (1.0%) | 0 (0.0%) |
| 45 to 59 Minutes | 2 (0.7%) | 4 (1.9%) |
| 60 to 89 Minutes | 9 (3.0%) | 8 (3.9%) |
| 90 or more Minutes | 0 (0.0%) | 0 (0.0%) |
Time of Departure to Work by Sex in Arapahoe
The most frequent times of departure to work in Arapahoe are 6:30 AM to 6:59 AM (66, 21.7%) for males and 7:00 AM to 7:29 AM (54, 26.2%) for females.
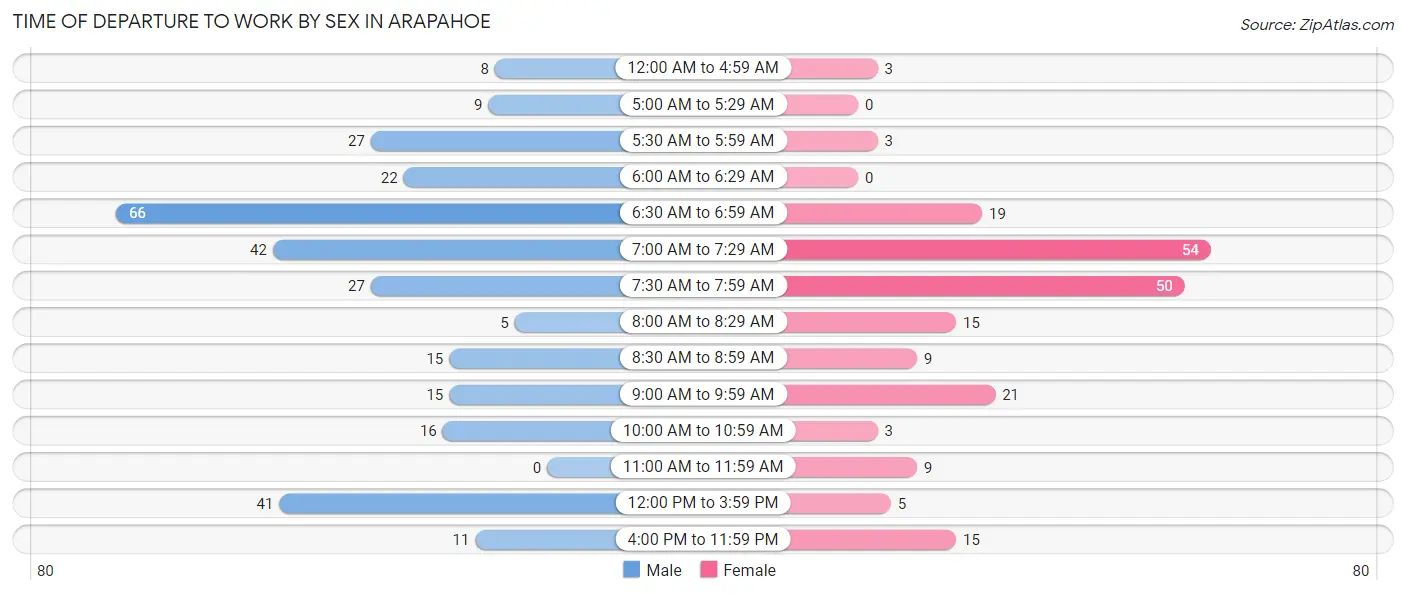
| Time of Departure | Male | Female |
| 12:00 AM to 4:59 AM | 8 (2.6%) | 3 (1.5%) |
| 5:00 AM to 5:29 AM | 9 (3.0%) | 0 (0.0%) |
| 5:30 AM to 5:59 AM | 27 (8.9%) | 3 (1.5%) |
| 6:00 AM to 6:29 AM | 22 (7.2%) | 0 (0.0%) |
| 6:30 AM to 6:59 AM | 66 (21.7%) | 19 (9.2%) |
| 7:00 AM to 7:29 AM | 42 (13.8%) | 54 (26.2%) |
| 7:30 AM to 7:59 AM | 27 (8.9%) | 50 (24.3%) |
| 8:00 AM to 8:29 AM | 5 (1.6%) | 15 (7.3%) |
| 8:30 AM to 8:59 AM | 15 (4.9%) | 9 (4.4%) |
| 9:00 AM to 9:59 AM | 15 (4.9%) | 21 (10.2%) |
| 10:00 AM to 10:59 AM | 16 (5.3%) | 3 (1.5%) |
| 11:00 AM to 11:59 AM | 0 (0.0%) | 9 (4.4%) |
| 12:00 PM to 3:59 PM | 41 (13.5%) | 5 (2.4%) |
| 4:00 PM to 11:59 PM | 11 (3.6%) | 15 (7.3%) |
| Total | 304 (100.0%) | 206 (100.0%) |
Housing Occupancy in Arapahoe
Occupancy by Ownership in Arapahoe
Of the total 403 dwellings in Arapahoe, owner-occupied units account for 281 (69.7%), while renter-occupied units make up 122 (30.3%).
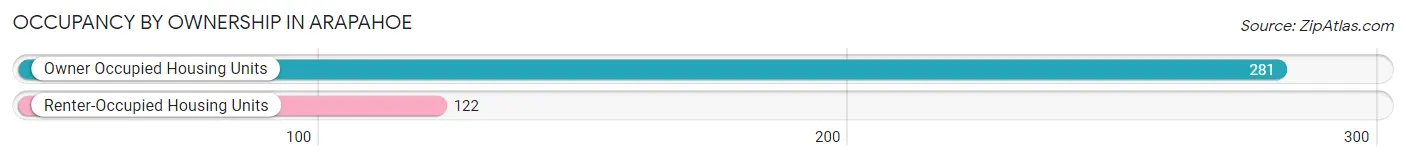
| Occupancy | # Housing Units | % Housing Units |
| Owner Occupied Housing Units | 281 | 69.7% |
| Renter-Occupied Housing Units | 122 | 30.3% |
| Total Occupied Housing Units | 403 | 100.0% |
Occupancy by Household Size in Arapahoe
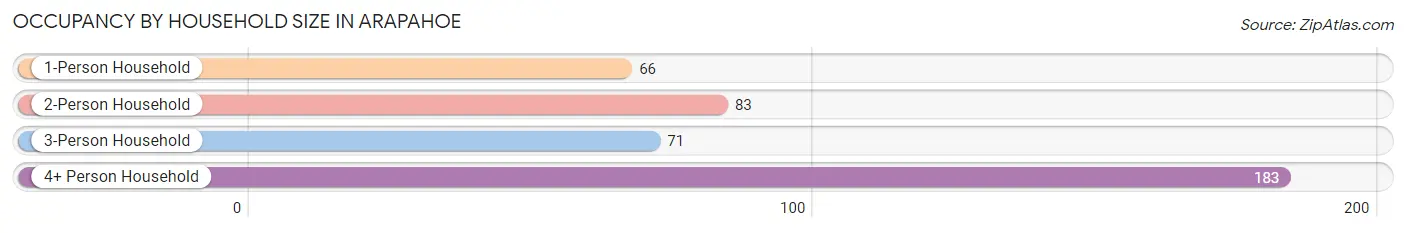
| Household Size | # Housing Units | % Housing Units |
| 1-Person Household | 66 | 16.4% |
| 2-Person Household | 83 | 20.6% |
| 3-Person Household | 71 | 17.6% |
| 4+ Person Household | 183 | 45.4% |
| Total Housing Units | 403 | 100.0% |
Occupancy by Ownership by Household Size in Arapahoe
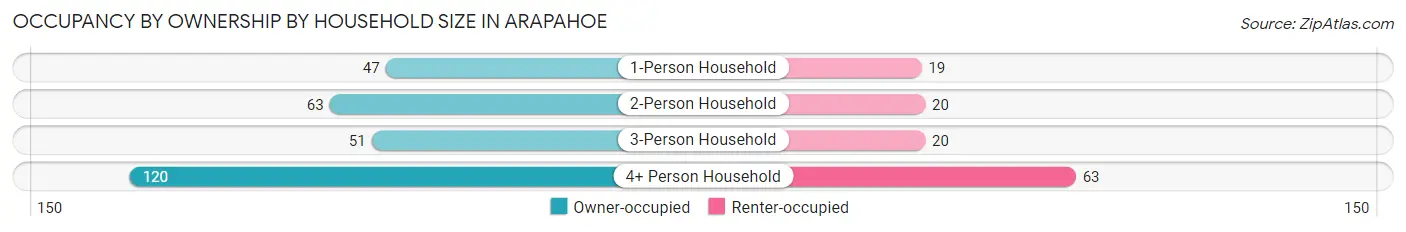
| Household Size | Owner-occupied | Renter-occupied |
| 1-Person Household | 47 (71.2%) | 19 (28.8%) |
| 2-Person Household | 63 (75.9%) | 20 (24.1%) |
| 3-Person Household | 51 (71.8%) | 20 (28.2%) |
| 4+ Person Household | 120 (65.6%) | 63 (34.4%) |
| Total Housing Units | 281 (69.7%) | 122 (30.3%) |
Occupancy by Educational Attainment in Arapahoe
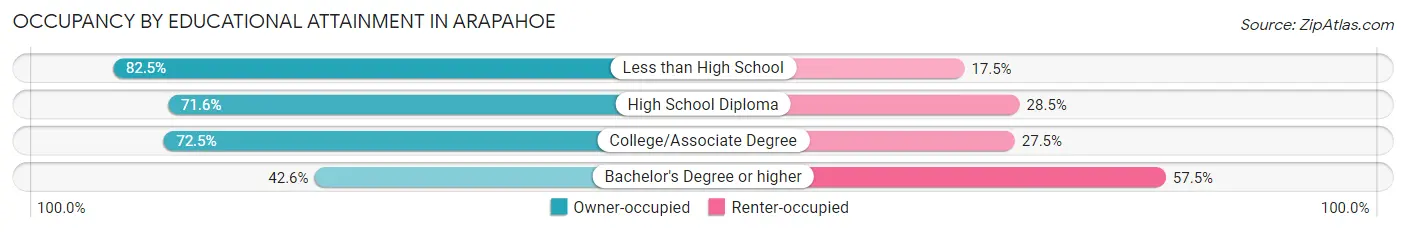
| Household Size | Owner-occupied | Renter-occupied |
| Less than High School | 33 (82.5%) | 7 (17.5%) |
| High School Diploma | 83 (71.6%) | 33 (28.4%) |
| College/Associate Degree | 145 (72.5%) | 55 (27.5%) |
| Bachelor's Degree or higher | 20 (42.5%) | 27 (57.5%) |
Occupancy by Age of Householder in Arapahoe
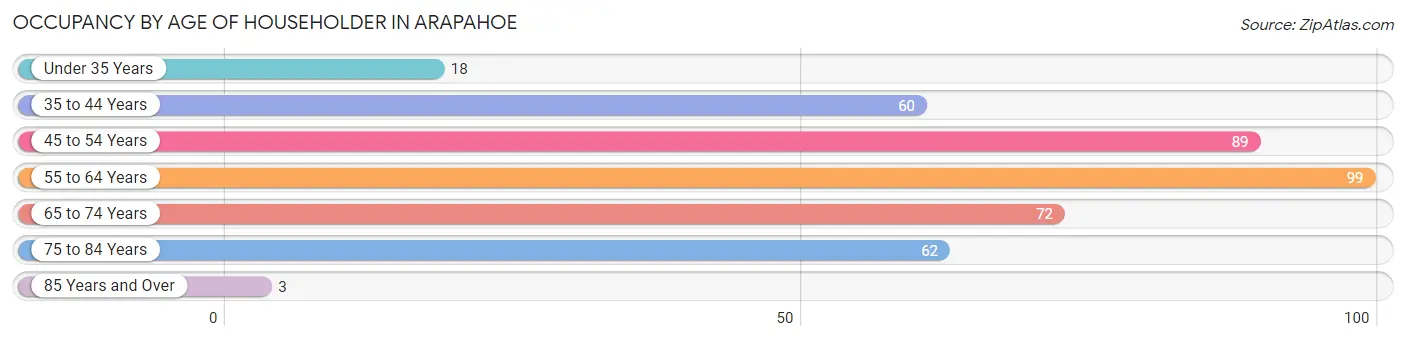
| Age Bracket | # Households | % Households |
| Under 35 Years | 18 | 4.5% |
| 35 to 44 Years | 60 | 14.9% |
| 45 to 54 Years | 89 | 22.1% |
| 55 to 64 Years | 99 | 24.6% |
| 65 to 74 Years | 72 | 17.9% |
| 75 to 84 Years | 62 | 15.4% |
| 85 Years and Over | 3 | 0.7% |
| Total | 403 | 100.0% |
Housing Finances in Arapahoe
Median Income by Occupancy in Arapahoe
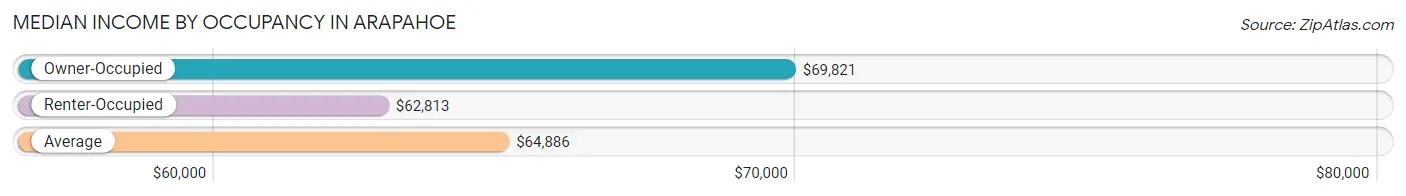
| Occupancy Type | # Households | Median Income |
| Owner-Occupied | 281 (69.7%) | $69,821 |
| Renter-Occupied | 122 (30.3%) | $62,813 |
| Average | 403 (100.0%) | $64,886 |
Occupancy by Householder Income Bracket in Arapahoe
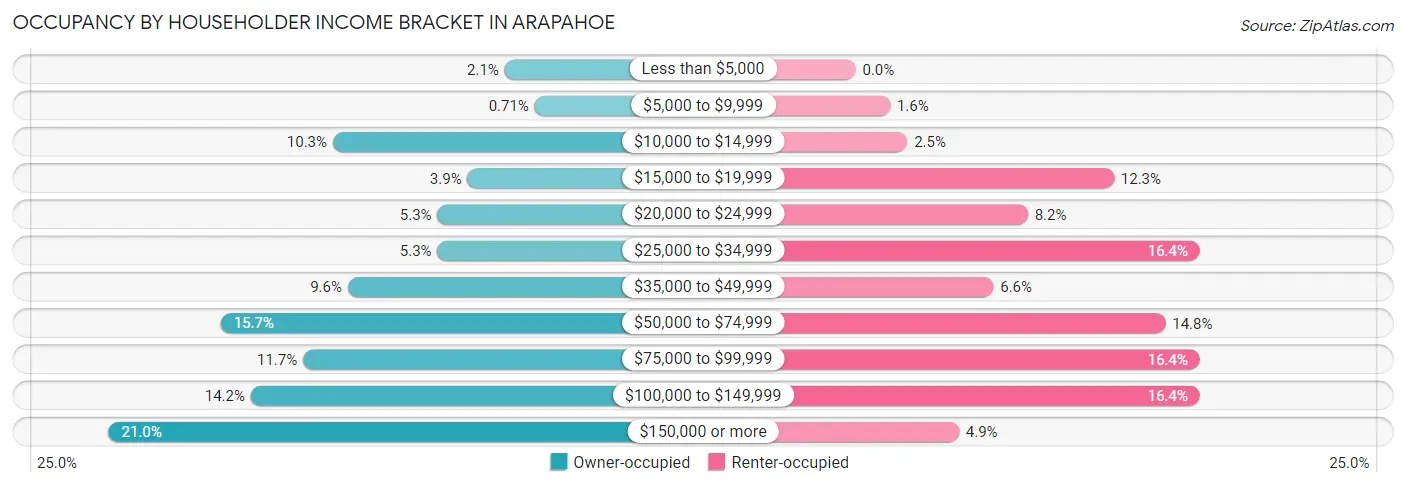
| Income Bracket | Owner-occupied | Renter-occupied |
| Less than $5,000 | 6 (2.1%) | 0 (0.0%) |
| $5,000 to $9,999 | 2 (0.7%) | 2 (1.6%) |
| $10,000 to $14,999 | 29 (10.3%) | 3 (2.5%) |
| $15,000 to $19,999 | 11 (3.9%) | 15 (12.3%) |
| $20,000 to $24,999 | 15 (5.3%) | 10 (8.2%) |
| $25,000 to $34,999 | 15 (5.3%) | 20 (16.4%) |
| $35,000 to $49,999 | 27 (9.6%) | 8 (6.6%) |
| $50,000 to $74,999 | 44 (15.7%) | 18 (14.7%) |
| $75,000 to $99,999 | 33 (11.7%) | 20 (16.4%) |
| $100,000 to $149,999 | 40 (14.2%) | 20 (16.4%) |
| $150,000 or more | 59 (21.0%) | 6 (4.9%) |
| Total | 281 (100.0%) | 122 (100.0%) |
Monthly Housing Cost Tiers in Arapahoe
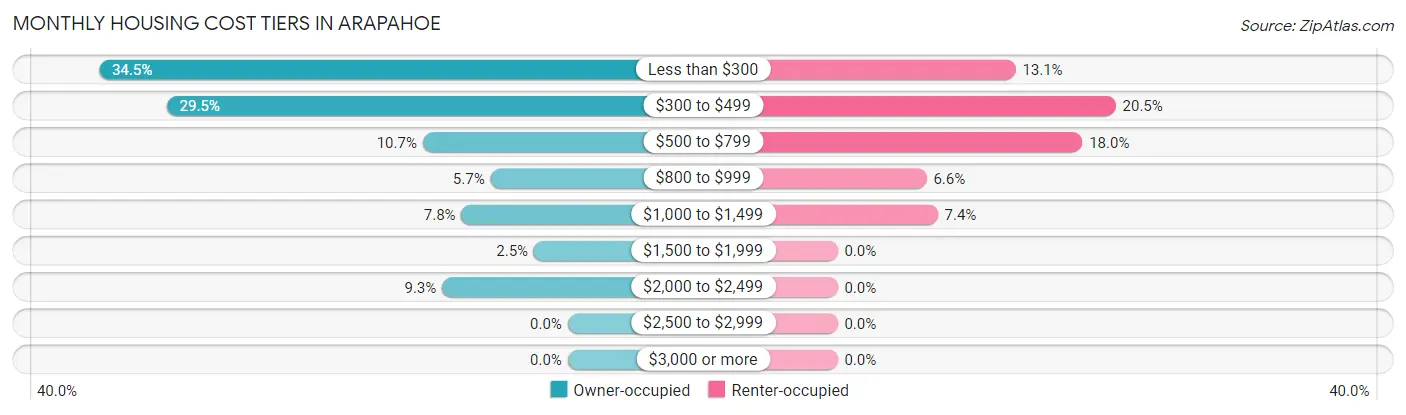
| Monthly Cost | Owner-occupied | Renter-occupied |
| Less than $300 | 97 (34.5%) | 16 (13.1%) |
| $300 to $499 | 83 (29.5%) | 25 (20.5%) |
| $500 to $799 | 30 (10.7%) | 22 (18.0%) |
| $800 to $999 | 16 (5.7%) | 8 (6.6%) |
| $1,000 to $1,499 | 22 (7.8%) | 9 (7.4%) |
| $1,500 to $1,999 | 7 (2.5%) | 0 (0.0%) |
| $2,000 to $2,499 | 26 (9.2%) | 0 (0.0%) |
| $2,500 to $2,999 | 0 (0.0%) | 0 (0.0%) |
| $3,000 or more | 0 (0.0%) | 0 (0.0%) |
| Total | 281 (100.0%) | 122 (100.0%) |
Physical Housing Characteristics in Arapahoe
Housing Structures in Arapahoe
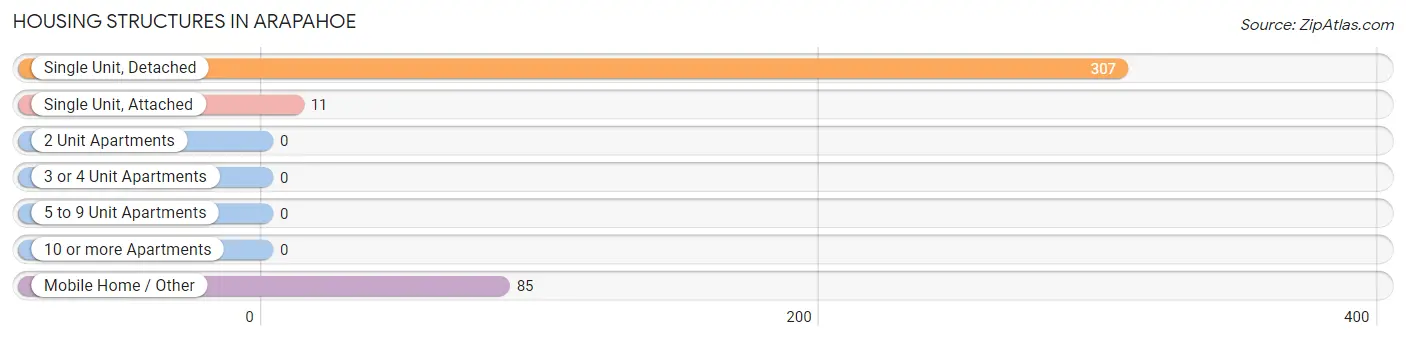
| Structure Type | # Housing Units | % Housing Units |
| Single Unit, Detached | 307 | 76.2% |
| Single Unit, Attached | 11 | 2.7% |
| 2 Unit Apartments | 0 | 0.0% |
| 3 or 4 Unit Apartments | 0 | 0.0% |
| 5 to 9 Unit Apartments | 0 | 0.0% |
| 10 or more Apartments | 0 | 0.0% |
| Mobile Home / Other | 85 | 21.1% |
| Total | 403 | 100.0% |
Housing Structures by Occupancy in Arapahoe
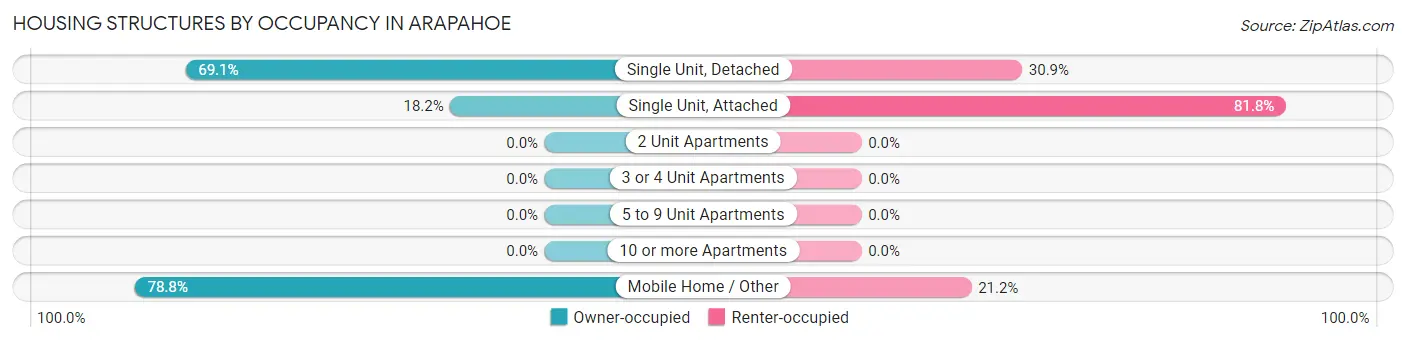
| Structure Type | Owner-occupied | Renter-occupied |
| Single Unit, Detached | 212 (69.1%) | 95 (30.9%) |
| Single Unit, Attached | 2 (18.2%) | 9 (81.8%) |
| 2 Unit Apartments | 0 (0.0%) | 0 (0.0%) |
| 3 or 4 Unit Apartments | 0 (0.0%) | 0 (0.0%) |
| 5 to 9 Unit Apartments | 0 (0.0%) | 0 (0.0%) |
| 10 or more Apartments | 0 (0.0%) | 0 (0.0%) |
| Mobile Home / Other | 67 (78.8%) | 18 (21.2%) |
| Total | 281 (69.7%) | 122 (30.3%) |
Housing Structures by Number of Rooms in Arapahoe
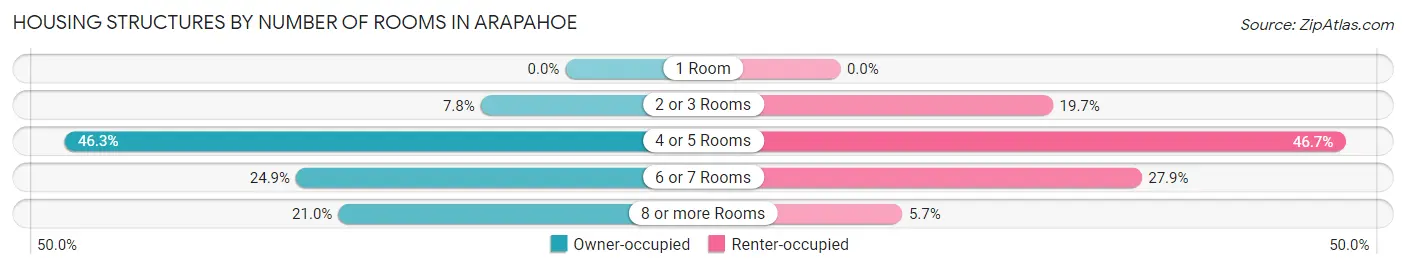
| Number of Rooms | Owner-occupied | Renter-occupied |
| 1 Room | 0 (0.0%) | 0 (0.0%) |
| 2 or 3 Rooms | 22 (7.8%) | 24 (19.7%) |
| 4 or 5 Rooms | 130 (46.3%) | 57 (46.7%) |
| 6 or 7 Rooms | 70 (24.9%) | 34 (27.9%) |
| 8 or more Rooms | 59 (21.0%) | 7 (5.7%) |
| Total | 281 (100.0%) | 122 (100.0%) |
Housing Structure by Heating Type in Arapahoe
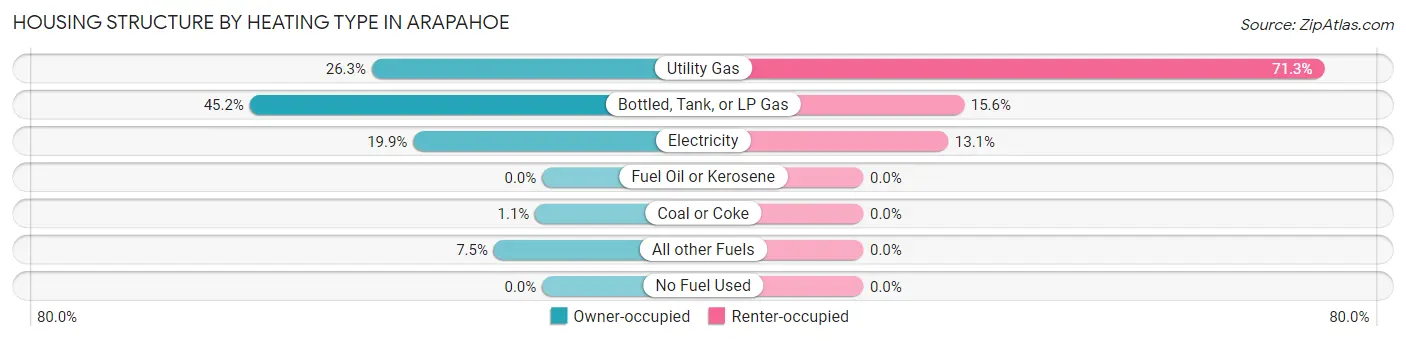
| Heating Type | Owner-occupied | Renter-occupied |
| Utility Gas | 74 (26.3%) | 87 (71.3%) |
| Bottled, Tank, or LP Gas | 127 (45.2%) | 19 (15.6%) |
| Electricity | 56 (19.9%) | 16 (13.1%) |
| Fuel Oil or Kerosene | 0 (0.0%) | 0 (0.0%) |
| Coal or Coke | 3 (1.1%) | 0 (0.0%) |
| All other Fuels | 21 (7.5%) | 0 (0.0%) |
| No Fuel Used | 0 (0.0%) | 0 (0.0%) |
| Total | 281 (100.0%) | 122 (100.0%) |
Household Vehicle Usage in Arapahoe
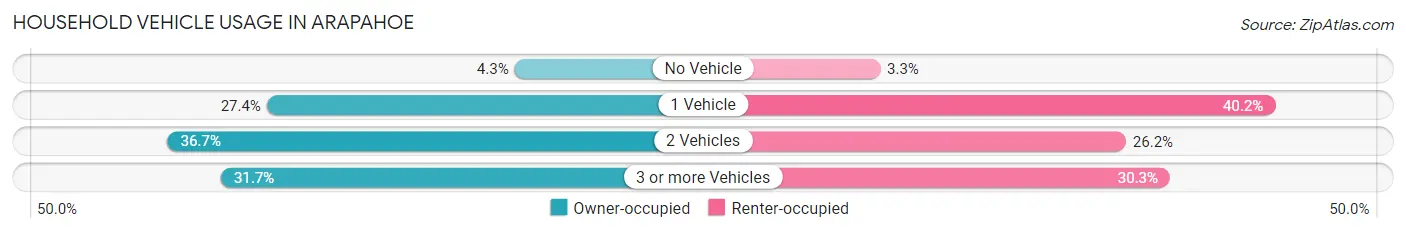
| Vehicles per Household | Owner-occupied | Renter-occupied |
| No Vehicle | 12 (4.3%) | 4 (3.3%) |
| 1 Vehicle | 77 (27.4%) | 49 (40.2%) |
| 2 Vehicles | 103 (36.6%) | 32 (26.2%) |
| 3 or more Vehicles | 89 (31.7%) | 37 (30.3%) |
| Total | 281 (100.0%) | 122 (100.0%) |
Real Estate & Mortgages in Arapahoe
Real Estate and Mortgage Overview in Arapahoe
| Characteristic | Without Mortgage | With Mortgage |
| Housing Units | 206 | 75 |
| Median Property Value | $135,300 | $301,800 |
| Median Household Income | $52,188 | $41 |
| Monthly Housing Costs | $315 | $0 |
| Real Estate Taxes | $1,023 | $46 |
Property Value by Mortgage Status in Arapahoe
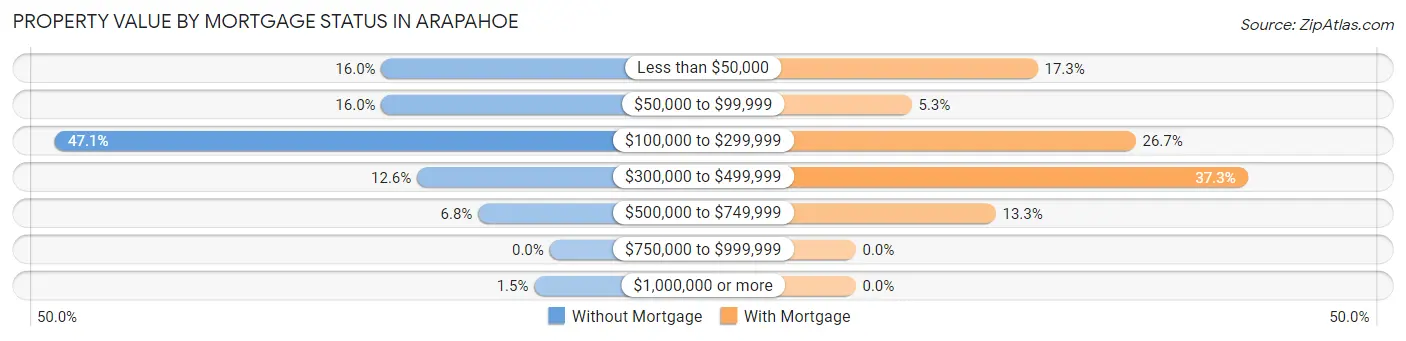
| Property Value | Without Mortgage | With Mortgage |
| Less than $50,000 | 33 (16.0%) | 13 (17.3%) |
| $50,000 to $99,999 | 33 (16.0%) | 4 (5.3%) |
| $100,000 to $299,999 | 97 (47.1%) | 20 (26.7%) |
| $300,000 to $499,999 | 26 (12.6%) | 28 (37.3%) |
| $500,000 to $749,999 | 14 (6.8%) | 10 (13.3%) |
| $750,000 to $999,999 | 0 (0.0%) | 0 (0.0%) |
| $1,000,000 or more | 3 (1.5%) | 0 (0.0%) |
| Total | 206 (100.0%) | 75 (100.0%) |
Household Income by Mortgage Status in Arapahoe
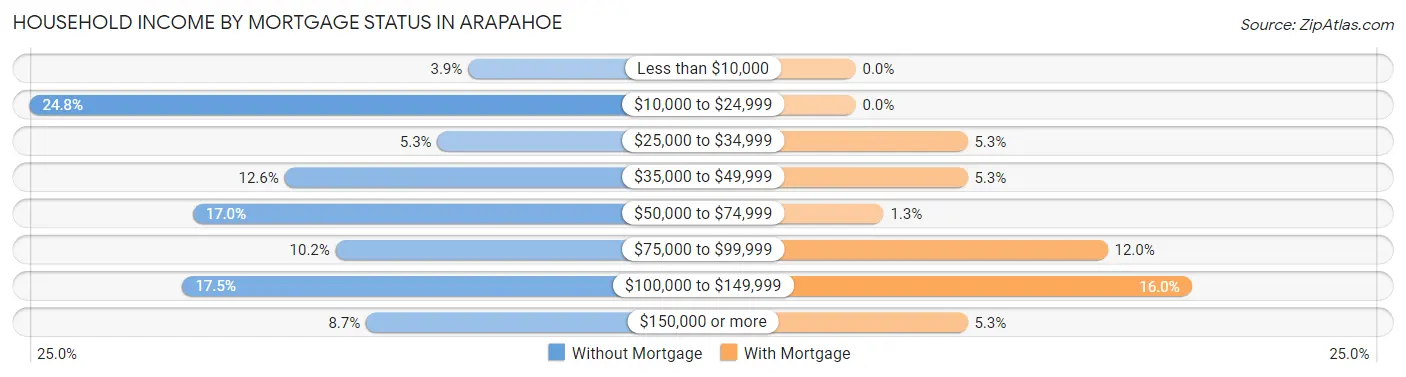
| Household Income | Without Mortgage | With Mortgage |
| Less than $10,000 | 8 (3.9%) | 0 (0.0%) |
| $10,000 to $24,999 | 51 (24.8%) | 0 (0.0%) |
| $25,000 to $34,999 | 11 (5.3%) | 4 (5.3%) |
| $35,000 to $49,999 | 26 (12.6%) | 4 (5.3%) |
| $50,000 to $74,999 | 35 (17.0%) | 1 (1.3%) |
| $75,000 to $99,999 | 21 (10.2%) | 9 (12.0%) |
| $100,000 to $149,999 | 36 (17.5%) | 12 (16.0%) |
| $150,000 or more | 18 (8.7%) | 4 (5.3%) |
| Total | 206 (100.0%) | 75 (100.0%) |
Property Value to Household Income Ratio in Arapahoe
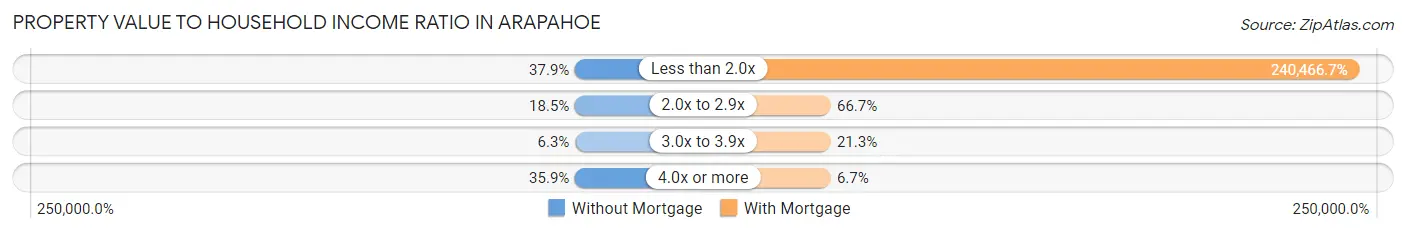
| Value-to-Income Ratio | Without Mortgage | With Mortgage |
| Less than 2.0x | 78 (37.9%) | 180,350 (240,466.7%) |
| 2.0x to 2.9x | 38 (18.4%) | 50 (66.7%) |
| 3.0x to 3.9x | 13 (6.3%) | 16 (21.3%) |
| 4.0x or more | 74 (35.9%) | 5 (6.7%) |
| Total | 206 (100.0%) | 75 (100.0%) |
Real Estate Taxes by Mortgage Status in Arapahoe
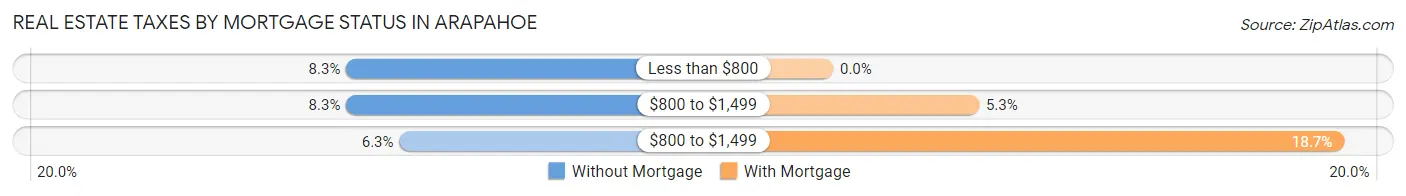
| Property Taxes | Without Mortgage | With Mortgage |
| Less than $800 | 17 (8.3%) | 0 (0.0%) |
| $800 to $1,499 | 17 (8.3%) | 4 (5.3%) |
| $800 to $1,499 | 13 (6.3%) | 14 (18.7%) |
| Total | 206 (100.0%) | 75 (100.0%) |
Health & Disability in Arapahoe
Health Insurance Coverage by Age in Arapahoe
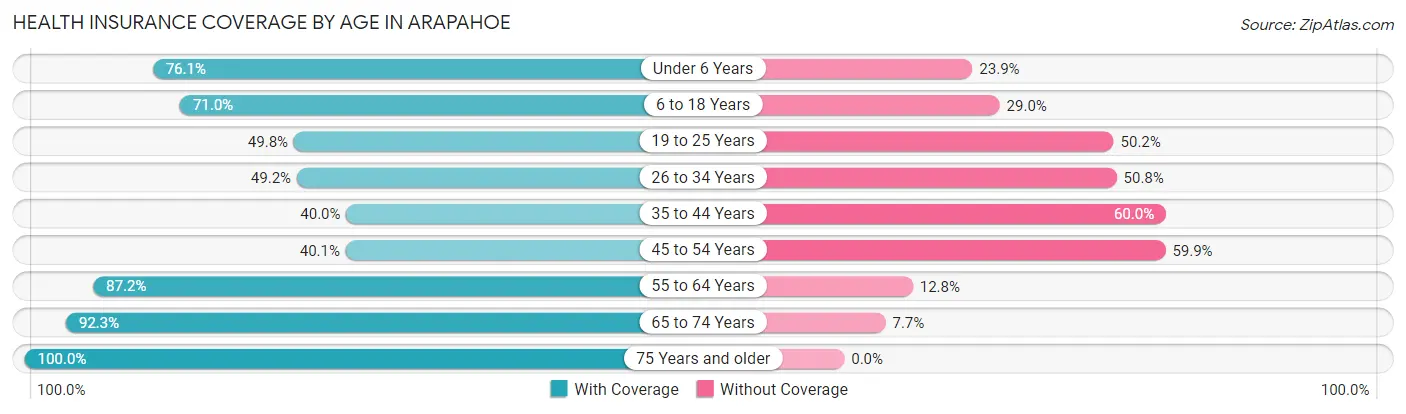
| Age Bracket | With Coverage | Without Coverage |
| Under 6 Years | 86 (76.1%) | 27 (23.9%) |
| 6 to 18 Years | 255 (71.0%) | 104 (29.0%) |
| 19 to 25 Years | 112 (49.8%) | 113 (50.2%) |
| 26 to 34 Years | 63 (49.2%) | 65 (50.8%) |
| 35 to 44 Years | 76 (40.0%) | 114 (60.0%) |
| 45 to 54 Years | 75 (40.1%) | 112 (59.9%) |
| 55 to 64 Years | 157 (87.2%) | 23 (12.8%) |
| 65 to 74 Years | 120 (92.3%) | 10 (7.7%) |
| 75 Years and older | 84 (100.0%) | 0 (0.0%) |
| Total | 1,028 (64.4%) | 568 (35.6%) |
Health Insurance Coverage by Citizenship Status in Arapahoe
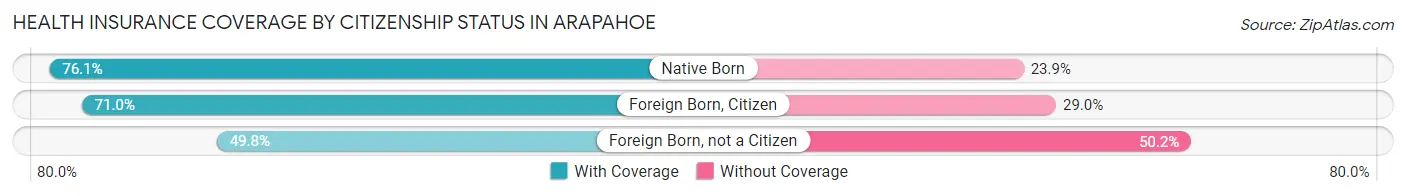
| Citizenship Status | With Coverage | Without Coverage |
| Native Born | 86 (76.1%) | 27 (23.9%) |
| Foreign Born, Citizen | 255 (71.0%) | 104 (29.0%) |
| Foreign Born, not a Citizen | 112 (49.8%) | 113 (50.2%) |
Health Insurance Coverage by Household Income in Arapahoe
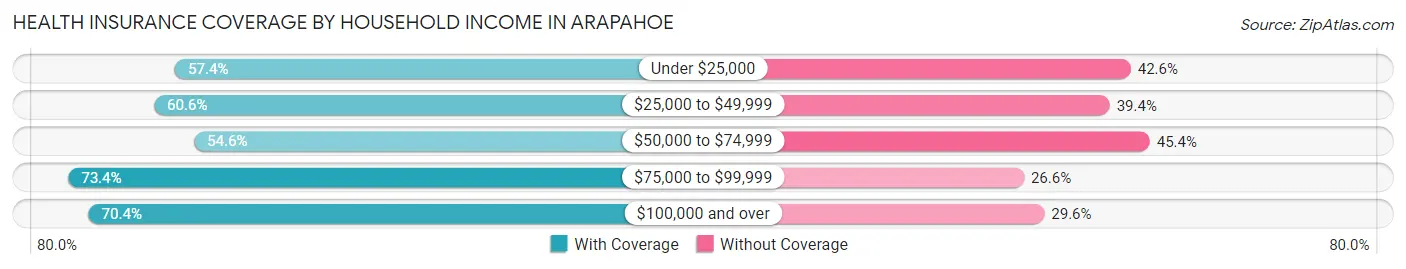
| Household Income | With Coverage | Without Coverage |
| Under $25,000 | 143 (57.4%) | 106 (42.6%) |
| $25,000 to $49,999 | 143 (60.6%) | 93 (39.4%) |
| $50,000 to $74,999 | 161 (54.6%) | 134 (45.4%) |
| $75,000 to $99,999 | 177 (73.4%) | 64 (26.6%) |
| $100,000 and over | 397 (70.4%) | 167 (29.6%) |
Public vs Private Health Insurance Coverage by Age in Arapahoe
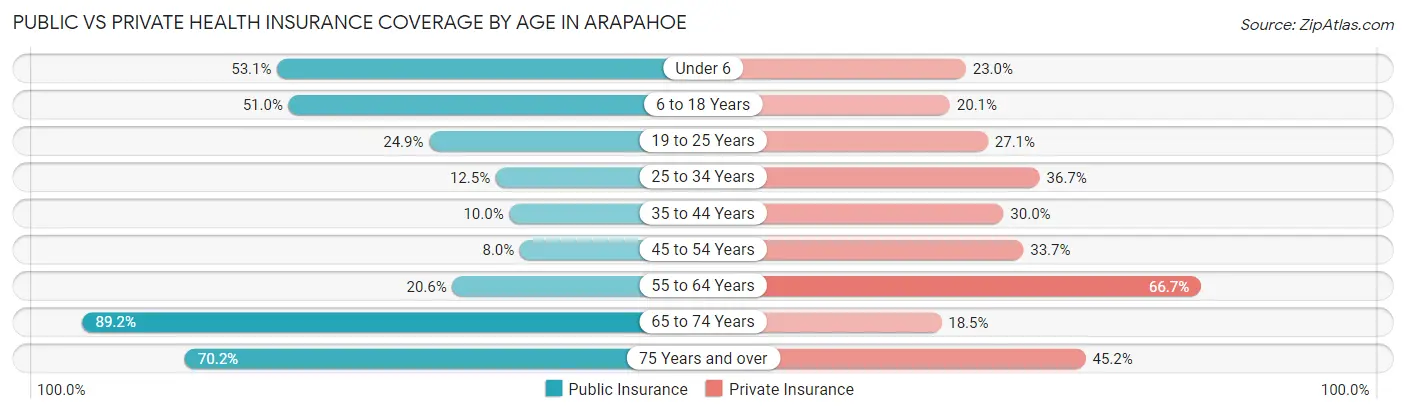
| Age Bracket | Public Insurance | Private Insurance |
| Under 6 | 60 (53.1%) | 26 (23.0%) |
| 6 to 18 Years | 183 (51.0%) | 72 (20.1%) |
| 19 to 25 Years | 56 (24.9%) | 61 (27.1%) |
| 25 to 34 Years | 16 (12.5%) | 47 (36.7%) |
| 35 to 44 Years | 19 (10.0%) | 57 (30.0%) |
| 45 to 54 Years | 15 (8.0%) | 63 (33.7%) |
| 55 to 64 Years | 37 (20.6%) | 120 (66.7%) |
| 65 to 74 Years | 116 (89.2%) | 24 (18.5%) |
| 75 Years and over | 59 (70.2%) | 38 (45.2%) |
| Total | 561 (35.1%) | 508 (31.8%) |
Disability Status by Sex by Age in Arapahoe
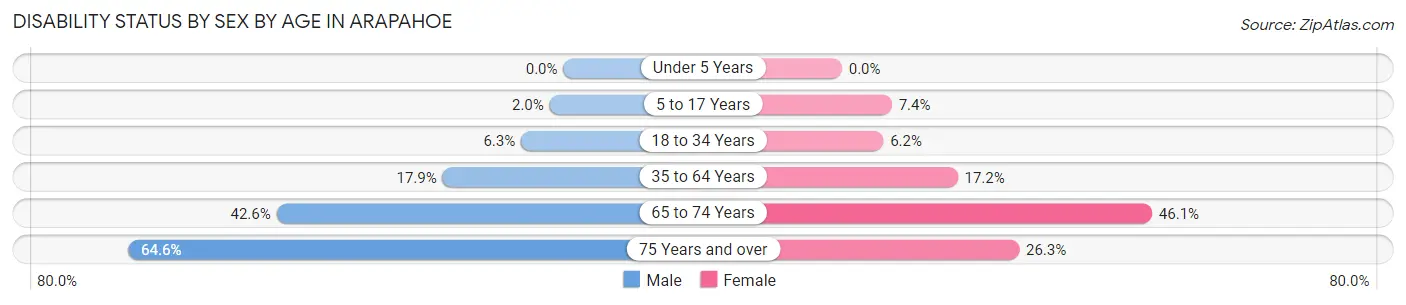
| Age Bracket | Male | Female |
| Under 5 Years | 0 (0.0%) | 0 (0.0%) |
| 5 to 17 Years | 4 (2.0%) | 12 (7.4%) |
| 18 to 34 Years | 13 (6.3%) | 11 (6.1%) |
| 35 to 64 Years | 54 (17.9%) | 44 (17.2%) |
| 65 to 74 Years | 23 (42.6%) | 35 (46.1%) |
| 75 Years and over | 42 (64.6%) | 5 (26.3%) |
Disability Class by Sex by Age in Arapahoe
Disability Class: Hearing Difficulty
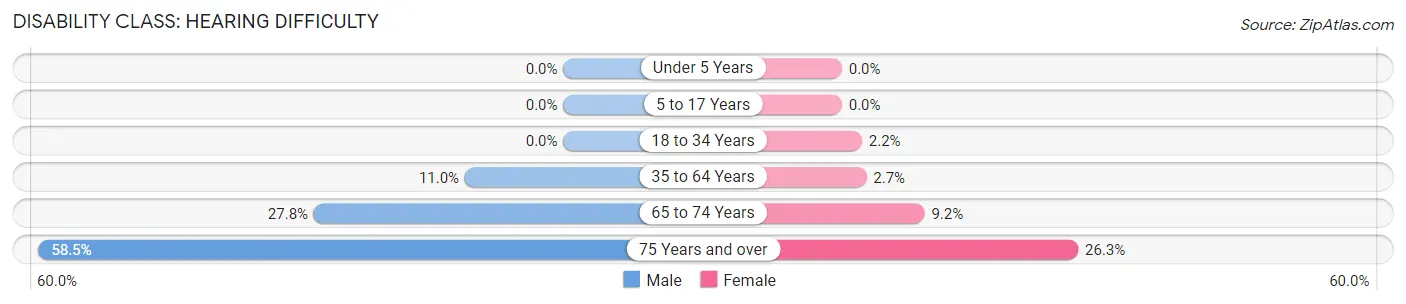
| Age Bracket | Male | Female |
| Under 5 Years | 0 (0.0%) | 0 (0.0%) |
| 5 to 17 Years | 0 (0.0%) | 0 (0.0%) |
| 18 to 34 Years | 0 (0.0%) | 4 (2.2%) |
| 35 to 64 Years | 33 (11.0%) | 7 (2.7%) |
| 65 to 74 Years | 15 (27.8%) | 7 (9.2%) |
| 75 Years and over | 38 (58.5%) | 5 (26.3%) |
Disability Class: Vision Difficulty
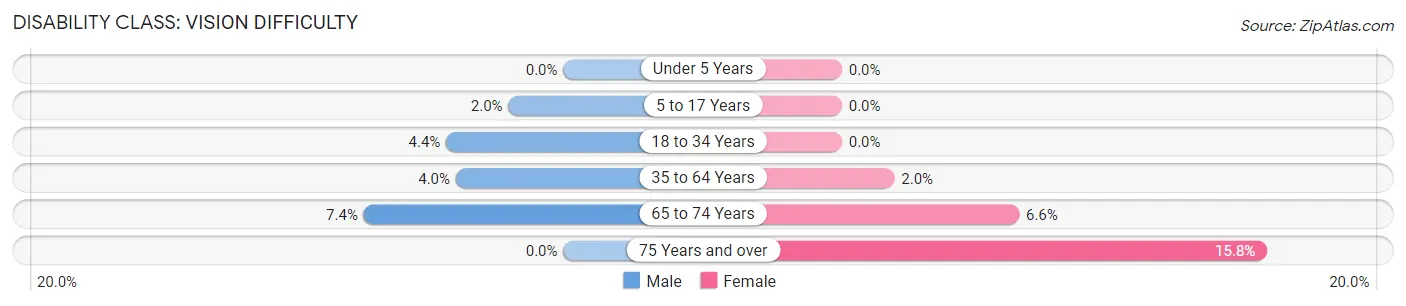
| Age Bracket | Male | Female |
| Under 5 Years | 0 (0.0%) | 0 (0.0%) |
| 5 to 17 Years | 4 (2.0%) | 0 (0.0%) |
| 18 to 34 Years | 9 (4.3%) | 0 (0.0%) |
| 35 to 64 Years | 12 (4.0%) | 5 (1.9%) |
| 65 to 74 Years | 4 (7.4%) | 5 (6.6%) |
| 75 Years and over | 0 (0.0%) | 3 (15.8%) |
Disability Class: Cognitive Difficulty
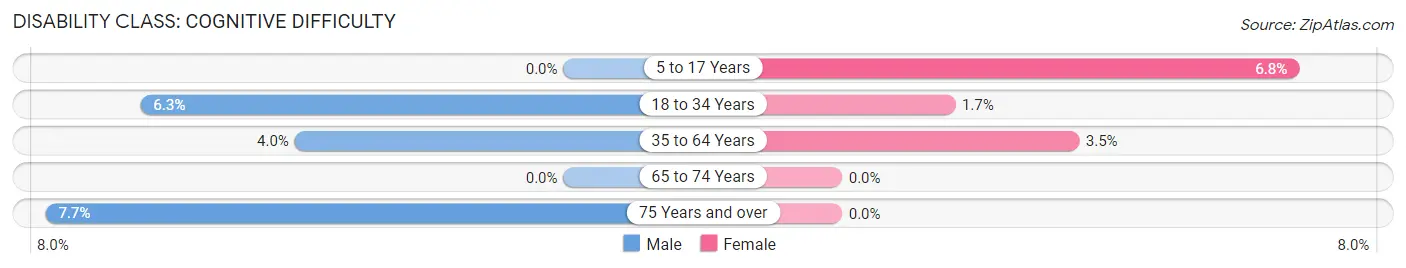
| Age Bracket | Male | Female |
| 5 to 17 Years | 0 (0.0%) | 11 (6.8%) |
| 18 to 34 Years | 13 (6.3%) | 3 (1.7%) |
| 35 to 64 Years | 12 (4.0%) | 9 (3.5%) |
| 65 to 74 Years | 0 (0.0%) | 0 (0.0%) |
| 75 Years and over | 5 (7.7%) | 0 (0.0%) |
Disability Class: Ambulatory Difficulty
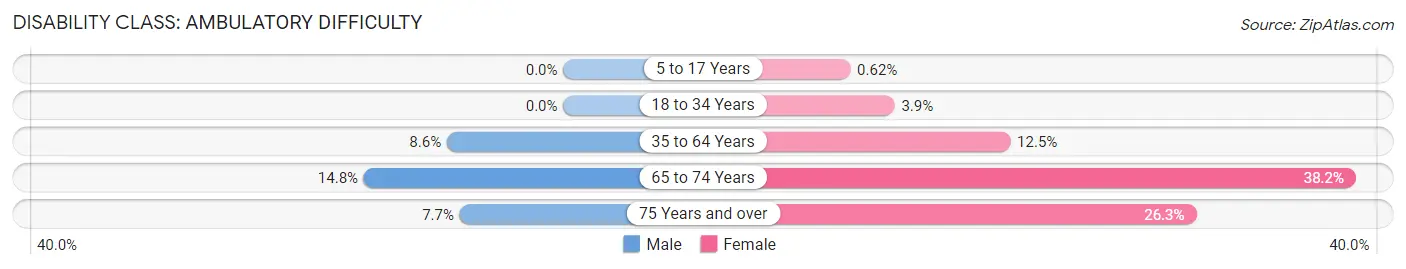
| Age Bracket | Male | Female |
| 5 to 17 Years | 0 (0.0%) | 1 (0.6%) |
| 18 to 34 Years | 0 (0.0%) | 7 (3.9%) |
| 35 to 64 Years | 26 (8.6%) | 32 (12.5%) |
| 65 to 74 Years | 8 (14.8%) | 29 (38.2%) |
| 75 Years and over | 5 (7.7%) | 5 (26.3%) |
Disability Class: Self-Care Difficulty
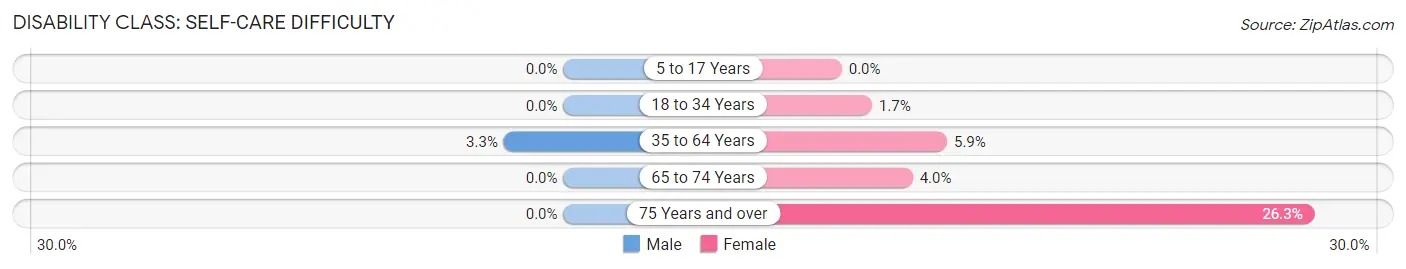
| Age Bracket | Male | Female |
| 5 to 17 Years | 0 (0.0%) | 0 (0.0%) |
| 18 to 34 Years | 0 (0.0%) | 3 (1.7%) |
| 35 to 64 Years | 10 (3.3%) | 15 (5.9%) |
| 65 to 74 Years | 0 (0.0%) | 3 (4.0%) |
| 75 Years and over | 0 (0.0%) | 5 (26.3%) |
Technology Access in Arapahoe
Computing Device Access in Arapahoe
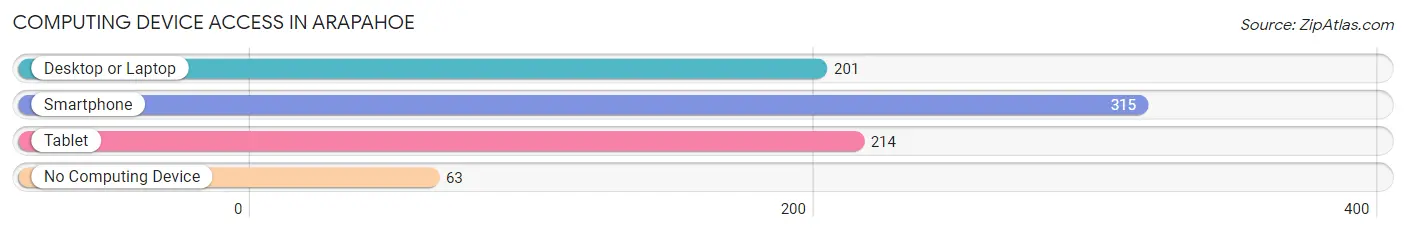
| Device Type | # Households | % Households |
| Desktop or Laptop | 201 | 49.9% |
| Smartphone | 315 | 78.2% |
| Tablet | 214 | 53.1% |
| No Computing Device | 63 | 15.6% |
| Total | 403 | 100.0% |
Internet Access in Arapahoe
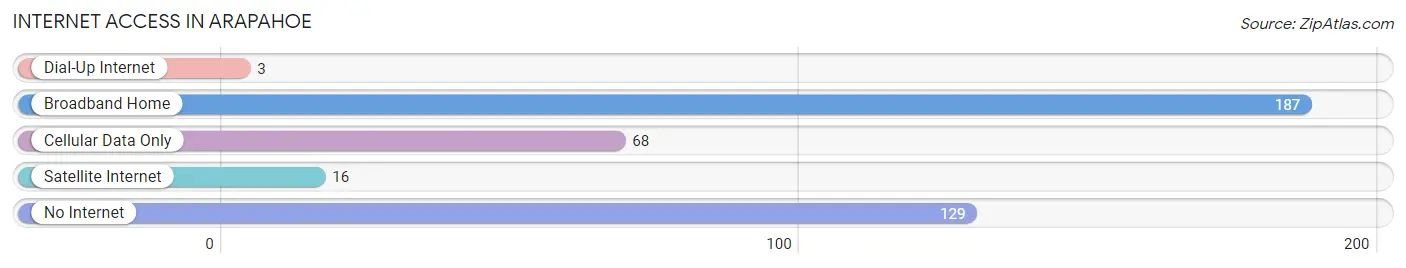
| Internet Type | # Households | % Households |
| Dial-Up Internet | 3 | 0.7% |
| Broadband Home | 187 | 46.4% |
| Cellular Data Only | 68 | 16.9% |
| Satellite Internet | 16 | 4.0% |
| No Internet | 129 | 32.0% |
| Total | 403 | 100.0% |
Arapahoe Summary
Arapahoe, Wyoming is a small town located in the southeastern corner of the state. It is situated in the foothills of the Wind River Range, and is surrounded by the vast expanse of the Great Plains. The town has a population of just over 500 people, and is the county seat of Fremont County.
History
The area around Arapahoe has been inhabited for thousands of years by the Arapaho people, who were part of the larger Algonquian language family. The Arapaho were nomadic hunter-gatherers who moved seasonally in search of food and resources. They were known for their skill in hunting buffalo, and for their ability to survive in the harsh environment of the Great Plains.
The first Europeans to visit the area were fur traders, who arrived in the early 1800s. The area was later explored by the Lewis and Clark expedition in 1805. In 1868, the Union Pacific Railroad was built through the area, and the town of Arapahoe was established in 1871. The town was named after the Arapaho people, and was the first settlement in Fremont County.
Geography
Arapahoe is located in the southeastern corner of Wyoming, in the foothills of the Wind River Range. The town is situated at an elevation of 5,400 feet, and is surrounded by the vast expanse of the Great Plains. The town is located near the Wind River, which is a tributary of the Green River. The area is known for its wide open spaces, and is home to a variety of wildlife, including deer, elk, antelope, and bighorn sheep.
The climate in Arapahoe is semi-arid, with hot summers and cold winters. The average annual temperature is around 50 degrees Fahrenheit, and the average annual precipitation is around 12 inches.
Economy
The economy of Arapahoe is largely based on agriculture and ranching. The town is home to several large ranches, and the surrounding area is used for grazing cattle and sheep. The town is also home to several small businesses, including a grocery store, a hardware store, and a restaurant.
The town is also home to a small tourist industry, as it is located near several popular outdoor recreation areas, including the Wind River Range and the Flaming Gorge National Recreation Area.
Demographics
As of the 2010 census, the population of Arapahoe was 514. The racial makeup of the town was 95.3% White, 0.6% African American, 0.4% Native American, 0.2% Asian, 0.2% Pacific Islander, and 3.3% from other races. The median household income was $37,500, and the median family income was $41,250.
The town is served by the Fremont County School District, which includes two elementary schools, one middle school, and one high school. The town is also home to a branch of the University of Wyoming.
Conclusion
Arapahoe, Wyoming is a small town located in the southeastern corner of the state. It is situated in the foothills of the Wind River Range, and is surrounded by the vast expanse of the Great Plains. The town has a population of just over 500 people, and is the county seat of Fremont County. The economy of Arapahoe is largely based on agriculture and ranching, and the town is also home to a small tourist industry. The town is served by the Fremont County School District, and is home to a branch of the University of Wyoming.
Common Questions
What is Per Capita Income in Arapahoe?
Per Capita income in Arapahoe is $23,312.
What is the Median Family Income in Arapahoe?
Median Family Income in Arapahoe is $64,432.
What is the Median Household income in Arapahoe?
Median Household Income in Arapahoe is $64,886.
What is Income or Wage Gap in Arapahoe?
Income or Wage Gap in Arapahoe is 17.0%.
Women in Arapahoe earn 83.0 cents for every dollar earned by a man.
What is Family Income Deficit in Arapahoe?
Family Income Deficit in Arapahoe is $9,059.
Families that are below poverty line in Arapahoe earn $9,059 less on average than the poverty threshold level.
What is Inequality or Gini Index in Arapahoe?
Inequality or Gini Index in Arapahoe is 0.46.
What is the Total Population of Arapahoe?
Total Population of Arapahoe is 1,596.
What is the Total Male Population of Arapahoe?
Total Male Population of Arapahoe is 877.
What is the Total Female Population of Arapahoe?
Total Female Population of Arapahoe is 719.
What is the Ratio of Males per 100 Females in Arapahoe?
There are 121.97 Males per 100 Females in Arapahoe.
What is the Ratio of Females per 100 Males in Arapahoe?
There are 81.98 Females per 100 Males in Arapahoe.
What is the Median Population Age in Arapahoe?
Median Population Age in Arapahoe is 32.5 Years.
What is the Average Family Size in Arapahoe
Average Family Size in Arapahoe is 4.3 People.
What is the Average Household Size in Arapahoe
Average Household Size in Arapahoe is 3.9 People.
How Large is the Labor Force in Arapahoe?
There are 716 People in the Labor Forcein in Arapahoe.
What is the Percentage of People in the Labor Force in Arapahoe?
58.4% of People are in the Labor Force in Arapahoe.
What is the Unemployment Rate in Arapahoe?
Unemployment Rate in Arapahoe is 18.6%.