Pinedale, WY Map & Demographics
Pinedale Map
Pinedale Overview
$57,316
PER CAPITA INCOME
$96,190
AVG FAMILY INCOME
$95,120
AVG HOUSEHOLD INCOME
36.8%
WAGE / INCOME GAP [ % ]
63.2¢/ $1
WAGE / INCOME GAP [ $ ]
0.52
INEQUALITY / GINI INDEX
1,946
TOTAL POPULATION
924
MALE POPULATION
1,022
FEMALE POPULATION
90.41
MALES / 100 FEMALES
110.61
FEMALES / 100 MALES
41.7
MEDIAN AGE
2.9
AVG FAMILY SIZE
2.3
AVG HOUSEHOLD SIZE
965
LABOR FORCE [ PEOPLE ]
65.9%
PERCENT IN LABOR FORCE
Pinedale Zip Codes
Pinedale Area Codes
Income in Pinedale
Income Overview in Pinedale
Per Capita Income in Pinedale is $57,316, while median incomes of families and households are $96,190 and $95,120 respectively.
| Characteristic | Number | Measure |
| Per Capita Income | 1,946 | $57,316 |
| Median Family Income | 517 | $96,190 |
| Mean Family Income | 517 | $101,262 |
| Median Household Income | 846 | $95,120 |
| Mean Household Income | 846 | $127,323 |
| Income Deficit | 517 | $0 |
| Wage / Income Gap (%) | 1,946 | 36.82% |
| Wage / Income Gap ($) | 1,946 | 63.18¢ per $1 |
| Gini / Inequality Index | 1,946 | 0.52 |
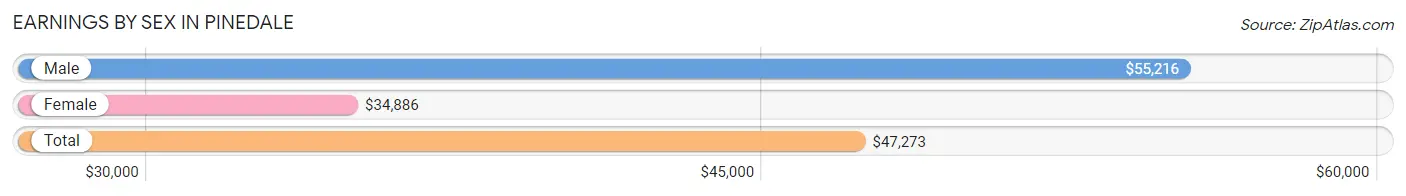
Earnings by Sex in Pinedale
Average Earnings in Pinedale are $47,273, $55,216 for men and $34,886 for women, a difference of 36.8%.
| Sex | Number | Average Earnings |
| Male | 543 (50.6%) | $55,216 |
| Female | 529 (49.3%) | $34,886 |
| Total | 1,072 (100.0%) | $47,273 |
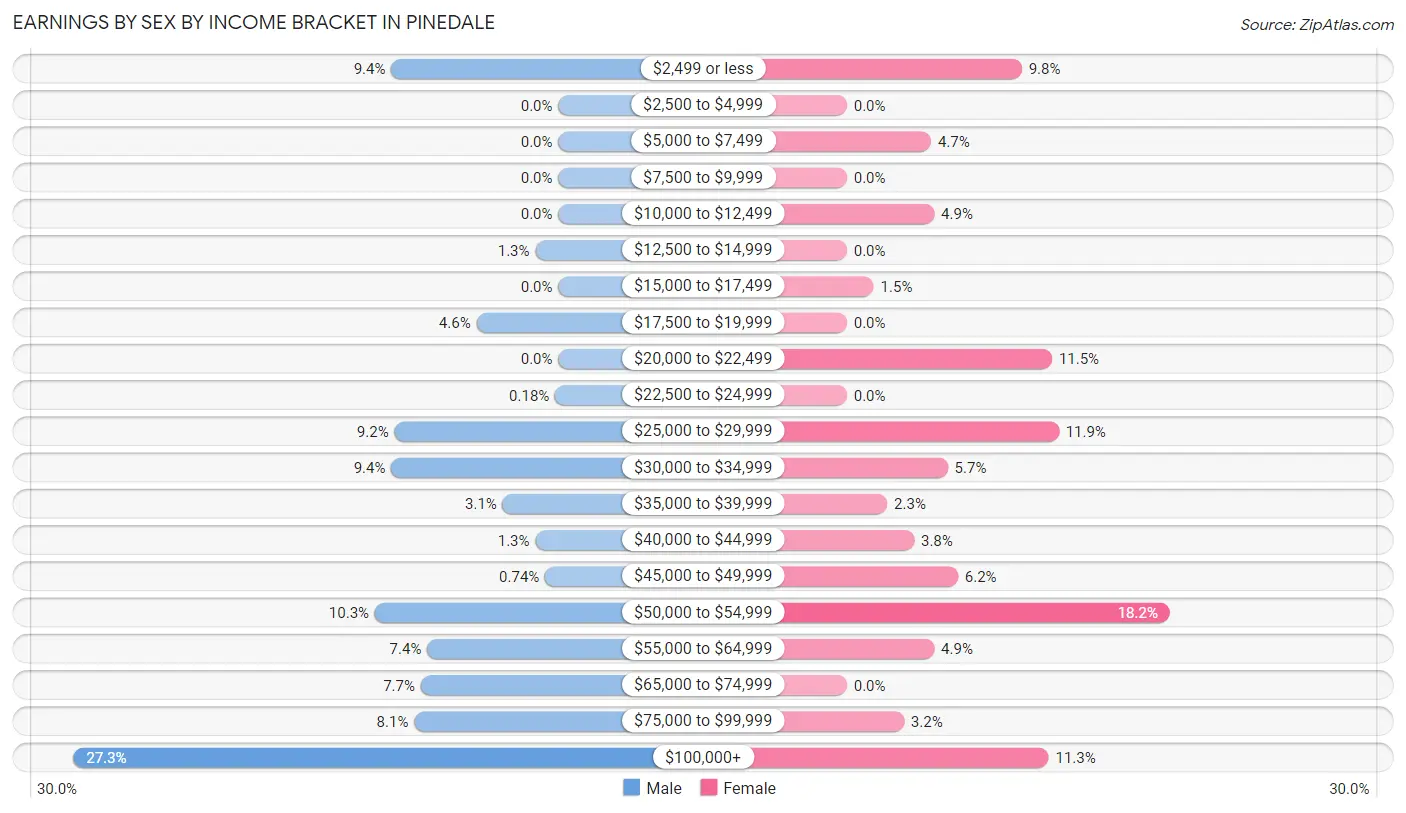
Earnings by Sex by Income Bracket in Pinedale
The most common earnings brackets in Pinedale are $100,000+ for men (148 | 27.3%) and $50,000 to $54,999 for women (96 | 18.1%).
| Income | Male | Female |
| $2,499 or less | 51 (9.4%) | 52 (9.8%) |
| $2,500 to $4,999 | 0 (0.0%) | 0 (0.0%) |
| $5,000 to $7,499 | 0 (0.0%) | 25 (4.7%) |
| $7,500 to $9,999 | 0 (0.0%) | 0 (0.0%) |
| $10,000 to $12,499 | 0 (0.0%) | 26 (4.9%) |
| $12,500 to $14,999 | 7 (1.3%) | 0 (0.0%) |
| $15,000 to $17,499 | 0 (0.0%) | 8 (1.5%) |
| $17,500 to $19,999 | 25 (4.6%) | 0 (0.0%) |
| $20,000 to $22,499 | 0 (0.0%) | 61 (11.5%) |
| $22,500 to $24,999 | 1 (0.2%) | 0 (0.0%) |
| $25,000 to $29,999 | 50 (9.2%) | 63 (11.9%) |
| $30,000 to $34,999 | 51 (9.4%) | 30 (5.7%) |
| $35,000 to $39,999 | 17 (3.1%) | 12 (2.3%) |
| $40,000 to $44,999 | 7 (1.3%) | 20 (3.8%) |
| $45,000 to $49,999 | 4 (0.7%) | 33 (6.2%) |
| $50,000 to $54,999 | 56 (10.3%) | 96 (18.1%) |
| $55,000 to $64,999 | 40 (7.4%) | 26 (4.9%) |
| $65,000 to $74,999 | 42 (7.7%) | 0 (0.0%) |
| $75,000 to $99,999 | 44 (8.1%) | 17 (3.2%) |
| $100,000+ | 148 (27.3%) | 60 (11.3%) |
| Total | 543 (100.0%) | 529 (100.0%) |
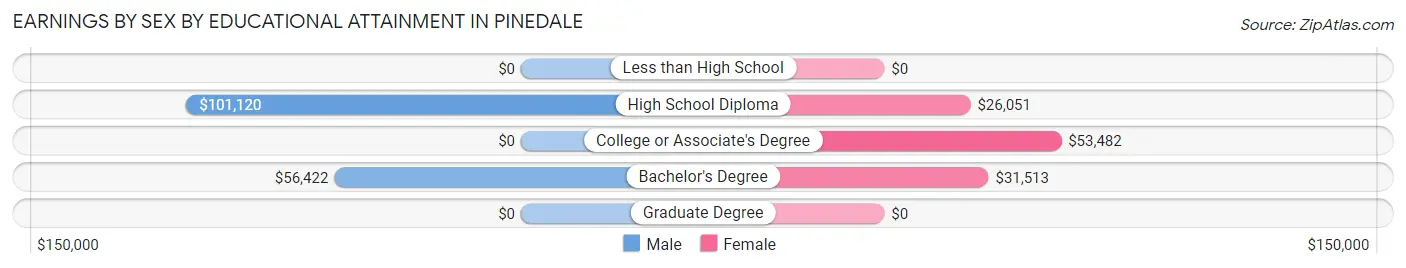
Earnings by Sex by Educational Attainment in Pinedale
Average earnings in Pinedale are $61,932 for men and $36,354 for women, a difference of 41.3%. Men with an educational attainment of high school diploma enjoy the highest average annual earnings of $101,120, while those with bachelor's degree education earn the least with $56,422. Women with an educational attainment of college or associate's degree earn the most with the average annual earnings of $53,482, while those with high school diploma education have the smallest earnings of $26,051.
| Educational Attainment | Male Income | Female Income |
| Less than High School | - | - |
| High School Diploma | $101,120 | $26,051 |
| College or Associate's Degree | - | - |
| Bachelor's Degree | $56,422 | $31,513 |
| Graduate Degree | - | - |
| Total | $61,932 | $36,354 |
Family Income in Pinedale
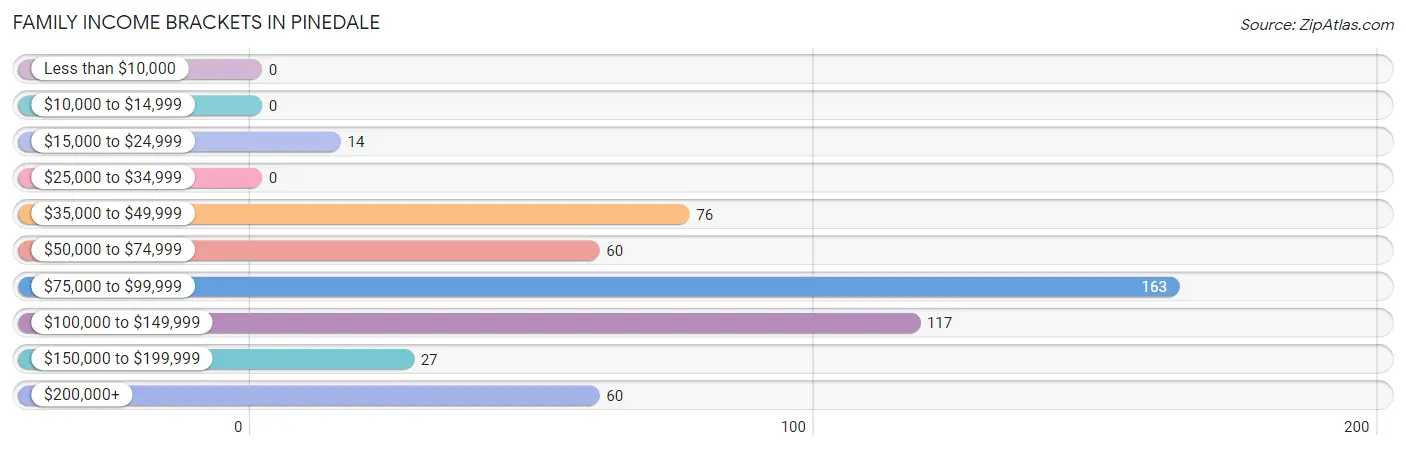
Family Income Brackets in Pinedale
According to the Pinedale family income data, there are 163 families falling into the $75,000 to $99,999 income range, which is the most common income bracket and makes up 31.5% of all families.
| Income Bracket | # Families | % Families |
| Less than $10,000 | 0 | 0.0% |
| $10,000 to $14,999 | 0 | 0.0% |
| $15,000 to $24,999 | 14 | 2.7% |
| $25,000 to $34,999 | 0 | 0.0% |
| $35,000 to $49,999 | 76 | 14.7% |
| $50,000 to $74,999 | 60 | 11.6% |
| $75,000 to $99,999 | 163 | 31.5% |
| $100,000 to $149,999 | 117 | 22.6% |
| $150,000 to $199,999 | 27 | 5.2% |
| $200,000+ | 60 | 11.6% |
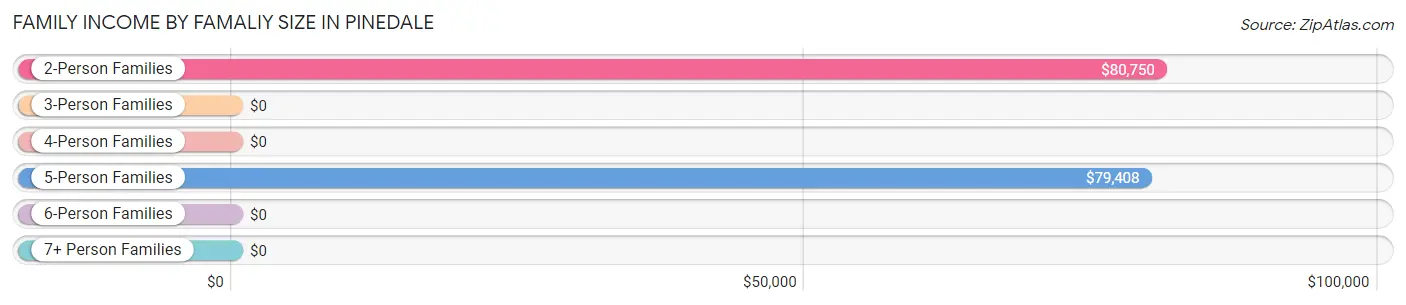
Family Income by Famaliy Size in Pinedale
2-person families (322 | 62.3%) account for the highest median family income in Pinedale with $80,750 per family, while 2-person families (322 | 62.3%) have the highest median income of $40,375 per family member.
| Income Bracket | # Families | Median Income |
| 2-Person Families | 322 (62.3%) | $80,750 |
| 3-Person Families | 122 (23.6%) | $0 |
| 4-Person Families | 12 (2.3%) | $0 |
| 5-Person Families | 43 (8.3%) | $79,408 |
| 6-Person Families | 0 (0.0%) | $0 |
| 7+ Person Families | 18 (3.5%) | $0 |
| Total | 517 (100.0%) | $96,190 |
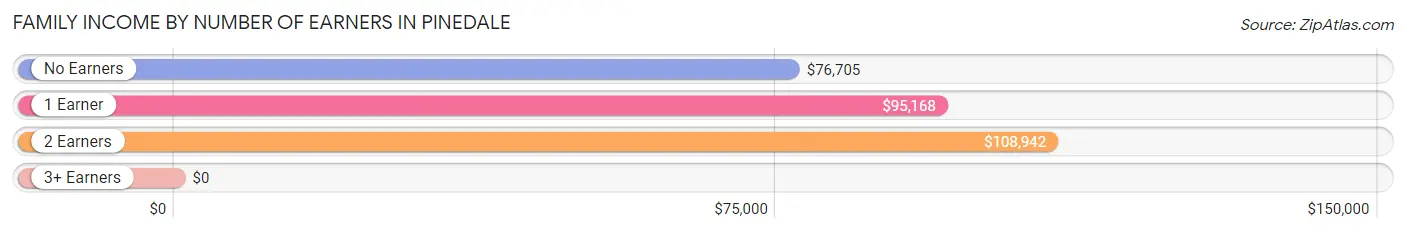
Family Income by Number of Earners in Pinedale
| Number of Earners | # Families | Median Income |
| No Earners | 44 (8.5%) | $76,705 |
| 1 Earner | 194 (37.5%) | $95,168 |
| 2 Earners | 279 (54.0%) | $108,942 |
| 3+ Earners | 0 (0.0%) | $0 |
| Total | 517 (100.0%) | $96,190 |
Household Income in Pinedale
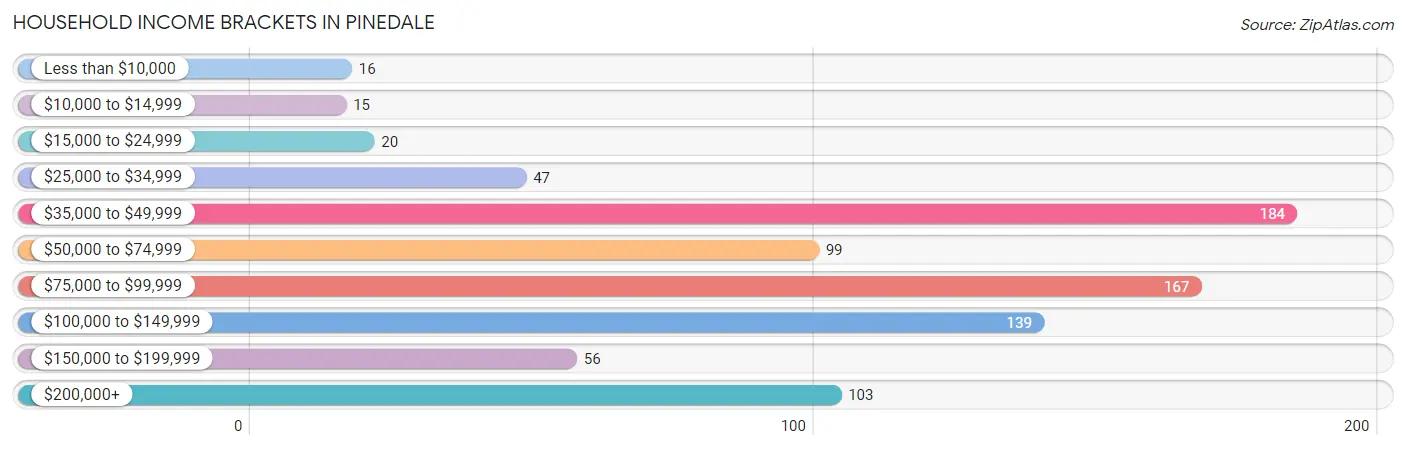
Household Income Brackets in Pinedale
With 184 households falling in the category, the $35,000 to $49,999 income range is the most frequent in Pinedale, accounting for 21.7% of all households. In contrast, only 15 households (1.8%) fall into the $10,000 to $14,999 income bracket, making it the least populous group.
| Income Bracket | # Households | % Households |
| Less than $10,000 | 16 | 1.9% |
| $10,000 to $14,999 | 15 | 1.8% |
| $15,000 to $24,999 | 20 | 2.4% |
| $25,000 to $34,999 | 47 | 5.6% |
| $35,000 to $49,999 | 184 | 21.7% |
| $50,000 to $74,999 | 99 | 11.7% |
| $75,000 to $99,999 | 167 | 19.7% |
| $100,000 to $149,999 | 139 | 16.4% |
| $150,000 to $199,999 | 56 | 6.6% |
| $200,000+ | 103 | 12.2% |
Household Income by Householder Age in Pinedale
The median household income in Pinedale is $95,120, with the highest median household income of $99,135 found in the 25 to 44 years age bracket for the primary householder. A total of 213 households (25.2%) fall into this category. Meanwhile, the 15 to 24 years age bracket for the primary householder has the lowest median household income of $0, with 31 households (3.7%) in this group.
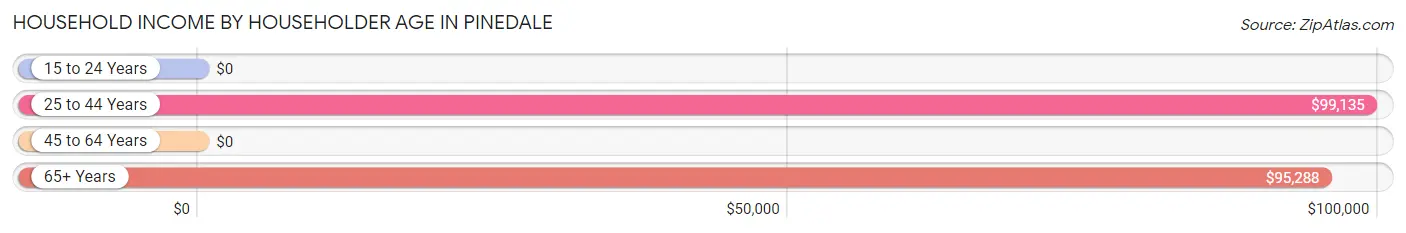
| Income Bracket | # Households | Median Income |
| 15 to 24 Years | 31 (3.7%) | $0 |
| 25 to 44 Years | 213 (25.2%) | $99,135 |
| 45 to 64 Years | 254 (30.0%) | $0 |
| 65+ Years | 348 (41.1%) | $95,288 |
| Total | 846 (100.0%) | $95,120 |
Poverty in Pinedale
Income Below Poverty by Sex and Age in Pinedale
With 3.6% poverty level for males and 3.4% for females among the residents of Pinedale, 5 year old males and 18 to 24 year old females are the most vulnerable to poverty, with 12 males (100.0%) and 6 females (42.9%) in their respective age groups living below the poverty level.
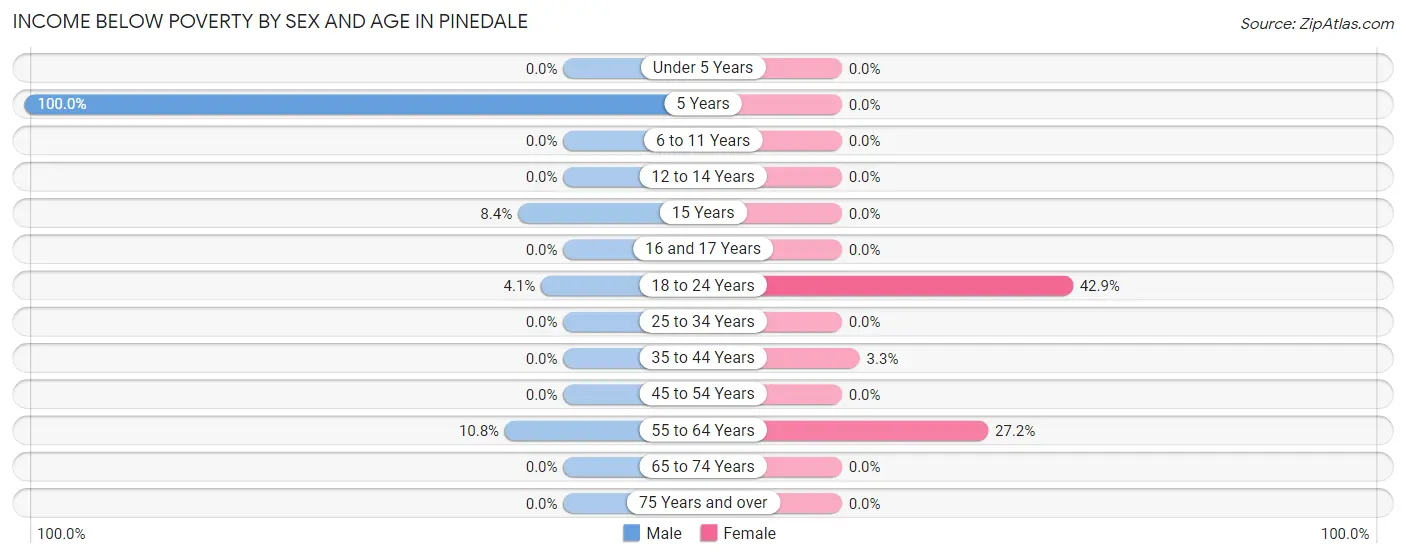
| Age Bracket | Male | Female |
| Under 5 Years | 0 (0.0%) | 0 (0.0%) |
| 5 Years | 12 (100.0%) | 0 (0.0%) |
| 6 to 11 Years | 0 (0.0%) | 0 (0.0%) |
| 12 to 14 Years | 0 (0.0%) | 0 (0.0%) |
| 15 Years | 8 (8.4%) | 0 (0.0%) |
| 16 and 17 Years | 0 (0.0%) | 0 (0.0%) |
| 18 to 24 Years | 3 (4.1%) | 6 (42.9%) |
| 25 to 34 Years | 0 (0.0%) | 0 (0.0%) |
| 35 to 44 Years | 0 (0.0%) | 7 (3.3%) |
| 45 to 54 Years | 0 (0.0%) | 0 (0.0%) |
| 55 to 64 Years | 9 (10.8%) | 22 (27.2%) |
| 65 to 74 Years | 0 (0.0%) | 0 (0.0%) |
| 75 Years and over | 0 (0.0%) | 0 (0.0%) |
| Total | 32 (3.6%) | 35 (3.4%) |
Income Above Poverty by Sex and Age in Pinedale
According to the poverty statistics in Pinedale, males aged under 5 years and females aged under 5 years are the age groups that are most secure financially, with 100.0% of males and 100.0% of females in these age groups living above the poverty line.
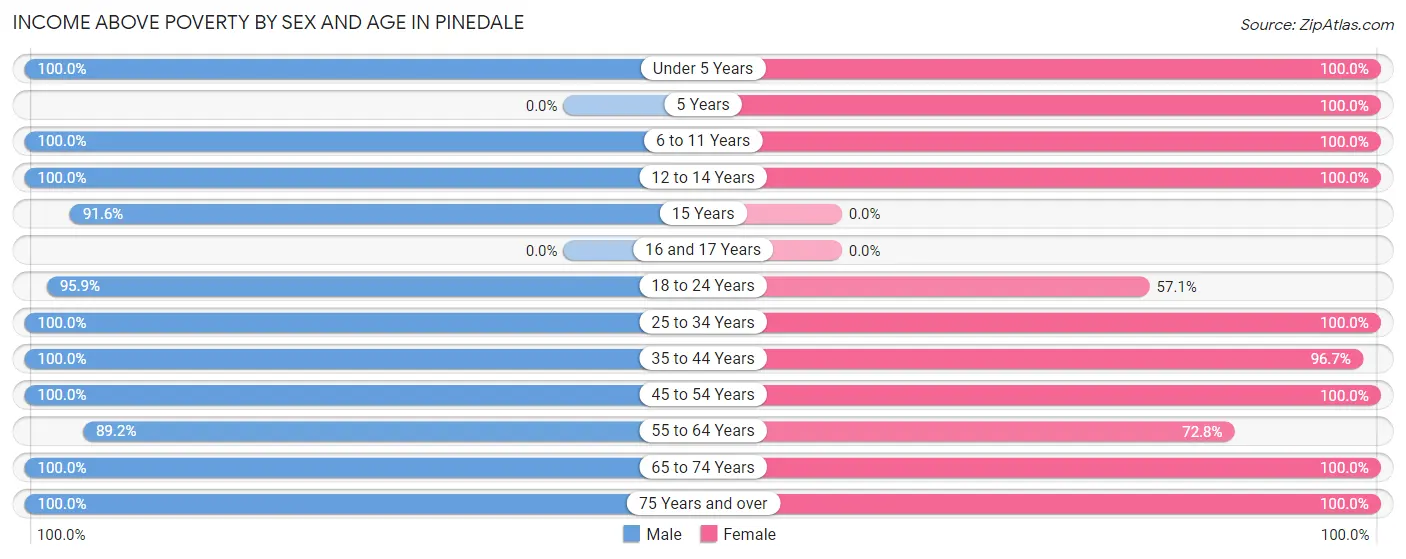
| Age Bracket | Male | Female |
| Under 5 Years | 18 (100.0%) | 22 (100.0%) |
| 5 Years | 0 (0.0%) | 59 (100.0%) |
| 6 to 11 Years | 119 (100.0%) | 21 (100.0%) |
| 12 to 14 Years | 57 (100.0%) | 78 (100.0%) |
| 15 Years | 87 (91.6%) | 0 (0.0%) |
| 16 and 17 Years | 0 (0.0%) | 0 (0.0%) |
| 18 to 24 Years | 70 (95.9%) | 8 (57.1%) |
| 25 to 34 Years | 36 (100.0%) | 55 (100.0%) |
| 35 to 44 Years | 145 (100.0%) | 204 (96.7%) |
| 45 to 54 Years | 128 (100.0%) | 151 (100.0%) |
| 55 to 64 Years | 74 (89.2%) | 59 (72.8%) |
| 65 to 74 Years | 65 (100.0%) | 235 (100.0%) |
| 75 Years and over | 65 (100.0%) | 95 (100.0%) |
| Total | 864 (96.4%) | 987 (96.6%) |
Income Below Poverty Among Married-Couple Families in Pinedale
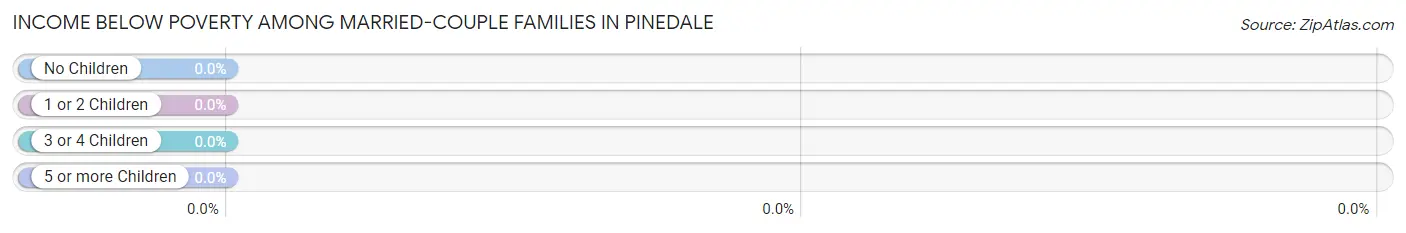
| Children | Above Poverty | Below Poverty |
| No Children | 246 (100.0%) | 0 (0.0%) |
| 1 or 2 Children | 127 (100.0%) | 0 (0.0%) |
| 3 or 4 Children | 43 (100.0%) | 0 (0.0%) |
| 5 or more Children | 18 (100.0%) | 0 (0.0%) |
| Total | 434 (100.0%) | 0 (0.0%) |
Income Below Poverty Among Single-Parent Households in Pinedale
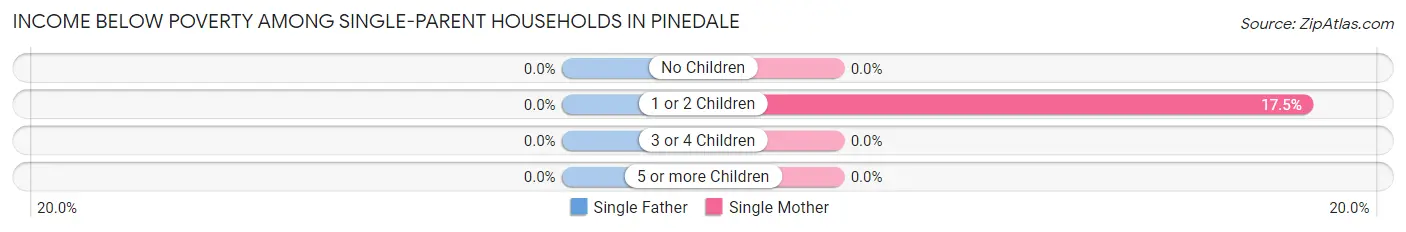
| Children | Single Father | Single Mother |
| No Children | 0 (0.0%) | 0 (0.0%) |
| 1 or 2 Children | 0 (0.0%) | 7 (17.5%) |
| 3 or 4 Children | 0 (0.0%) | 0 (0.0%) |
| 5 or more Children | 0 (0.0%) | 0 (0.0%) |
| Total | 0 (0.0%) | 7 (10.0%) |
Income Below Poverty Among Married-Couple vs Single-Parent Households in Pinedale
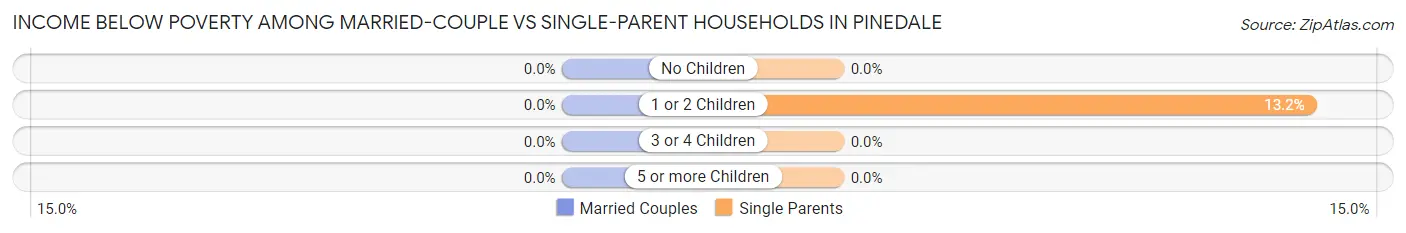
| Children | Married-Couple Families | Single-Parent Households |
| No Children | 0 (0.0%) | 0 (0.0%) |
| 1 or 2 Children | 0 (0.0%) | 7 (13.2%) |
| 3 or 4 Children | 0 (0.0%) | 0 (0.0%) |
| 5 or more Children | 0 (0.0%) | 0 (0.0%) |
| Total | 0 (0.0%) | 7 (8.4%) |
Race in Pinedale
The most populous races in Pinedale are White / Caucasian (1,650 | 84.8%), Hispanic or Latino (288 | 14.8%), and Two or more Races (263 | 13.5%).
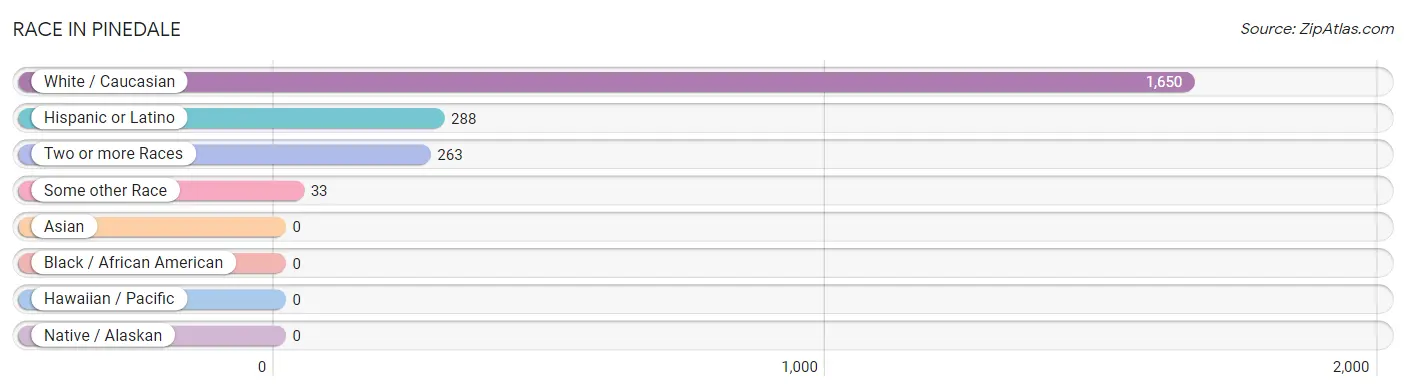
| Race | # Population | % Population |
| Asian | 0 | 0.0% |
| Black / African American | 0 | 0.0% |
| Hawaiian / Pacific | 0 | 0.0% |
| Hispanic or Latino | 288 | 14.8% |
| Native / Alaskan | 0 | 0.0% |
| White / Caucasian | 1,650 | 84.8% |
| Two or more Races | 263 | 13.5% |
| Some other Race | 33 | 1.7% |
| Total | 1,946 | 100.0% |
Ancestry in Pinedale
The most populous ancestries reported in Pinedale are English (757 | 38.9%), German (344 | 17.7%), Scottish (289 | 14.8%), Irish (241 | 12.4%), and Mexican (231 | 11.9%), together accounting for 95.7% of all Pinedale residents.
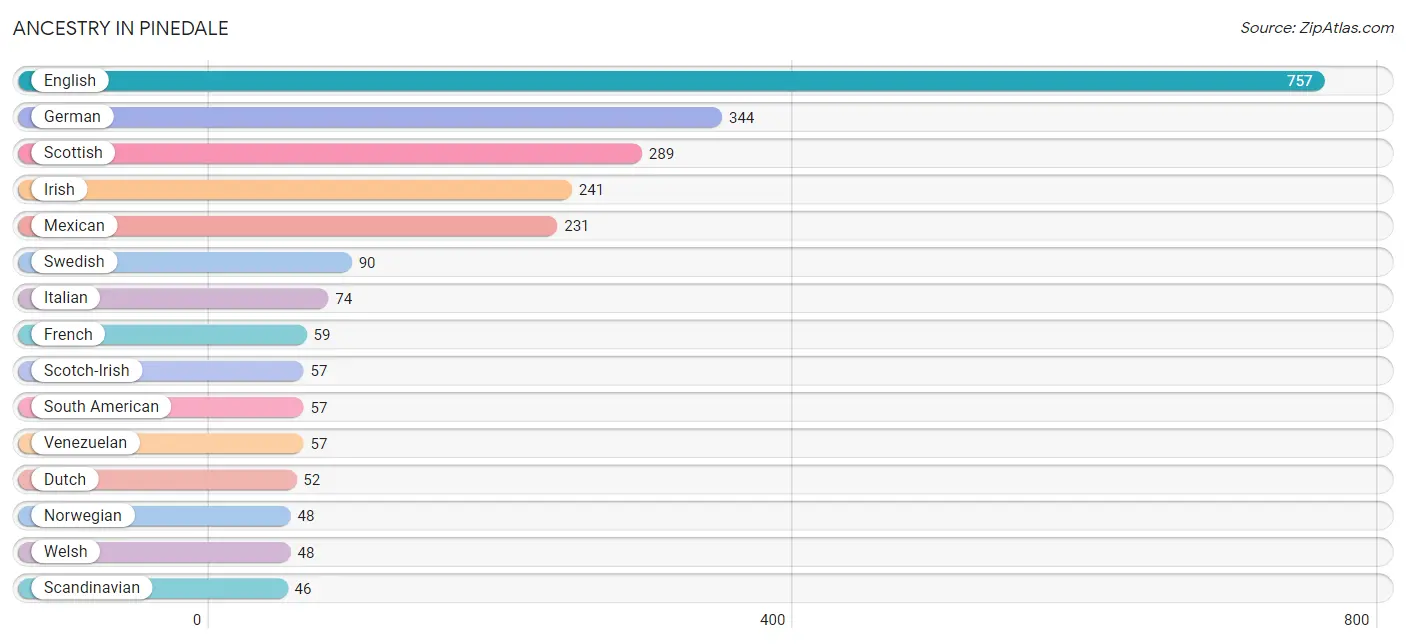
| Ancestry | # Population | % Population |
| American | 28 | 1.4% |
| Czech | 20 | 1.0% |
| Danish | 2 | 0.1% |
| Dutch | 52 | 2.7% |
| English | 757 | 38.9% |
| European | 13 | 0.7% |
| French | 59 | 3.0% |
| German | 344 | 17.7% |
| Irish | 241 | 12.4% |
| Italian | 74 | 3.8% |
| Mexican | 231 | 11.9% |
| Norwegian | 48 | 2.5% |
| Scandinavian | 46 | 2.4% |
| Scotch-Irish | 57 | 2.9% |
| Scottish | 289 | 14.8% |
| Serbian | 32 | 1.6% |
| Slavic | 23 | 1.2% |
| South American | 57 | 2.9% |
| Swedish | 90 | 4.6% |
| Swiss | 15 | 0.8% |
| Venezuelan | 57 | 2.9% |
| Welsh | 48 | 2.5% | View All 22 Rows |
Immigrants in Pinedale
The most numerous immigrant groups reported in Pinedale came from Latin America (46 | 2.4%), Central America (34 | 1.8%), Mexico (34 | 1.8%), South America (12 | 0.6%), and Venezuela (12 | 0.6%), together accounting for 7.1% of all Pinedale residents.
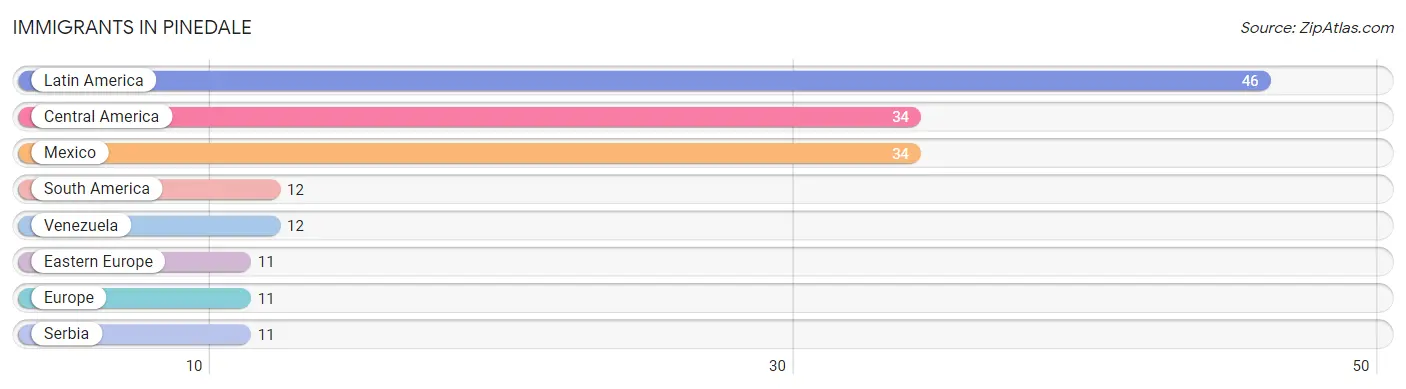
| Immigration Origin | # Population | % Population |
| Central America | 34 | 1.8% |
| Eastern Europe | 11 | 0.6% |
| Europe | 11 | 0.6% |
| Latin America | 46 | 2.4% |
| Mexico | 34 | 1.8% |
| Serbia | 11 | 0.6% |
| South America | 12 | 0.6% |
| Venezuela | 12 | 0.6% | View All 8 Rows |
Sex and Age in Pinedale
Sex and Age in Pinedale
The most populous age groups in Pinedale are 15 to 19 Years (120 | 13.0%) for men and 35 to 39 Years (155 | 15.2%) for women.
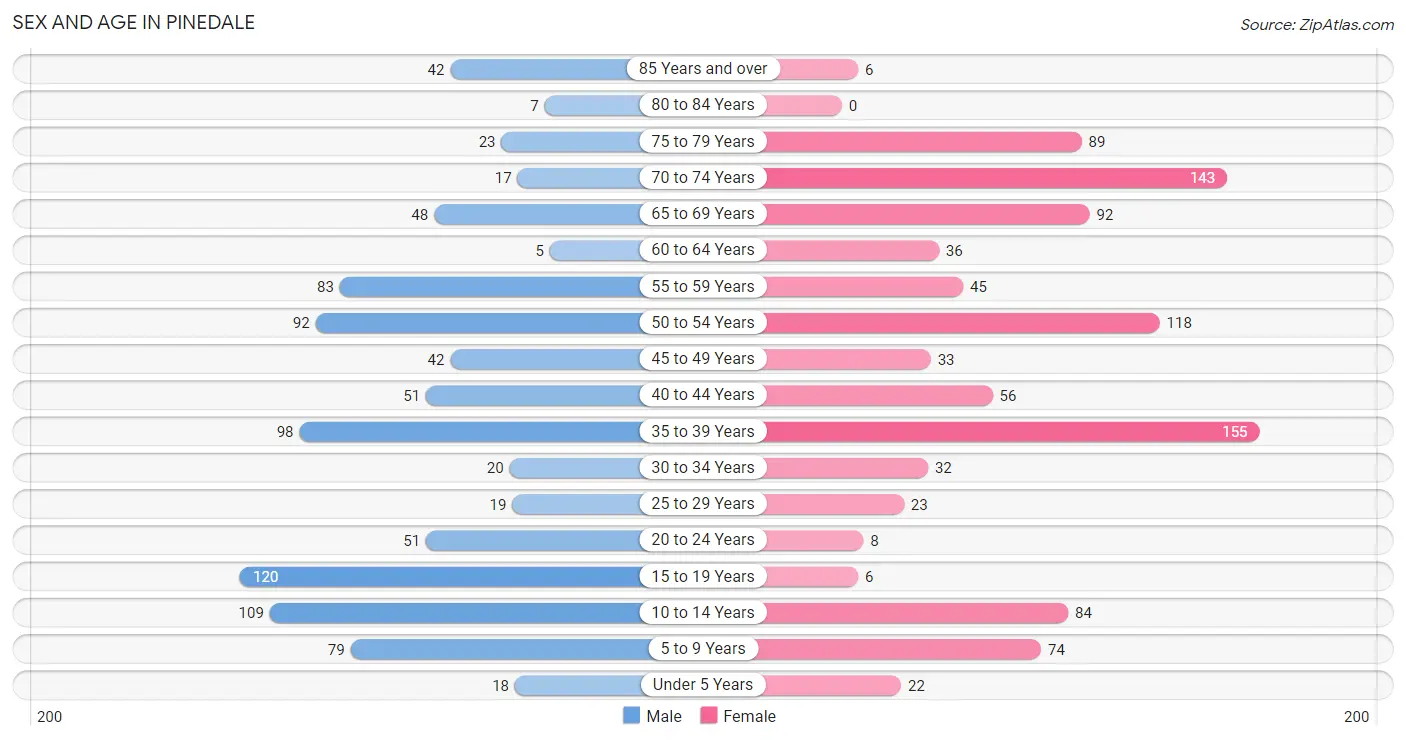
| Age Bracket | Male | Female |
| Under 5 Years | 18 (1.9%) | 22 (2.1%) |
| 5 to 9 Years | 79 (8.6%) | 74 (7.2%) |
| 10 to 14 Years | 109 (11.8%) | 84 (8.2%) |
| 15 to 19 Years | 120 (13.0%) | 6 (0.6%) |
| 20 to 24 Years | 51 (5.5%) | 8 (0.8%) |
| 25 to 29 Years | 19 (2.1%) | 23 (2.2%) |
| 30 to 34 Years | 20 (2.2%) | 32 (3.1%) |
| 35 to 39 Years | 98 (10.6%) | 155 (15.2%) |
| 40 to 44 Years | 51 (5.5%) | 56 (5.5%) |
| 45 to 49 Years | 42 (4.5%) | 33 (3.2%) |
| 50 to 54 Years | 92 (10.0%) | 118 (11.6%) |
| 55 to 59 Years | 83 (9.0%) | 45 (4.4%) |
| 60 to 64 Years | 5 (0.5%) | 36 (3.5%) |
| 65 to 69 Years | 48 (5.2%) | 92 (9.0%) |
| 70 to 74 Years | 17 (1.8%) | 143 (14.0%) |
| 75 to 79 Years | 23 (2.5%) | 89 (8.7%) |
| 80 to 84 Years | 7 (0.8%) | 0 (0.0%) |
| 85 Years and over | 42 (4.5%) | 6 (0.6%) |
| Total | 924 (100.0%) | 1,022 (100.0%) |
Families and Households in Pinedale
Median Family Size in Pinedale
The median family size in Pinedale is 2.86 persons per family, with single female/mother families (70 | 13.5%) accounting for the largest median family size of 3.03 persons per family. On the other hand, single male/father families (13 | 2.5%) represent the smallest median family size with 1.92 persons per family.
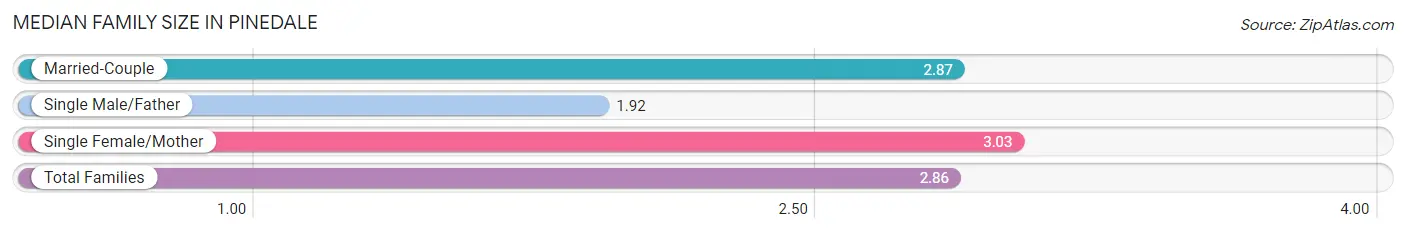
| Family Type | # Families | Family Size |
| Married-Couple | 434 (84.0%) | 2.87 |
| Single Male/Father | 13 (2.5%) | 1.92 |
| Single Female/Mother | 70 (13.5%) | 3.03 |
| Total Families | 517 (100.0%) | 2.86 |
Median Household Size in Pinedale
The median household size in Pinedale is 2.26 persons per household, with single female/mother households (70 | 8.3%) accounting for the largest median household size of 3.03 persons per household. non-family households (329 | 38.9%) represent the smallest median household size with 1.15 persons per household.
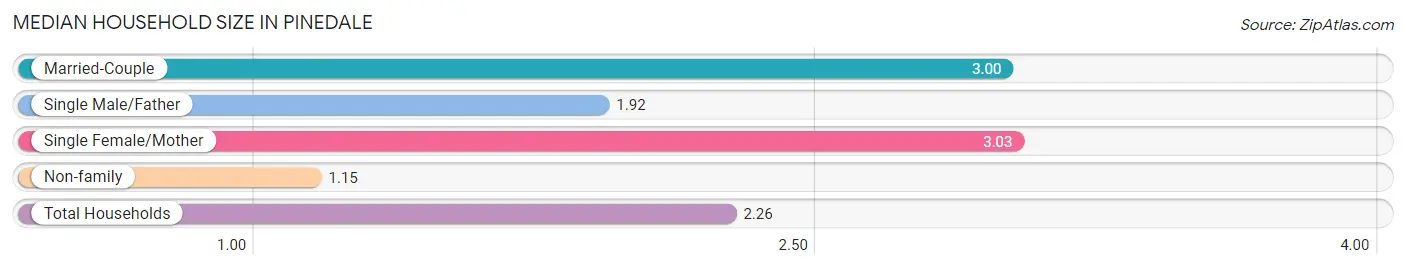
| Household Type | # Households | Household Size |
| Married-Couple | 434 (51.3%) | 3.00 |
| Single Male/Father | 13 (1.5%) | 1.92 |
| Single Female/Mother | 70 (8.3%) | 3.03 |
| Non-family | 329 (38.9%) | 1.15 |
| Total Households | 846 (100.0%) | 2.26 |
Household Size by Marriage Status in Pinedale
Out of a total of 846 households in Pinedale, 517 (61.1%) are family households, while 329 (38.9%) are nonfamily households. The most numerous type of family households are 2-person households, comprising 300, and the most common type of nonfamily households are 1-person households, comprising 298.
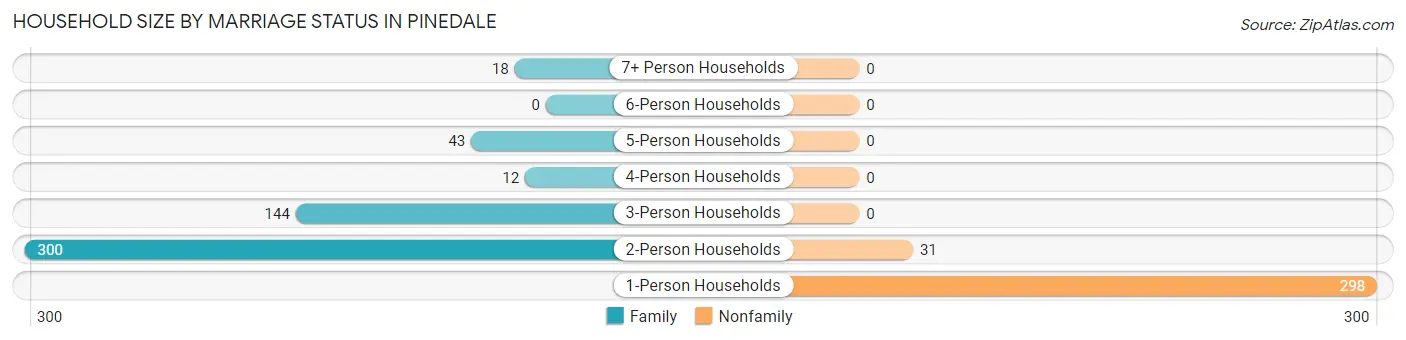
| Household Size | Family Households | Nonfamily Households |
| 1-Person Households | - | 298 (35.2%) |
| 2-Person Households | 300 (35.5%) | 31 (3.7%) |
| 3-Person Households | 144 (17.0%) | 0 (0.0%) |
| 4-Person Households | 12 (1.4%) | 0 (0.0%) |
| 5-Person Households | 43 (5.1%) | 0 (0.0%) |
| 6-Person Households | 0 (0.0%) | 0 (0.0%) |
| 7+ Person Households | 18 (2.1%) | 0 (0.0%) |
| Total | 517 (61.1%) | 329 (38.9%) |
Female Fertility in Pinedale
Fertility by Age in Pinedale
| Age Bracket | Women with Births | Births / 1,000 Women |
| 15 to 19 years | 0 (0.0%) | 0.0 |
| 20 to 34 years | 0 (0.0%) | 0.0 |
| 35 to 50 years | 0 (0.0%) | 0.0 |
| Total | 0 (0.0%) | 0.0 |
Fertility by Age by Marriage Status in Pinedale
| Age Bracket | Married | Unmarried |
| 15 to 19 years | 0 (0.0%) | 0 (0.0%) |
| 20 to 34 years | 0 (0.0%) | 0 (0.0%) |
| 35 to 50 years | 0 (0.0%) | 0 (0.0%) |
| Total | 0 (0.0%) | 0 (0.0%) |
Fertility by Education in Pinedale
| Educational Attainment | Women with Births | Births / 1,000 Women |
| Less than High School | 0 (0.0%) | 0.0 |
| High School Diploma | 0 (0.0%) | 0.0 |
| College or Associate's Degree | 0 (0.0%) | 0.0 |
| Bachelor's Degree | 0 (0.0%) | 0.0 |
| Graduate Degree | 0 (0.0%) | 0.0 |
| Total | 0 (0.0%) | 0.0 |
Fertility by Education by Marriage Status in Pinedale
| Educational Attainment | Married | Unmarried |
| Less than High School | 0 (0.0%) | 0 (0.0%) |
| High School Diploma | 0 (0.0%) | 0 (0.0%) |
| College or Associate's Degree | 0 (0.0%) | 0 (0.0%) |
| Bachelor's Degree | 0 (0.0%) | 0 (0.0%) |
| Graduate Degree | 0 (0.0%) | 0 (0.0%) |
| Total | 0 (0.0%) | 0 (0.0%) |
Employment Characteristics in Pinedale
Employment by Class of Employer in Pinedale
Among the 965 employed individuals in Pinedale, private company employees (763 | 79.1%), not-for-profit organizations (89 | 9.2%), and local government employees (69 | 7.1%) make up the most common classes of employment.
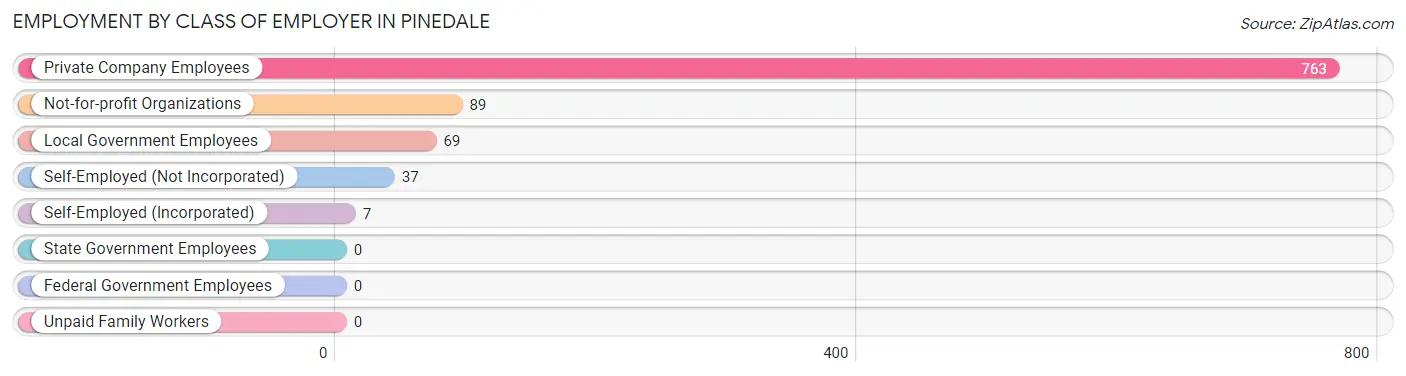
| Employer Class | # Employees | % Employees |
| Private Company Employees | 763 | 79.1% |
| Self-Employed (Incorporated) | 7 | 0.7% |
| Self-Employed (Not Incorporated) | 37 | 3.8% |
| Not-for-profit Organizations | 89 | 9.2% |
| Local Government Employees | 69 | 7.1% |
| State Government Employees | 0 | 0.0% |
| Federal Government Employees | 0 | 0.0% |
| Unpaid Family Workers | 0 | 0.0% |
| Total | 965 | 100.0% |
Employment Status by Age in Pinedale
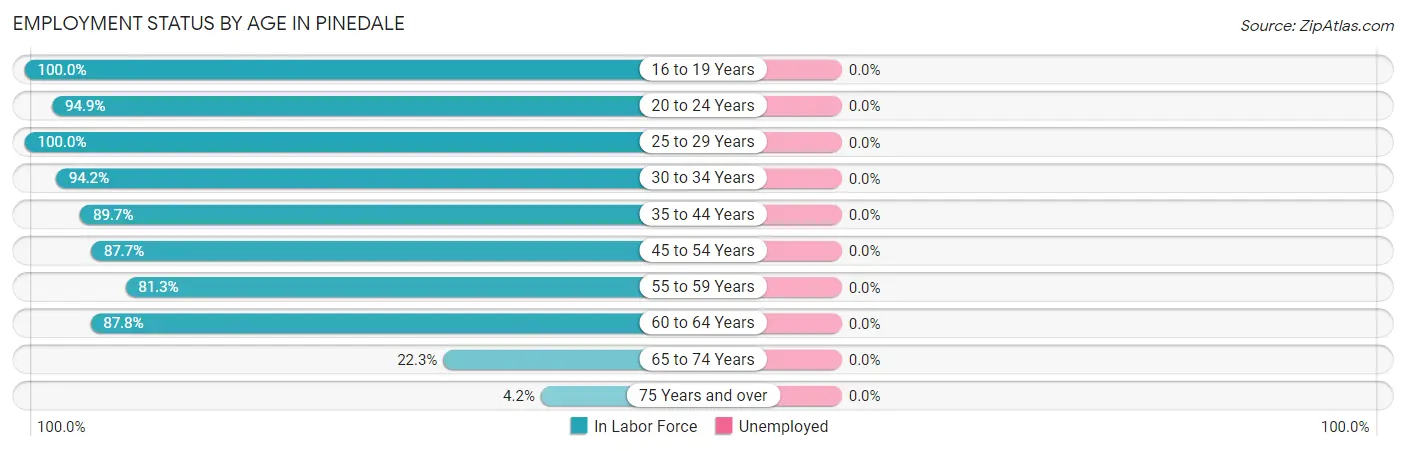
| Age Bracket | In Labor Force | Unemployed |
| 16 to 19 Years | 31 (100.0%) | 0 (0.0%) |
| 20 to 24 Years | 56 (94.9%) | 0 (0.0%) |
| 25 to 29 Years | 42 (100.0%) | 0 (0.0%) |
| 30 to 34 Years | 49 (94.2%) | 0 (0.0%) |
| 35 to 44 Years | 323 (89.7%) | 0 (0.0%) |
| 45 to 54 Years | 250 (87.7%) | 0 (0.0%) |
| 55 to 59 Years | 104 (81.3%) | 0 (0.0%) |
| 60 to 64 Years | 36 (87.8%) | 0 (0.0%) |
| 65 to 74 Years | 67 (22.3%) | 0 (0.0%) |
| 75 Years and over | 7 (4.2%) | 0 (0.0%) |
| Total | 965 (65.9%) | 0 (0.0%) |
Employment Status by Educational Attainment in Pinedale
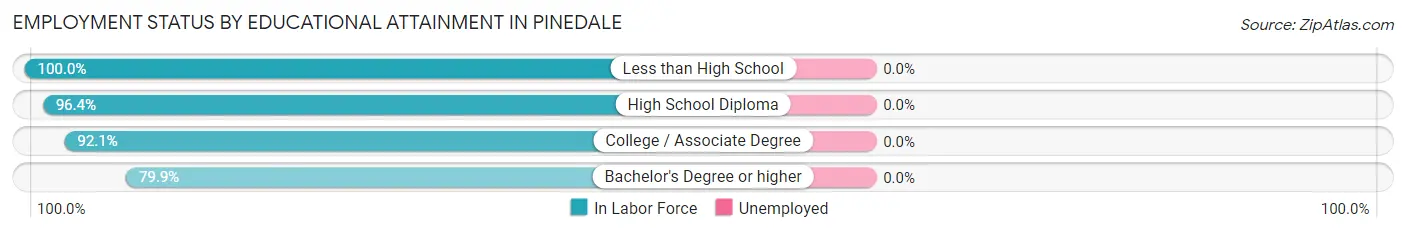
| Educational Attainment | In Labor Force | Unemployed |
| Less than High School | 18 (100.0%) | 0 (0.0%) |
| High School Diploma | 212 (96.4%) | 0 (0.0%) |
| College / Associate Degree | 292 (92.1%) | 0 (0.0%) |
| Bachelor's Degree or higher | 282 (79.9%) | 0 (0.0%) |
| Total | 804 (88.5%) | 0 (0.0%) |
Employment Occupations by Sex in Pinedale
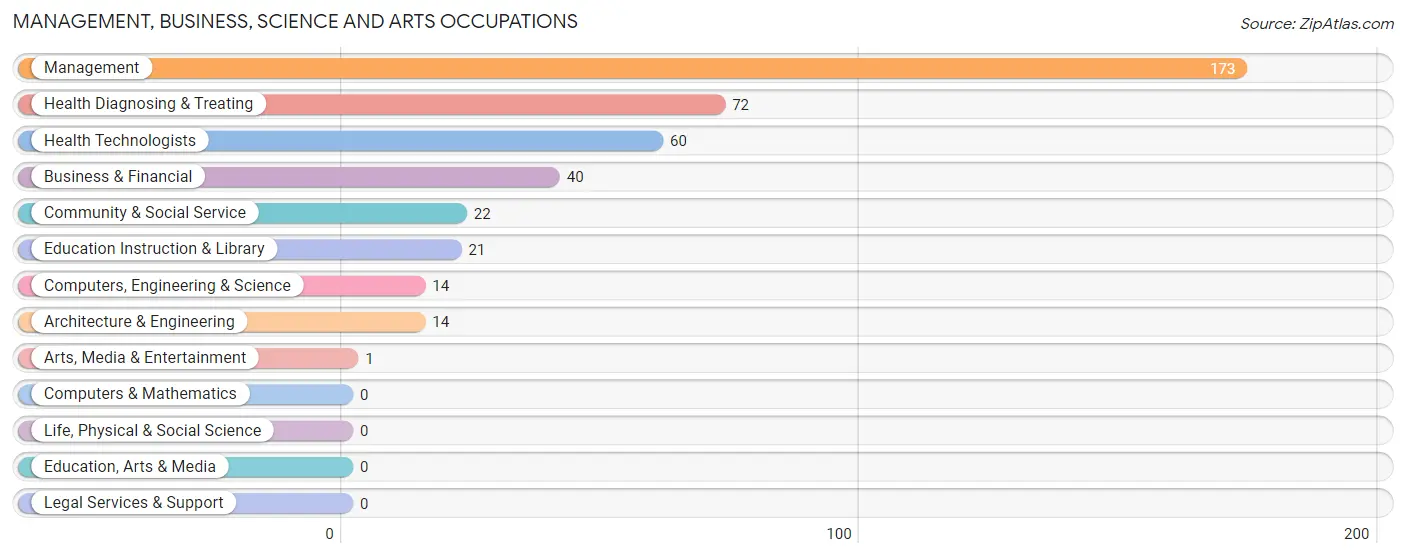
Management, Business, Science and Arts Occupations
The most common Management, Business, Science and Arts occupations in Pinedale are Management (173 | 17.9%), Health Diagnosing & Treating (72 | 7.5%), Health Technologists (60 | 6.2%), Business & Financial (40 | 4.2%), and Community & Social Service (22 | 2.3%).
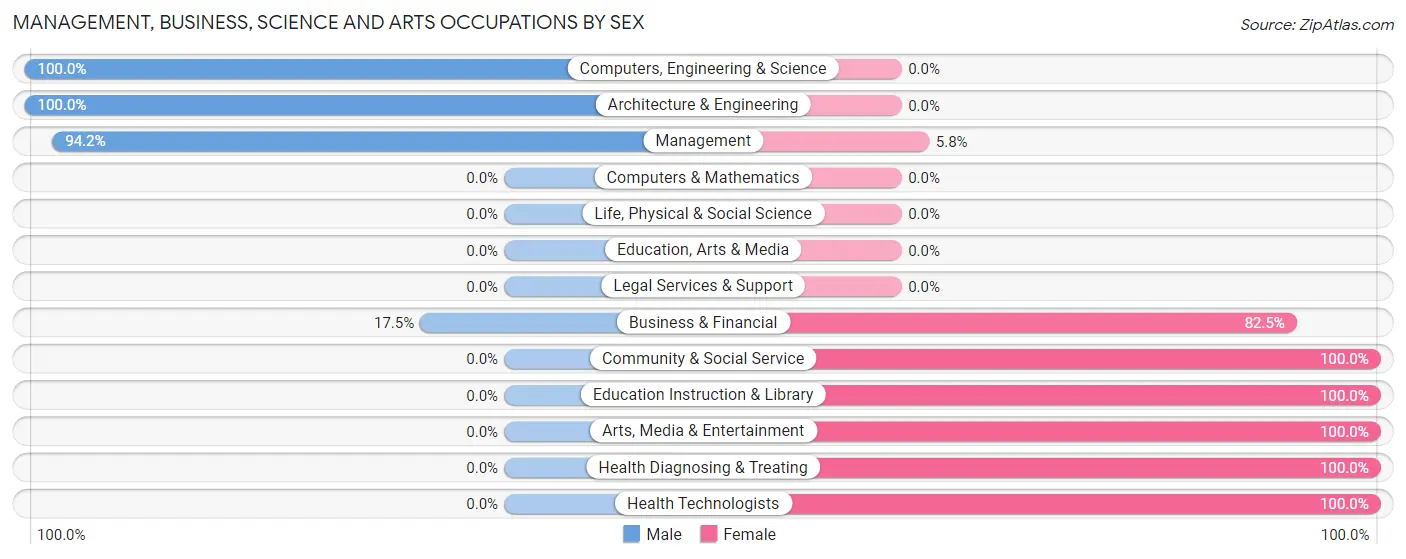
Management, Business, Science and Arts Occupations by Sex
Within the Management, Business, Science and Arts occupations in Pinedale, the most male-oriented occupations are Computers, Engineering & Science (100.0%), Architecture & Engineering (100.0%), and Management (94.2%), while the most female-oriented occupations are Community & Social Service (100.0%), Education Instruction & Library (100.0%), and Arts, Media & Entertainment (100.0%).
| Occupation | Male | Female |
| Management | 163 (94.2%) | 10 (5.8%) |
| Business & Financial | 7 (17.5%) | 33 (82.5%) |
| Computers, Engineering & Science | 14 (100.0%) | 0 (0.0%) |
| Computers & Mathematics | 0 (0.0%) | 0 (0.0%) |
| Architecture & Engineering | 14 (100.0%) | 0 (0.0%) |
| Life, Physical & Social Science | 0 (0.0%) | 0 (0.0%) |
| Community & Social Service | 0 (0.0%) | 22 (100.0%) |
| Education, Arts & Media | 0 (0.0%) | 0 (0.0%) |
| Legal Services & Support | 0 (0.0%) | 0 (0.0%) |
| Education Instruction & Library | 0 (0.0%) | 21 (100.0%) |
| Arts, Media & Entertainment | 0 (0.0%) | 1 (100.0%) |
| Health Diagnosing & Treating | 0 (0.0%) | 72 (100.0%) |
| Health Technologists | 0 (0.0%) | 60 (100.0%) |
| Total (Category) | 184 (57.3%) | 137 (42.7%) |
| Total (Overall) | 482 (49.9%) | 483 (50.0%) |
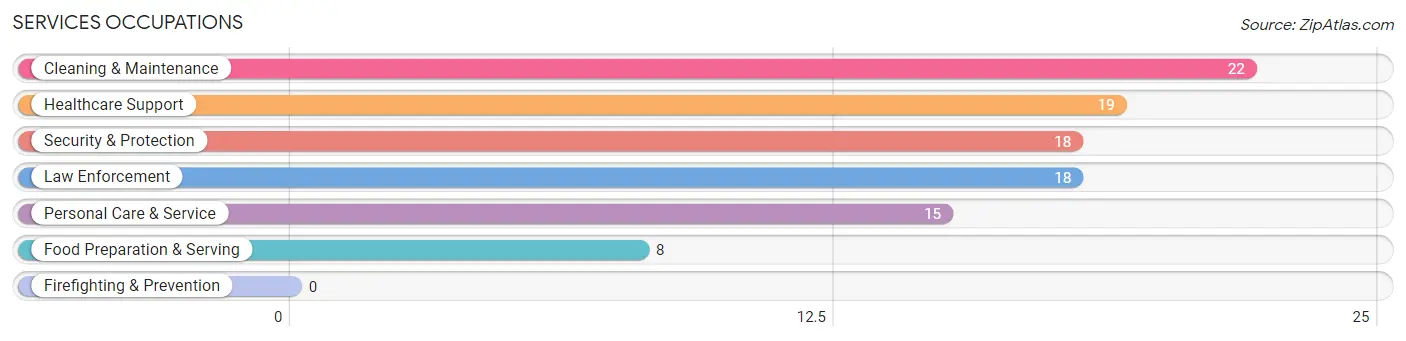
Services Occupations
The most common Services occupations in Pinedale are Cleaning & Maintenance (22 | 2.3%), Healthcare Support (19 | 2.0%), Security & Protection (18 | 1.9%), Law Enforcement (18 | 1.9%), and Personal Care & Service (15 | 1.5%).
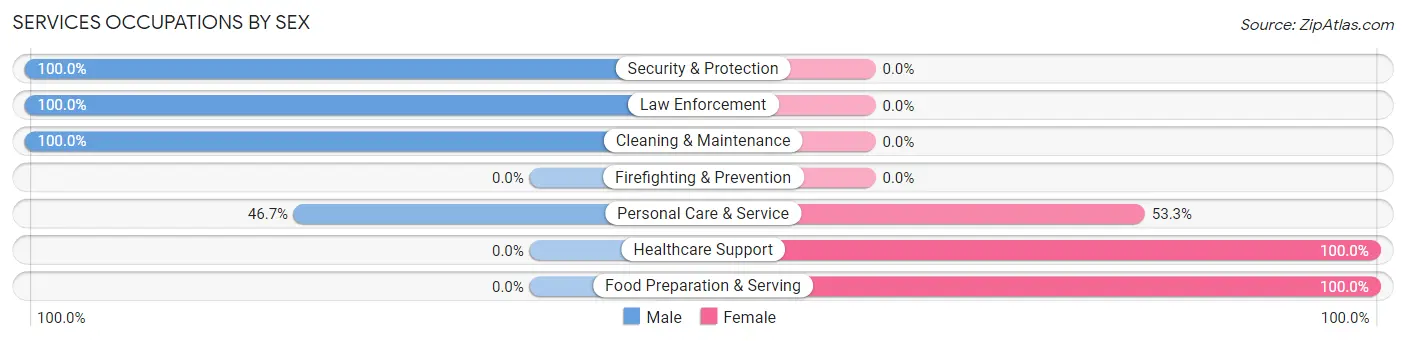
Services Occupations by Sex
Within the Services occupations in Pinedale, the most male-oriented occupations are Security & Protection (100.0%), Law Enforcement (100.0%), and Cleaning & Maintenance (100.0%), while the most female-oriented occupations are Healthcare Support (100.0%), Food Preparation & Serving (100.0%), and Personal Care & Service (53.3%).
| Occupation | Male | Female |
| Healthcare Support | 0 (0.0%) | 19 (100.0%) |
| Security & Protection | 18 (100.0%) | 0 (0.0%) |
| Firefighting & Prevention | 0 (0.0%) | 0 (0.0%) |
| Law Enforcement | 18 (100.0%) | 0 (0.0%) |
| Food Preparation & Serving | 0 (0.0%) | 8 (100.0%) |
| Cleaning & Maintenance | 22 (100.0%) | 0 (0.0%) |
| Personal Care & Service | 7 (46.7%) | 8 (53.3%) |
| Total (Category) | 47 (57.3%) | 35 (42.7%) |
| Total (Overall) | 482 (49.9%) | 483 (50.0%) |
Sales and Office Occupations
The most common Sales and Office occupations in Pinedale are Office & Administration (225 | 23.3%), and Sales & Related (134 | 13.9%).

Sales and Office Occupations by Sex

| Occupation | Male | Female |
| Sales & Related | 48 (35.8%) | 86 (64.2%) |
| Office & Administration | 0 (0.0%) | 225 (100.0%) |
| Total (Category) | 48 (13.4%) | 311 (86.6%) |
| Total (Overall) | 482 (49.9%) | 483 (50.0%) |
Natural Resources, Construction and Maintenance Occupations
The most common Natural Resources, Construction and Maintenance occupations in Pinedale are Construction & Extraction (105 | 10.9%), and Installation, Maintenance & Repair (8 | 0.8%).
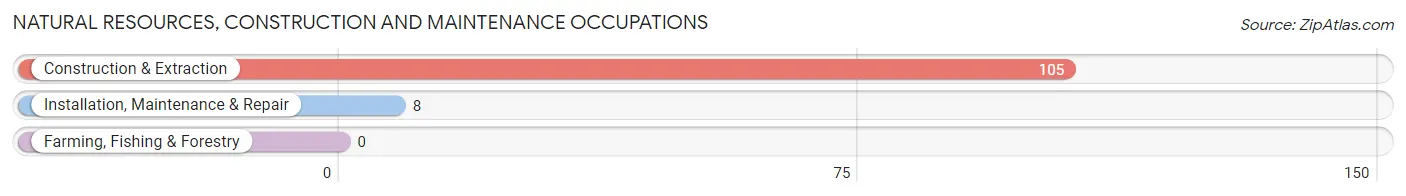
Natural Resources, Construction and Maintenance Occupations by Sex

| Occupation | Male | Female |
| Farming, Fishing & Forestry | 0 (0.0%) | 0 (0.0%) |
| Construction & Extraction | 105 (100.0%) | 0 (0.0%) |
| Installation, Maintenance & Repair | 8 (100.0%) | 0 (0.0%) |
| Total (Category) | 113 (100.0%) | 0 (0.0%) |
| Total (Overall) | 482 (49.9%) | 483 (50.0%) |
Production, Transportation and Moving Occupations
The most common Production, Transportation and Moving occupations in Pinedale are Transportation (77 | 8.0%), and Production (13 | 1.3%).
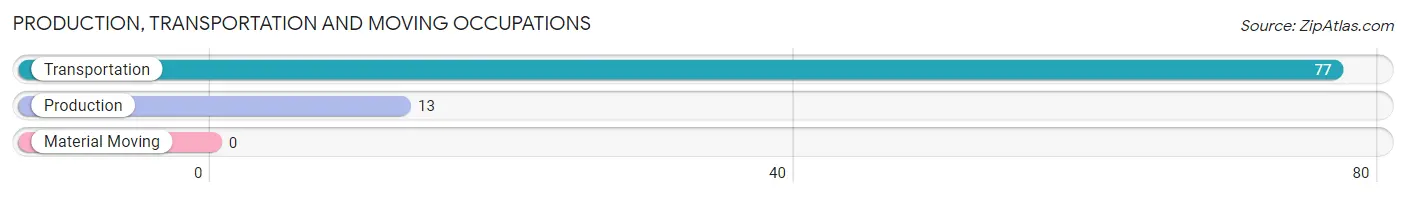
Production, Transportation and Moving Occupations by Sex
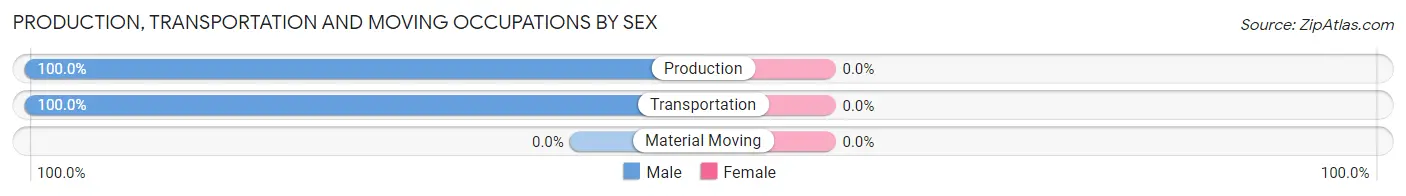
| Occupation | Male | Female |
| Production | 13 (100.0%) | 0 (0.0%) |
| Transportation | 77 (100.0%) | 0 (0.0%) |
| Material Moving | 0 (0.0%) | 0 (0.0%) |
| Total (Category) | 90 (100.0%) | 0 (0.0%) |
| Total (Overall) | 482 (49.9%) | 483 (50.0%) |
Employment Industries by Sex in Pinedale
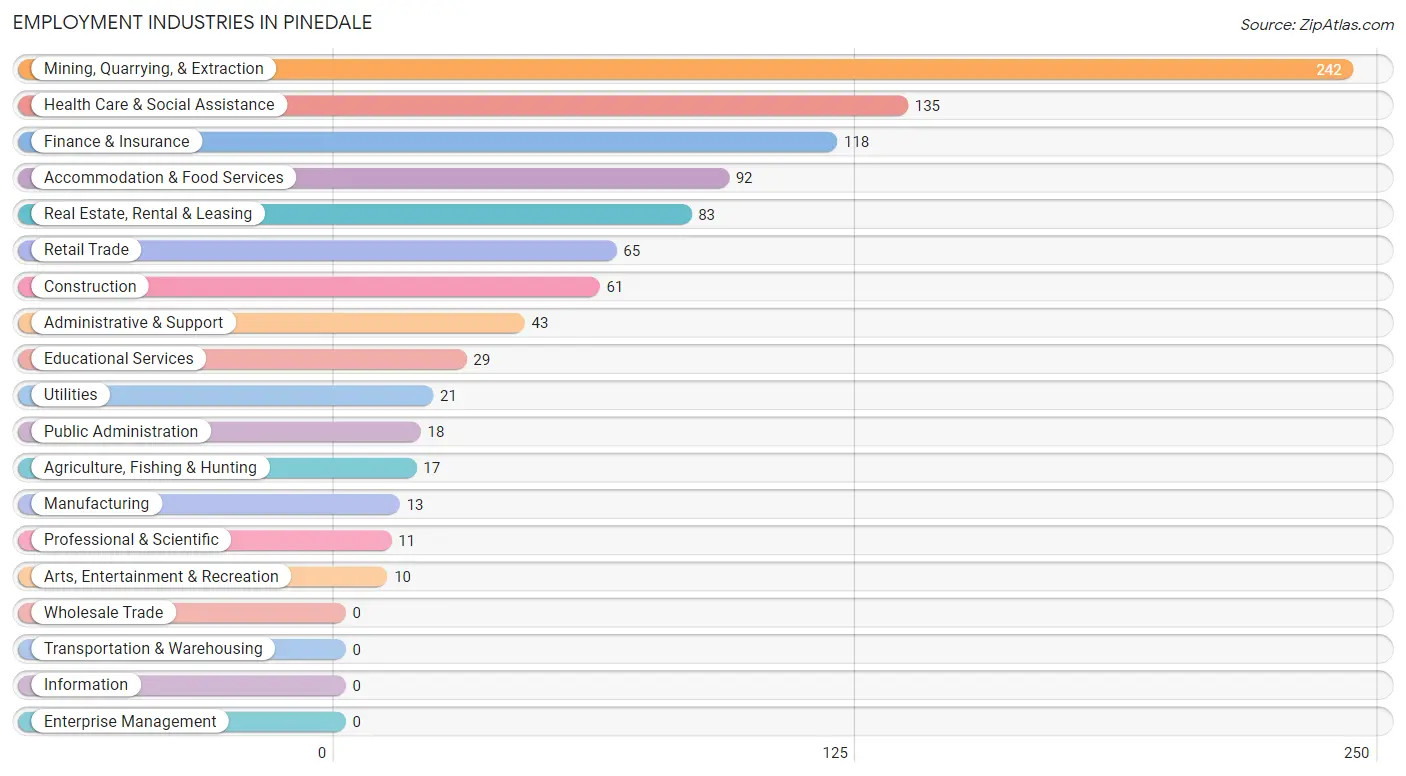
Employment Industries in Pinedale
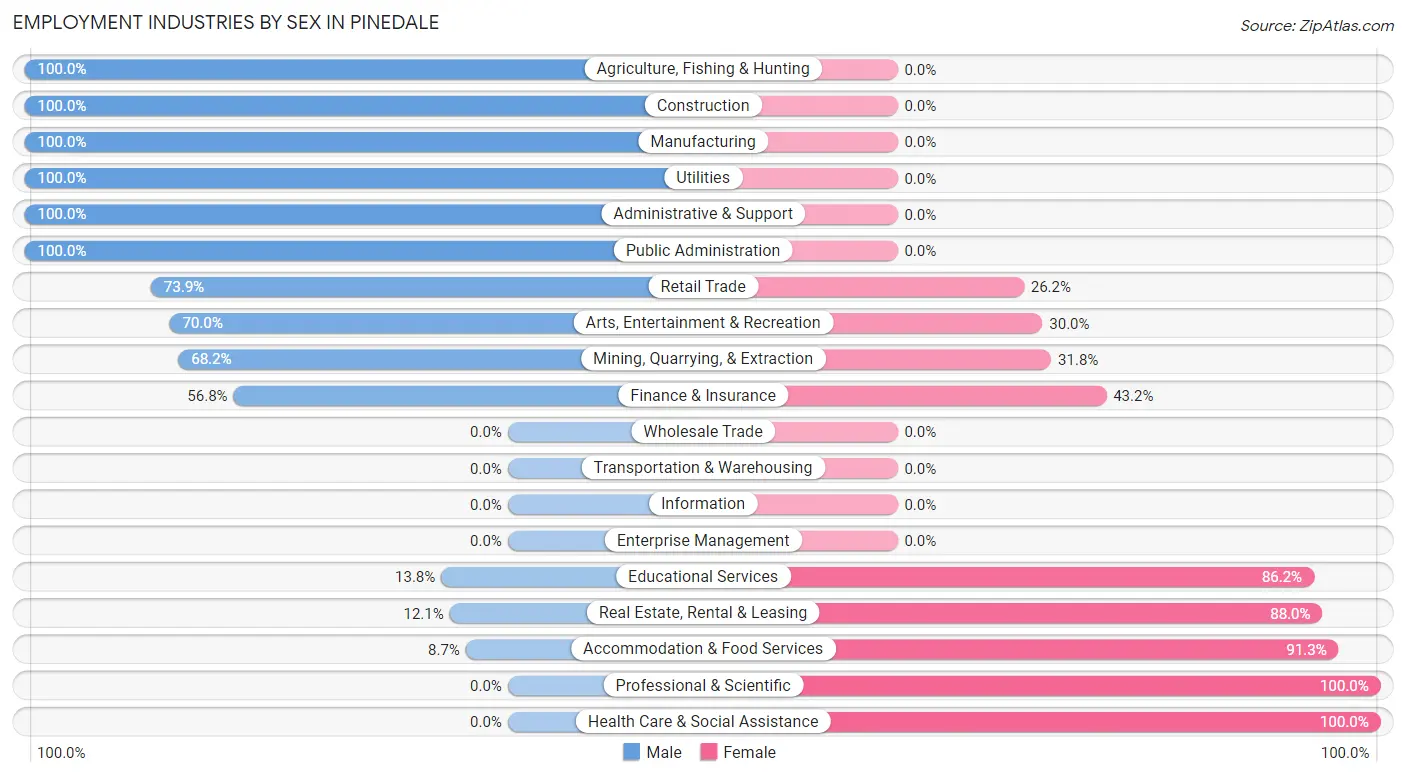
The major employment industries in Pinedale include Mining, Quarrying, & Extraction (242 | 25.1%), Health Care & Social Assistance (135 | 14.0%), Finance & Insurance (118 | 12.2%), Accommodation & Food Services (92 | 9.5%), and Real Estate, Rental & Leasing (83 | 8.6%).
Employment Industries by Sex in Pinedale
The Pinedale industries that see more men than women are Agriculture, Fishing & Hunting (100.0%), Construction (100.0%), and Manufacturing (100.0%), whereas the industries that tend to have a higher number of women are Professional & Scientific (100.0%), Health Care & Social Assistance (100.0%), and Accommodation & Food Services (91.3%).
| Industry | Male | Female |
| Agriculture, Fishing & Hunting | 17 (100.0%) | 0 (0.0%) |
| Mining, Quarrying, & Extraction | 165 (68.2%) | 77 (31.8%) |
| Construction | 61 (100.0%) | 0 (0.0%) |
| Manufacturing | 13 (100.0%) | 0 (0.0%) |
| Wholesale Trade | 0 (0.0%) | 0 (0.0%) |
| Retail Trade | 48 (73.9%) | 17 (26.2%) |
| Transportation & Warehousing | 0 (0.0%) | 0 (0.0%) |
| Utilities | 21 (100.0%) | 0 (0.0%) |
| Information | 0 (0.0%) | 0 (0.0%) |
| Finance & Insurance | 67 (56.8%) | 51 (43.2%) |
| Real Estate, Rental & Leasing | 10 (12.0%) | 73 (87.9%) |
| Professional & Scientific | 0 (0.0%) | 11 (100.0%) |
| Enterprise Management | 0 (0.0%) | 0 (0.0%) |
| Administrative & Support | 43 (100.0%) | 0 (0.0%) |
| Educational Services | 4 (13.8%) | 25 (86.2%) |
| Health Care & Social Assistance | 0 (0.0%) | 135 (100.0%) |
| Arts, Entertainment & Recreation | 7 (70.0%) | 3 (30.0%) |
| Accommodation & Food Services | 8 (8.7%) | 84 (91.3%) |
| Public Administration | 18 (100.0%) | 0 (0.0%) |
| Total | 482 (49.9%) | 483 (50.0%) |
Education in Pinedale
School Enrollment in Pinedale
The most common levels of schooling among the 425 students in Pinedale are middle school (172 | 40.5%), elementary school (103 | 24.2%), and high school (95 | 22.4%).
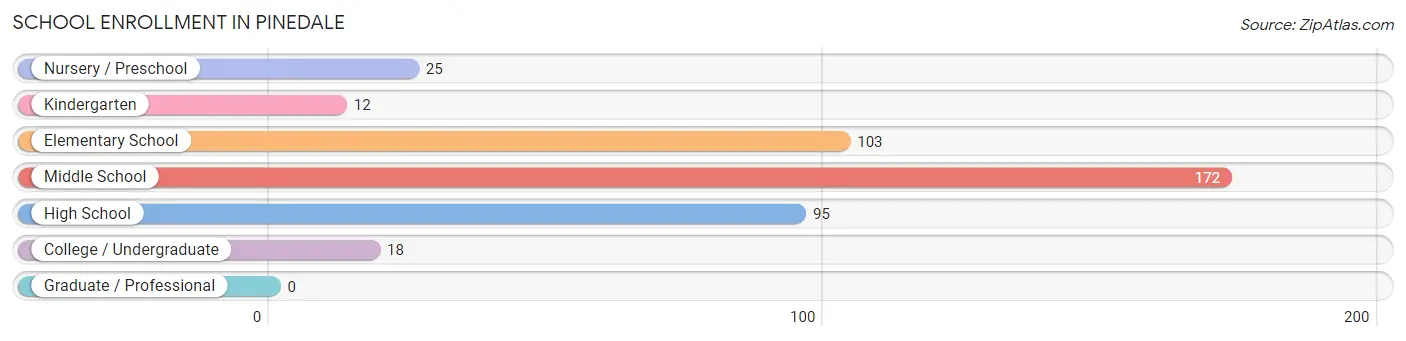
| School Level | # Students | % Students |
| Nursery / Preschool | 25 | 5.9% |
| Kindergarten | 12 | 2.8% |
| Elementary School | 103 | 24.2% |
| Middle School | 172 | 40.5% |
| High School | 95 | 22.4% |
| College / Undergraduate | 18 | 4.2% |
| Graduate / Professional | 0 | 0.0% |
| Total | 425 | 100.0% |
School Enrollment by Age by Funding Source in Pinedale
Out of a total of 425 students who are enrolled in schools in Pinedale, 30 (7.1%) attend a private institution, while the remaining 395 (92.9%) are enrolled in public schools. The age group of 5 to 9 year old has the highest likelihood of being enrolled in private schools, with 15 (13.6% in the age bracket) enrolled. Conversely, the age group of 3 to 4 year olds has the lowest likelihood of being enrolled in a private school, with 9 (100.0% in the age bracket) attending a public institution.
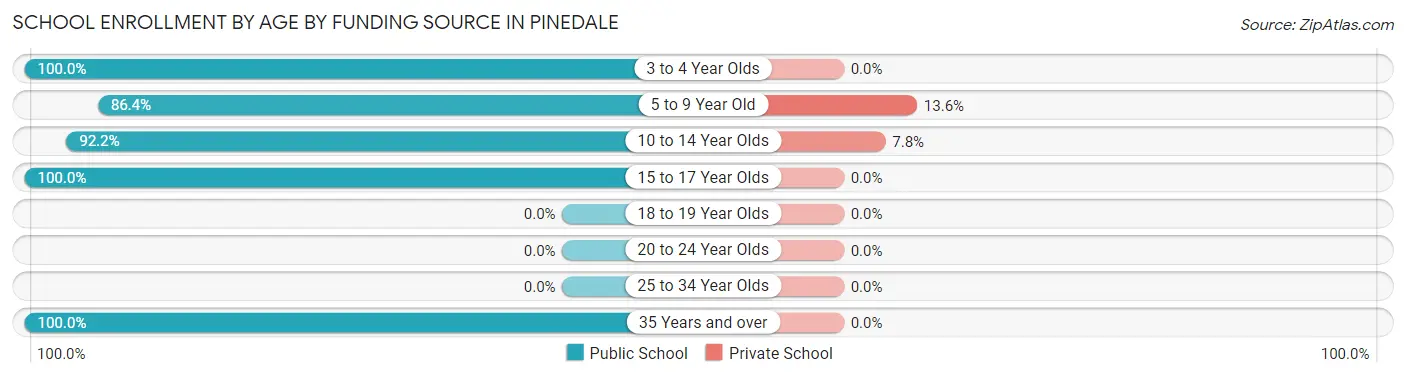
| Age Bracket | Public School | Private School |
| 3 to 4 Year Olds | 9 (100.0%) | 0 (0.0%) |
| 5 to 9 Year Old | 95 (86.4%) | 15 (13.6%) |
| 10 to 14 Year Olds | 178 (92.2%) | 15 (7.8%) |
| 15 to 17 Year Olds | 95 (100.0%) | 0 (0.0%) |
| 18 to 19 Year Olds | 0 (0.0%) | 0 (0.0%) |
| 20 to 24 Year Olds | 0 (0.0%) | 0 (0.0%) |
| 25 to 34 Year Olds | 0 (0.0%) | 0 (0.0%) |
| 35 Years and over | 18 (100.0%) | 0 (0.0%) |
| Total | 395 (92.9%) | 30 (7.1%) |
Educational Attainment by Field of Study in Pinedale
Bio, nature & agricultural (111 | 24.1%), business (81 | 17.6%), arts & humanities (70 | 15.2%), social sciences (58 | 12.6%), and engineering (38 | 8.2%) are the most common fields of study among 461 individuals in Pinedale who have obtained a bachelor's degree or higher.
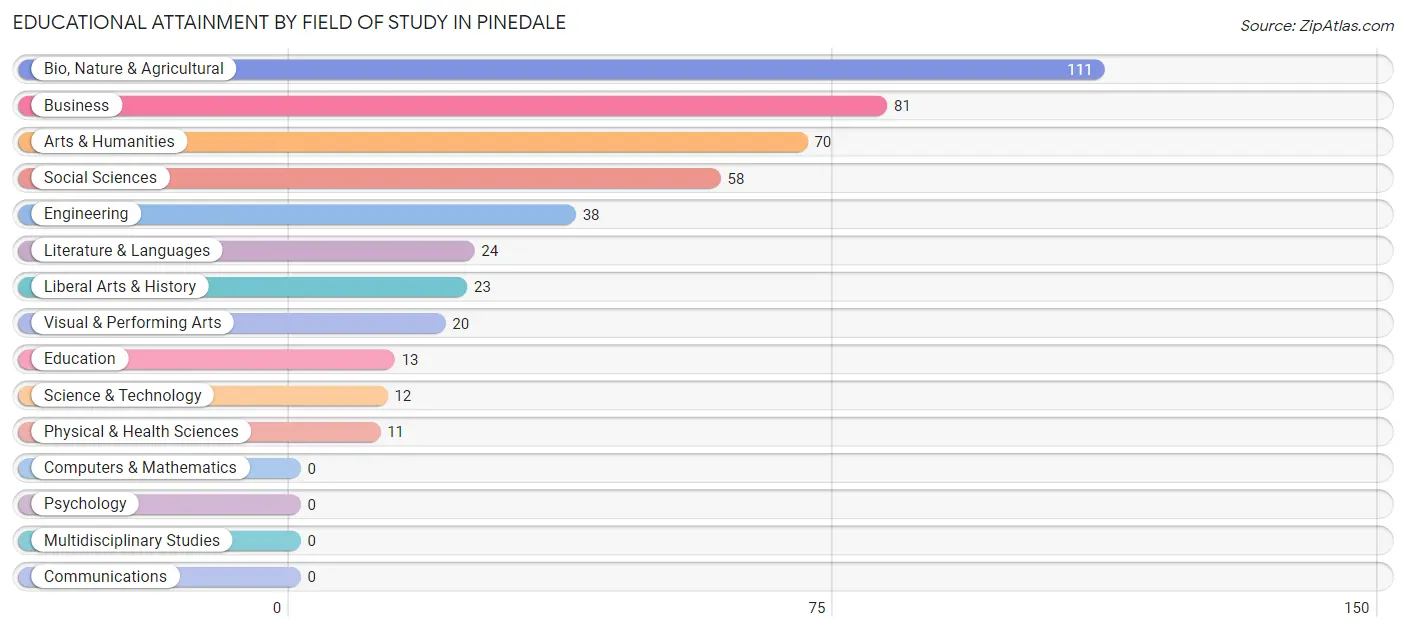
| Field of Study | # Graduates | % Graduates |
| Computers & Mathematics | 0 | 0.0% |
| Bio, Nature & Agricultural | 111 | 24.1% |
| Physical & Health Sciences | 11 | 2.4% |
| Psychology | 0 | 0.0% |
| Social Sciences | 58 | 12.6% |
| Engineering | 38 | 8.2% |
| Multidisciplinary Studies | 0 | 0.0% |
| Science & Technology | 12 | 2.6% |
| Business | 81 | 17.6% |
| Education | 13 | 2.8% |
| Literature & Languages | 24 | 5.2% |
| Liberal Arts & History | 23 | 5.0% |
| Visual & Performing Arts | 20 | 4.3% |
| Communications | 0 | 0.0% |
| Arts & Humanities | 70 | 15.2% |
| Total | 461 | 100.0% |
Transportation & Commute in Pinedale
Vehicle Availability by Sex in Pinedale
The most prevalent vehicle ownership categories in Pinedale are males with 2 vehicles (279, accounting for 58.0%) and females with 2 vehicles (170, making up 57.9%).
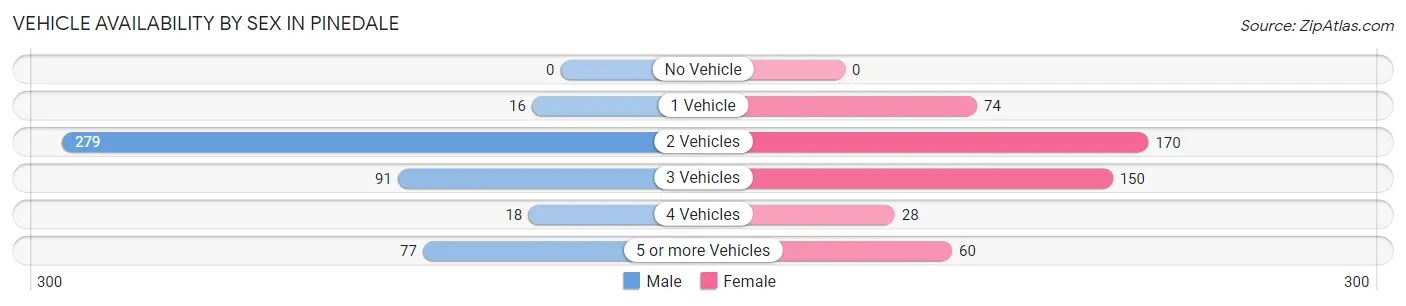
| Vehicles Available | Male | Female |
| No Vehicle | 0 (0.0%) | 0 (0.0%) |
| 1 Vehicle | 16 (3.3%) | 74 (15.3%) |
| 2 Vehicles | 279 (58.0%) | 170 (35.3%) |
| 3 Vehicles | 91 (18.9%) | 150 (31.1%) |
| 4 Vehicles | 18 (3.7%) | 28 (5.8%) |
| 5 or more Vehicles | 77 (16.0%) | 60 (12.4%) |
| Total | 481 (100.0%) | 482 (100.0%) |
Commute Time in Pinedale
The most frequently occuring commute durations in Pinedale are 5 to 9 minutes (358 commuters, 38.0%), 30 to 34 minutes (156 commuters, 16.6%), and less than 5 minutes (138 commuters, 14.6%).
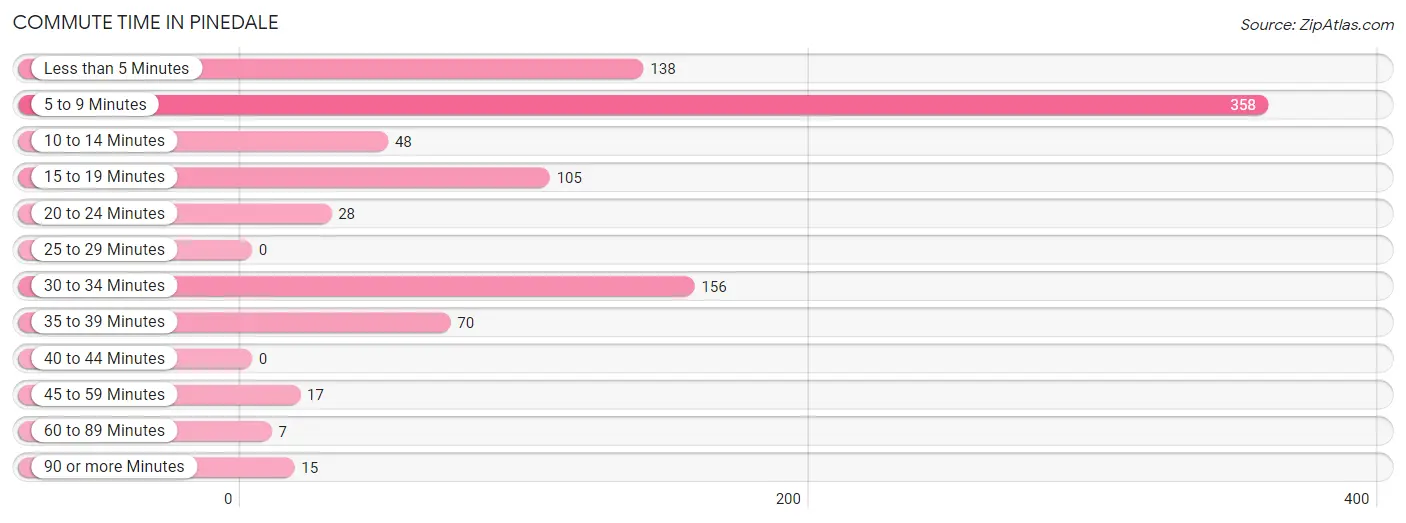
| Commute Time | # Commuters | % Commuters |
| Less than 5 Minutes | 138 | 14.6% |
| 5 to 9 Minutes | 358 | 38.0% |
| 10 to 14 Minutes | 48 | 5.1% |
| 15 to 19 Minutes | 105 | 11.2% |
| 20 to 24 Minutes | 28 | 3.0% |
| 25 to 29 Minutes | 0 | 0.0% |
| 30 to 34 Minutes | 156 | 16.6% |
| 35 to 39 Minutes | 70 | 7.4% |
| 40 to 44 Minutes | 0 | 0.0% |
| 45 to 59 Minutes | 17 | 1.8% |
| 60 to 89 Minutes | 7 | 0.7% |
| 90 or more Minutes | 15 | 1.6% |
Commute Time by Sex in Pinedale
The most common commute times in Pinedale are 5 to 9 minutes (131 commuters, 27.2%) for males and 5 to 9 minutes (227 commuters, 49.3%) for females.
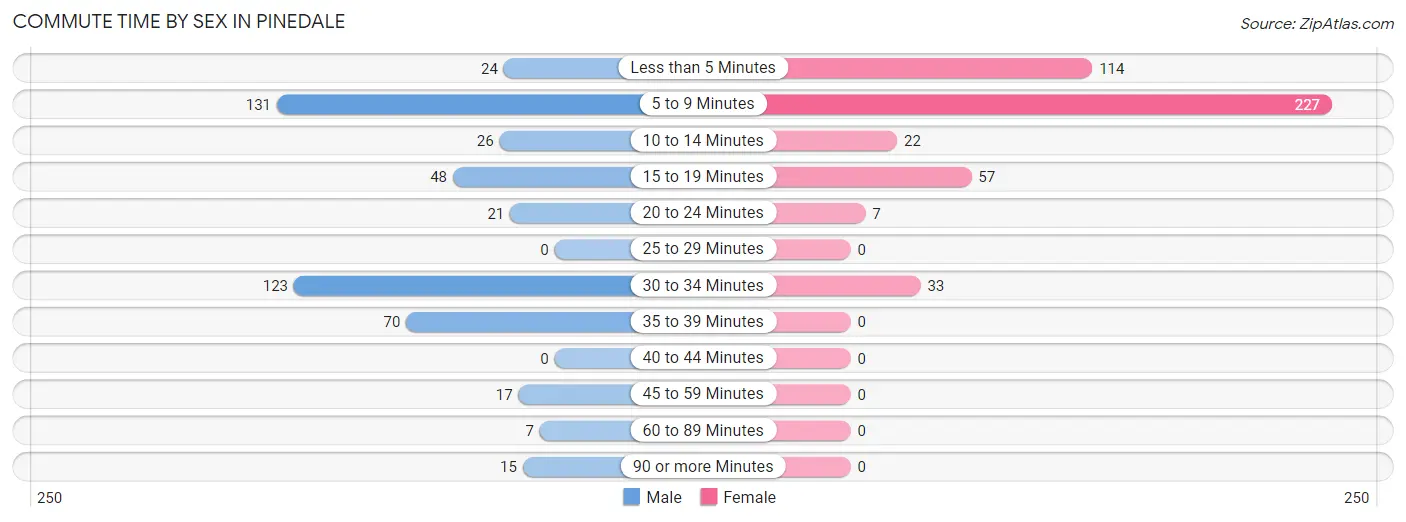
| Commute Time | Male | Female |
| Less than 5 Minutes | 24 (5.0%) | 114 (24.8%) |
| 5 to 9 Minutes | 131 (27.2%) | 227 (49.3%) |
| 10 to 14 Minutes | 26 (5.4%) | 22 (4.8%) |
| 15 to 19 Minutes | 48 (10.0%) | 57 (12.4%) |
| 20 to 24 Minutes | 21 (4.4%) | 7 (1.5%) |
| 25 to 29 Minutes | 0 (0.0%) | 0 (0.0%) |
| 30 to 34 Minutes | 123 (25.5%) | 33 (7.2%) |
| 35 to 39 Minutes | 70 (14.5%) | 0 (0.0%) |
| 40 to 44 Minutes | 0 (0.0%) | 0 (0.0%) |
| 45 to 59 Minutes | 17 (3.5%) | 0 (0.0%) |
| 60 to 89 Minutes | 7 (1.5%) | 0 (0.0%) |
| 90 or more Minutes | 15 (3.1%) | 0 (0.0%) |
Time of Departure to Work by Sex in Pinedale
The most frequent times of departure to work in Pinedale are 6:30 AM to 6:59 AM (124, 25.7%) for males and 7:00 AM to 7:29 AM (116, 25.2%) for females.
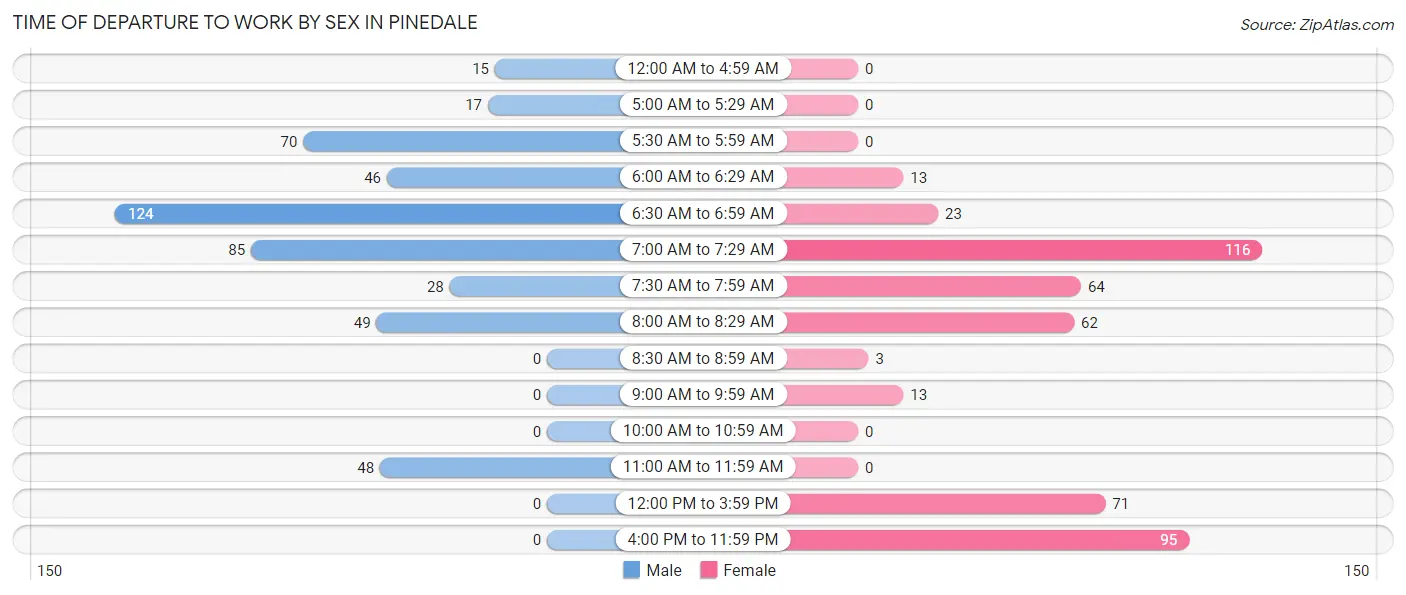
| Time of Departure | Male | Female |
| 12:00 AM to 4:59 AM | 15 (3.1%) | 0 (0.0%) |
| 5:00 AM to 5:29 AM | 17 (3.5%) | 0 (0.0%) |
| 5:30 AM to 5:59 AM | 70 (14.5%) | 0 (0.0%) |
| 6:00 AM to 6:29 AM | 46 (9.5%) | 13 (2.8%) |
| 6:30 AM to 6:59 AM | 124 (25.7%) | 23 (5.0%) |
| 7:00 AM to 7:29 AM | 85 (17.6%) | 116 (25.2%) |
| 7:30 AM to 7:59 AM | 28 (5.8%) | 64 (13.9%) |
| 8:00 AM to 8:29 AM | 49 (10.2%) | 62 (13.5%) |
| 8:30 AM to 8:59 AM | 0 (0.0%) | 3 (0.6%) |
| 9:00 AM to 9:59 AM | 0 (0.0%) | 13 (2.8%) |
| 10:00 AM to 10:59 AM | 0 (0.0%) | 0 (0.0%) |
| 11:00 AM to 11:59 AM | 48 (10.0%) | 0 (0.0%) |
| 12:00 PM to 3:59 PM | 0 (0.0%) | 71 (15.4%) |
| 4:00 PM to 11:59 PM | 0 (0.0%) | 95 (20.6%) |
| Total | 482 (100.0%) | 460 (100.0%) |
Housing Occupancy in Pinedale
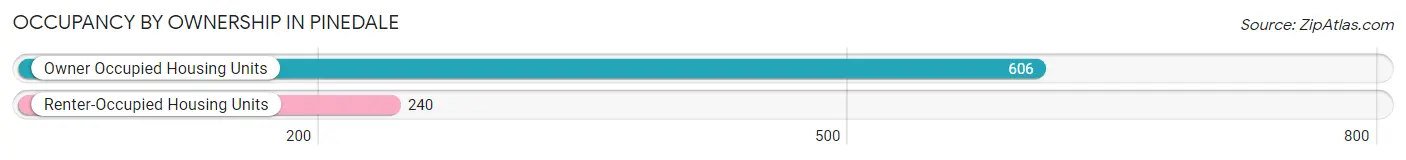
Occupancy by Ownership in Pinedale
Of the total 846 dwellings in Pinedale, owner-occupied units account for 606 (71.6%), while renter-occupied units make up 240 (28.4%).
| Occupancy | # Housing Units | % Housing Units |
| Owner Occupied Housing Units | 606 | 71.6% |
| Renter-Occupied Housing Units | 240 | 28.4% |
| Total Occupied Housing Units | 846 | 100.0% |
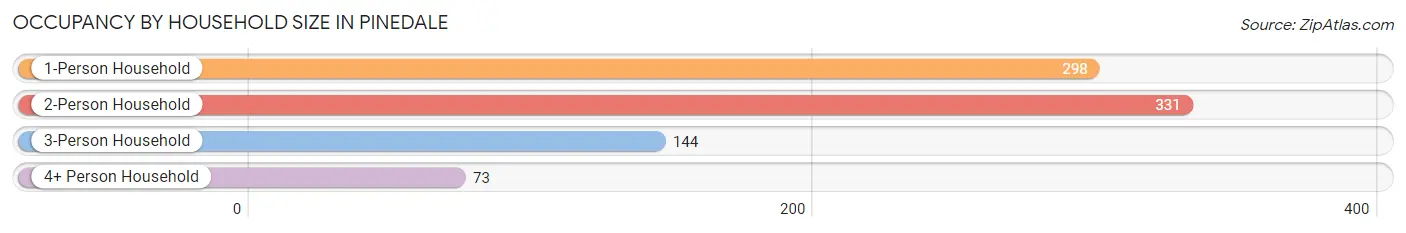
Occupancy by Household Size in Pinedale
| Household Size | # Housing Units | % Housing Units |
| 1-Person Household | 298 | 35.2% |
| 2-Person Household | 331 | 39.1% |
| 3-Person Household | 144 | 17.0% |
| 4+ Person Household | 73 | 8.6% |
| Total Housing Units | 846 | 100.0% |
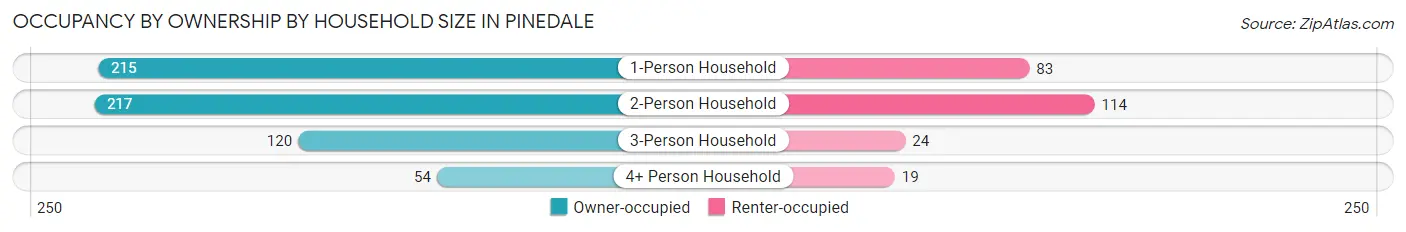
Occupancy by Ownership by Household Size in Pinedale
| Household Size | Owner-occupied | Renter-occupied |
| 1-Person Household | 215 (72.2%) | 83 (27.9%) |
| 2-Person Household | 217 (65.6%) | 114 (34.4%) |
| 3-Person Household | 120 (83.3%) | 24 (16.7%) |
| 4+ Person Household | 54 (74.0%) | 19 (26.0%) |
| Total Housing Units | 606 (71.6%) | 240 (28.4%) |
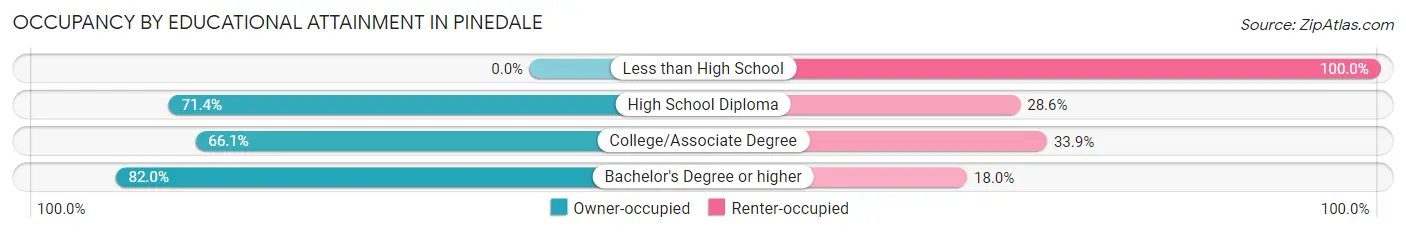
Occupancy by Educational Attainment in Pinedale
| Household Size | Owner-occupied | Renter-occupied |
| Less than High School | 0 (0.0%) | 6 (100.0%) |
| High School Diploma | 30 (71.4%) | 12 (28.6%) |
| College/Associate Degree | 326 (66.1%) | 167 (33.9%) |
| Bachelor's Degree or higher | 250 (82.0%) | 55 (18.0%) |
Occupancy by Age of Householder in Pinedale
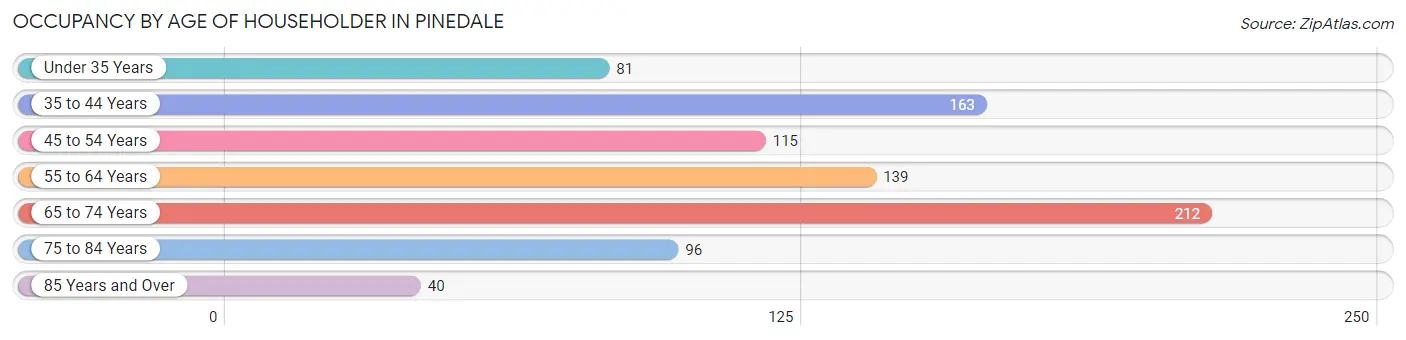
| Age Bracket | # Households | % Households |
| Under 35 Years | 81 | 9.6% |
| 35 to 44 Years | 163 | 19.3% |
| 45 to 54 Years | 115 | 13.6% |
| 55 to 64 Years | 139 | 16.4% |
| 65 to 74 Years | 212 | 25.1% |
| 75 to 84 Years | 96 | 11.4% |
| 85 Years and Over | 40 | 4.7% |
| Total | 846 | 100.0% |
Housing Finances in Pinedale
Median Income by Occupancy in Pinedale
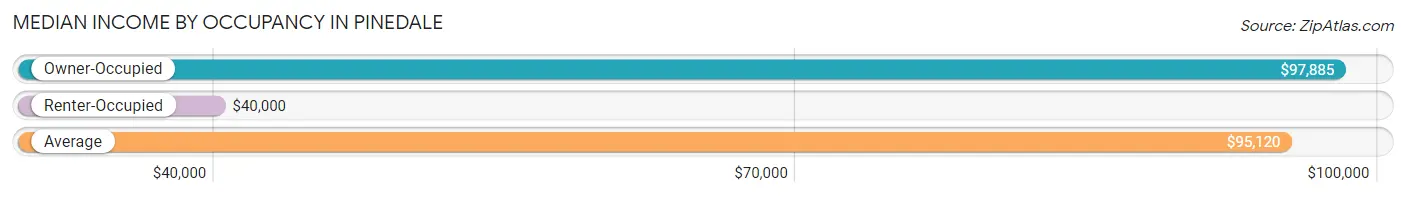
| Occupancy Type | # Households | Median Income |
| Owner-Occupied | 606 (71.6%) | $97,885 |
| Renter-Occupied | 240 (28.4%) | $40,000 |
| Average | 846 (100.0%) | $95,120 |
Occupancy by Householder Income Bracket in Pinedale
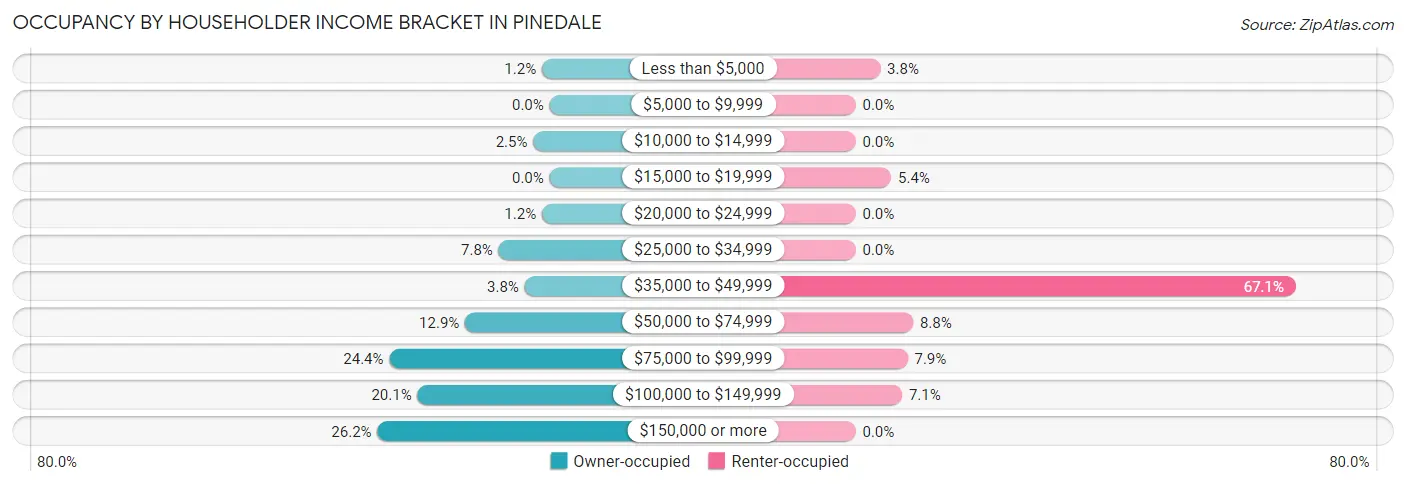
| Income Bracket | Owner-occupied | Renter-occupied |
| Less than $5,000 | 7 (1.2%) | 9 (3.7%) |
| $5,000 to $9,999 | 0 (0.0%) | 0 (0.0%) |
| $10,000 to $14,999 | 15 (2.5%) | 0 (0.0%) |
| $15,000 to $19,999 | 0 (0.0%) | 13 (5.4%) |
| $20,000 to $24,999 | 7 (1.2%) | 0 (0.0%) |
| $25,000 to $34,999 | 47 (7.8%) | 0 (0.0%) |
| $35,000 to $49,999 | 23 (3.8%) | 161 (67.1%) |
| $50,000 to $74,999 | 78 (12.9%) | 21 (8.7%) |
| $75,000 to $99,999 | 148 (24.4%) | 19 (7.9%) |
| $100,000 to $149,999 | 122 (20.1%) | 17 (7.1%) |
| $150,000 or more | 159 (26.2%) | 0 (0.0%) |
| Total | 606 (100.0%) | 240 (100.0%) |
Monthly Housing Cost Tiers in Pinedale
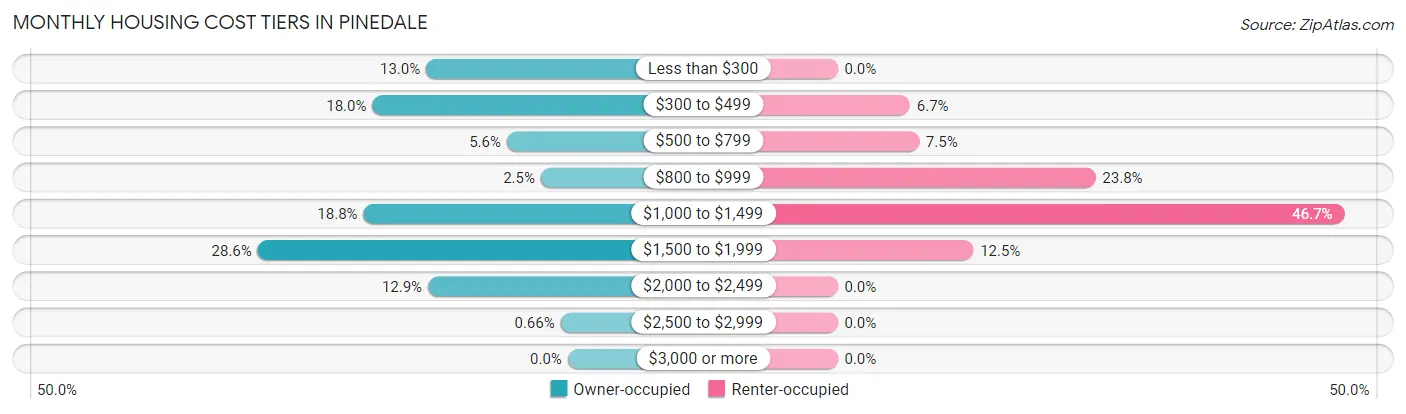
| Monthly Cost | Owner-occupied | Renter-occupied |
| Less than $300 | 79 (13.0%) | 0 (0.0%) |
| $300 to $499 | 109 (18.0%) | 16 (6.7%) |
| $500 to $799 | 34 (5.6%) | 18 (7.5%) |
| $800 to $999 | 15 (2.5%) | 57 (23.7%) |
| $1,000 to $1,499 | 114 (18.8%) | 112 (46.7%) |
| $1,500 to $1,999 | 173 (28.5%) | 30 (12.5%) |
| $2,000 to $2,499 | 78 (12.9%) | 0 (0.0%) |
| $2,500 to $2,999 | 4 (0.7%) | 0 (0.0%) |
| $3,000 or more | 0 (0.0%) | 0 (0.0%) |
| Total | 606 (100.0%) | 240 (100.0%) |
Physical Housing Characteristics in Pinedale
Housing Structures in Pinedale
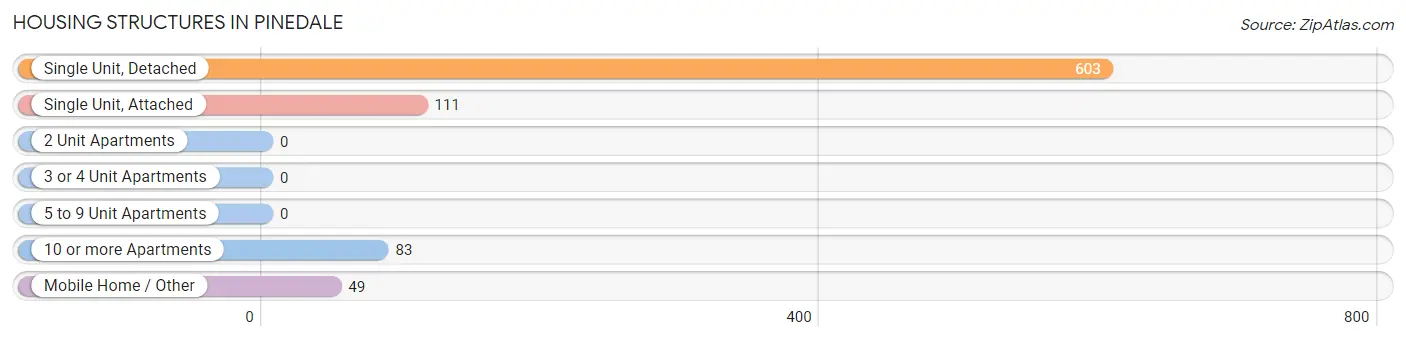
| Structure Type | # Housing Units | % Housing Units |
| Single Unit, Detached | 603 | 71.3% |
| Single Unit, Attached | 111 | 13.1% |
| 2 Unit Apartments | 0 | 0.0% |
| 3 or 4 Unit Apartments | 0 | 0.0% |
| 5 to 9 Unit Apartments | 0 | 0.0% |
| 10 or more Apartments | 83 | 9.8% |
| Mobile Home / Other | 49 | 5.8% |
| Total | 846 | 100.0% |
Housing Structures by Occupancy in Pinedale
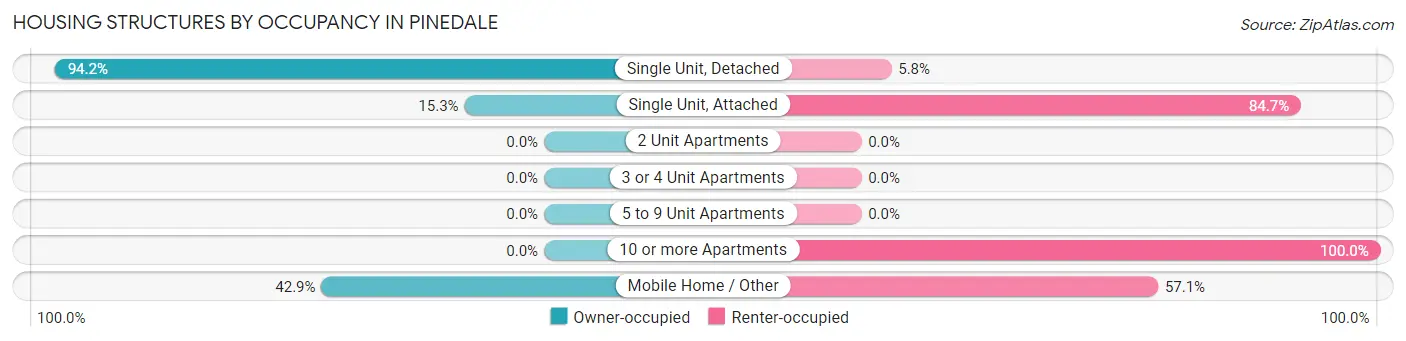
| Structure Type | Owner-occupied | Renter-occupied |
| Single Unit, Detached | 568 (94.2%) | 35 (5.8%) |
| Single Unit, Attached | 17 (15.3%) | 94 (84.7%) |
| 2 Unit Apartments | 0 (0.0%) | 0 (0.0%) |
| 3 or 4 Unit Apartments | 0 (0.0%) | 0 (0.0%) |
| 5 to 9 Unit Apartments | 0 (0.0%) | 0 (0.0%) |
| 10 or more Apartments | 0 (0.0%) | 83 (100.0%) |
| Mobile Home / Other | 21 (42.9%) | 28 (57.1%) |
| Total | 606 (71.6%) | 240 (28.4%) |
Housing Structures by Number of Rooms in Pinedale
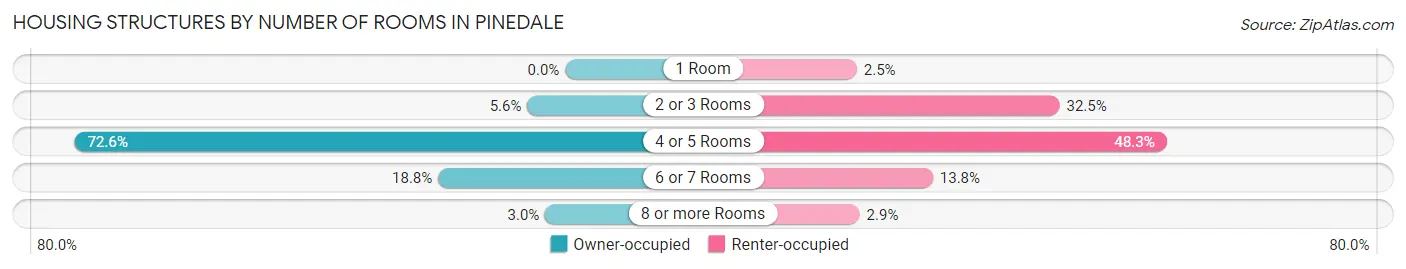
| Number of Rooms | Owner-occupied | Renter-occupied |
| 1 Room | 0 (0.0%) | 6 (2.5%) |
| 2 or 3 Rooms | 34 (5.6%) | 78 (32.5%) |
| 4 or 5 Rooms | 440 (72.6%) | 116 (48.3%) |
| 6 or 7 Rooms | 114 (18.8%) | 33 (13.8%) |
| 8 or more Rooms | 18 (3.0%) | 7 (2.9%) |
| Total | 606 (100.0%) | 240 (100.0%) |
Housing Structure by Heating Type in Pinedale
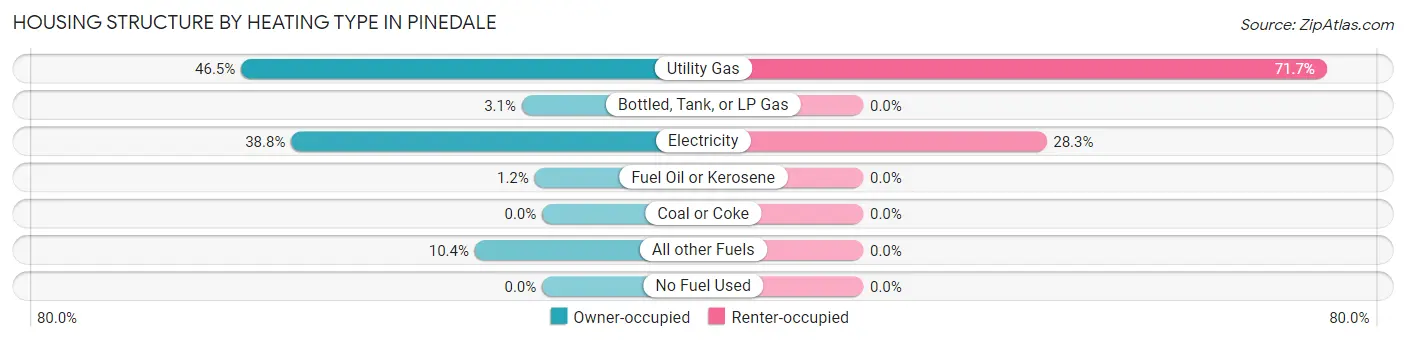
| Heating Type | Owner-occupied | Renter-occupied |
| Utility Gas | 282 (46.5%) | 172 (71.7%) |
| Bottled, Tank, or LP Gas | 19 (3.1%) | 0 (0.0%) |
| Electricity | 235 (38.8%) | 68 (28.3%) |
| Fuel Oil or Kerosene | 7 (1.2%) | 0 (0.0%) |
| Coal or Coke | 0 (0.0%) | 0 (0.0%) |
| All other Fuels | 63 (10.4%) | 0 (0.0%) |
| No Fuel Used | 0 (0.0%) | 0 (0.0%) |
| Total | 606 (100.0%) | 240 (100.0%) |
Household Vehicle Usage in Pinedale
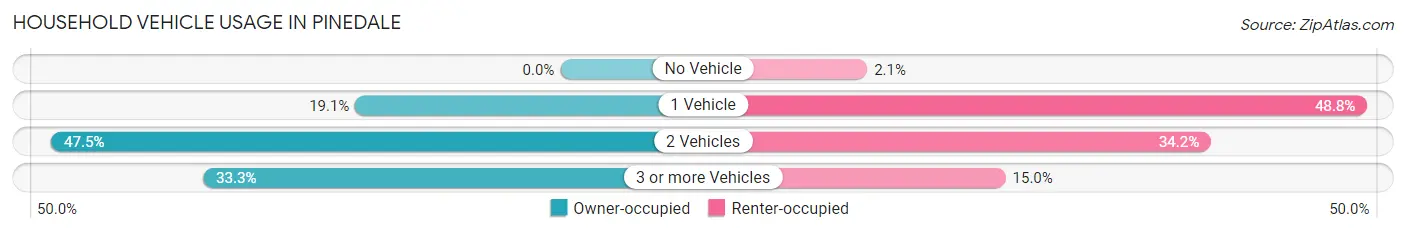
| Vehicles per Household | Owner-occupied | Renter-occupied |
| No Vehicle | 0 (0.0%) | 5 (2.1%) |
| 1 Vehicle | 116 (19.1%) | 117 (48.7%) |
| 2 Vehicles | 288 (47.5%) | 82 (34.2%) |
| 3 or more Vehicles | 202 (33.3%) | 36 (15.0%) |
| Total | 606 (100.0%) | 240 (100.0%) |
Real Estate & Mortgages in Pinedale
Real Estate and Mortgage Overview in Pinedale
| Characteristic | Without Mortgage | With Mortgage |
| Housing Units | 193 | 413 |
| Median Property Value | $244,000 | $277,600 |
| Median Household Income | - | - |
| Monthly Housing Costs | $353 | $0 |
| Real Estate Taxes | $945 | $0 |
Property Value by Mortgage Status in Pinedale
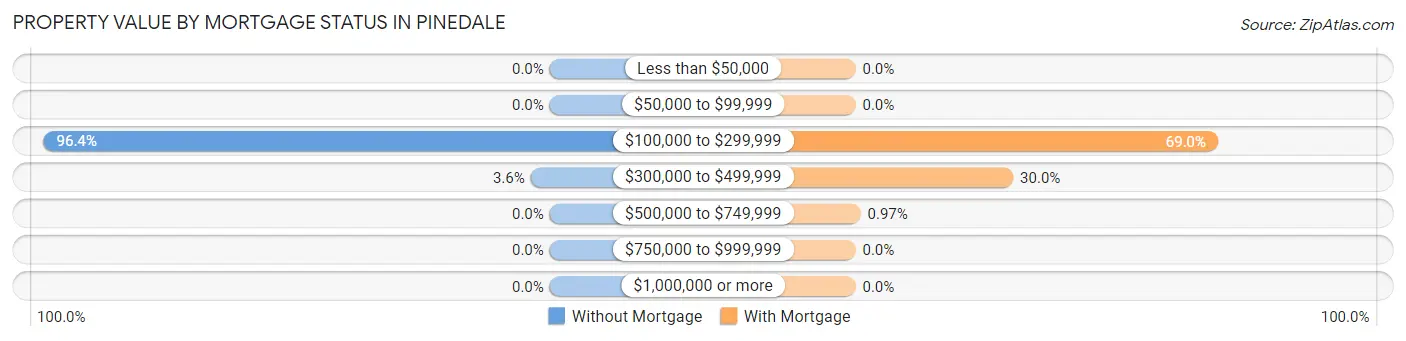
| Property Value | Without Mortgage | With Mortgage |
| Less than $50,000 | 0 (0.0%) | 0 (0.0%) |
| $50,000 to $99,999 | 0 (0.0%) | 0 (0.0%) |
| $100,000 to $299,999 | 186 (96.4%) | 285 (69.0%) |
| $300,000 to $499,999 | 7 (3.6%) | 124 (30.0%) |
| $500,000 to $749,999 | 0 (0.0%) | 4 (1.0%) |
| $750,000 to $999,999 | 0 (0.0%) | 0 (0.0%) |
| $1,000,000 or more | 0 (0.0%) | 0 (0.0%) |
| Total | 193 (100.0%) | 413 (100.0%) |
Household Income by Mortgage Status in Pinedale
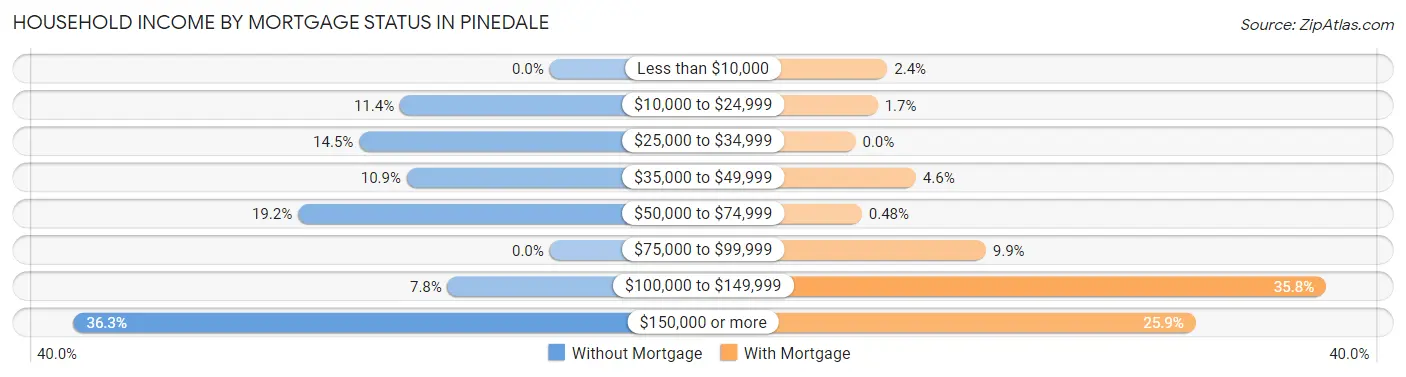
| Household Income | Without Mortgage | With Mortgage |
| Less than $10,000 | 0 (0.0%) | 10 (2.4%) |
| $10,000 to $24,999 | 22 (11.4%) | 7 (1.7%) |
| $25,000 to $34,999 | 28 (14.5%) | 0 (0.0%) |
| $35,000 to $49,999 | 21 (10.9%) | 19 (4.6%) |
| $50,000 to $74,999 | 37 (19.2%) | 2 (0.5%) |
| $75,000 to $99,999 | 0 (0.0%) | 41 (9.9%) |
| $100,000 to $149,999 | 15 (7.8%) | 148 (35.8%) |
| $150,000 or more | 70 (36.3%) | 107 (25.9%) |
| Total | 193 (100.0%) | 413 (100.0%) |
Property Value to Household Income Ratio in Pinedale
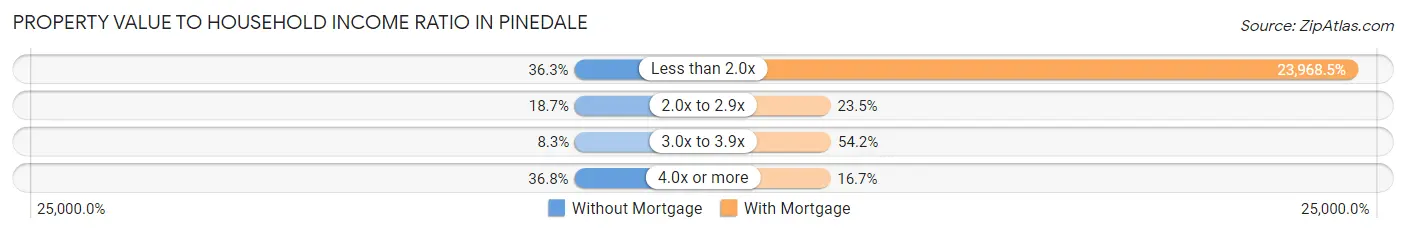
| Value-to-Income Ratio | Without Mortgage | With Mortgage |
| Less than 2.0x | 70 (36.3%) | 98,990 (23,968.5%) |
| 2.0x to 2.9x | 36 (18.6%) | 97 (23.5%) |
| 3.0x to 3.9x | 16 (8.3%) | 224 (54.2%) |
| 4.0x or more | 71 (36.8%) | 69 (16.7%) |
| Total | 193 (100.0%) | 413 (100.0%) |
Real Estate Taxes by Mortgage Status in Pinedale
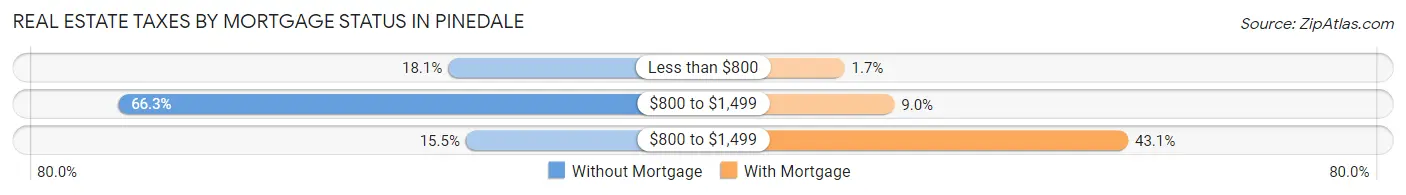
| Property Taxes | Without Mortgage | With Mortgage |
| Less than $800 | 35 (18.1%) | 7 (1.7%) |
| $800 to $1,499 | 128 (66.3%) | 37 (9.0%) |
| $800 to $1,499 | 30 (15.5%) | 178 (43.1%) |
| Total | 193 (100.0%) | 413 (100.0%) |
Health & Disability in Pinedale
Health Insurance Coverage by Age in Pinedale
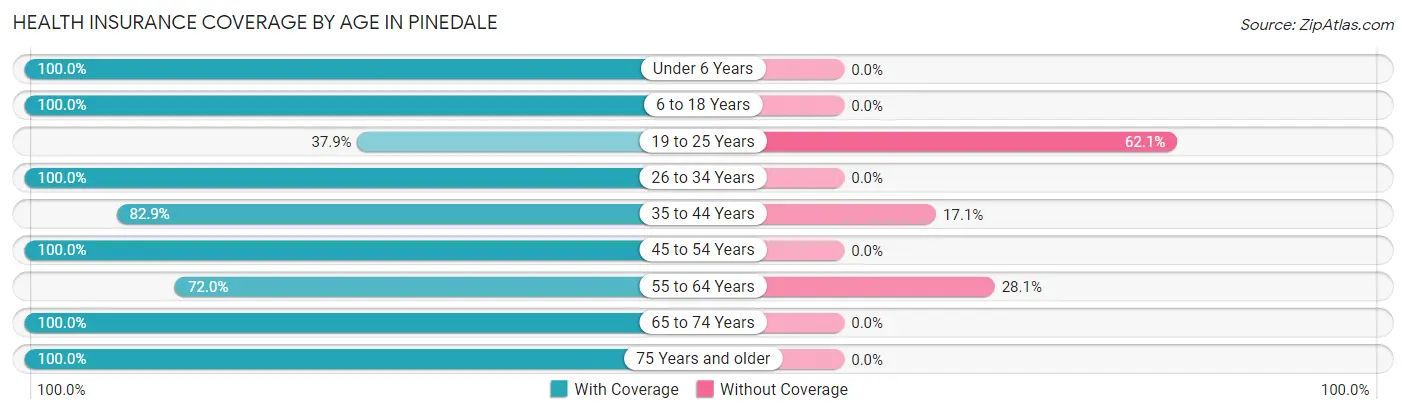
| Age Bracket | With Coverage | Without Coverage |
| Under 6 Years | 111 (100.0%) | 0 (0.0%) |
| 6 to 18 Years | 370 (100.0%) | 0 (0.0%) |
| 19 to 25 Years | 33 (37.9%) | 54 (62.1%) |
| 26 to 34 Years | 91 (100.0%) | 0 (0.0%) |
| 35 to 44 Years | 295 (82.9%) | 61 (17.1%) |
| 45 to 54 Years | 279 (100.0%) | 0 (0.0%) |
| 55 to 64 Years | 118 (72.0%) | 46 (28.1%) |
| 65 to 74 Years | 300 (100.0%) | 0 (0.0%) |
| 75 Years and older | 160 (100.0%) | 0 (0.0%) |
| Total | 1,757 (91.6%) | 161 (8.4%) |
Health Insurance Coverage by Citizenship Status in Pinedale

| Citizenship Status | With Coverage | Without Coverage |
| Native Born | 111 (100.0%) | 0 (0.0%) |
| Foreign Born, Citizen | 370 (100.0%) | 0 (0.0%) |
| Foreign Born, not a Citizen | 33 (37.9%) | 54 (62.1%) |
Health Insurance Coverage by Household Income in Pinedale
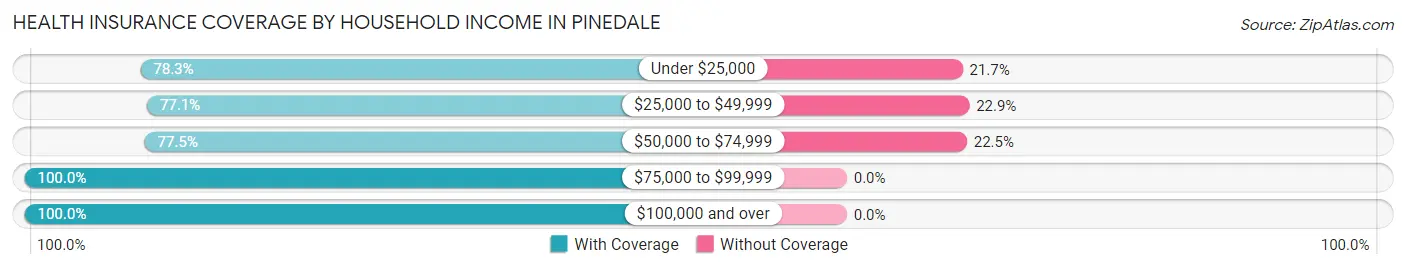
| Household Income | With Coverage | Without Coverage |
| Under $25,000 | 65 (78.3%) | 18 (21.7%) |
| $25,000 to $49,999 | 316 (77.1%) | 94 (22.9%) |
| $50,000 to $74,999 | 169 (77.5%) | 49 (22.5%) |
| $75,000 to $99,999 | 313 (100.0%) | 0 (0.0%) |
| $100,000 and over | 891 (100.0%) | 0 (0.0%) |
Public vs Private Health Insurance Coverage by Age in Pinedale
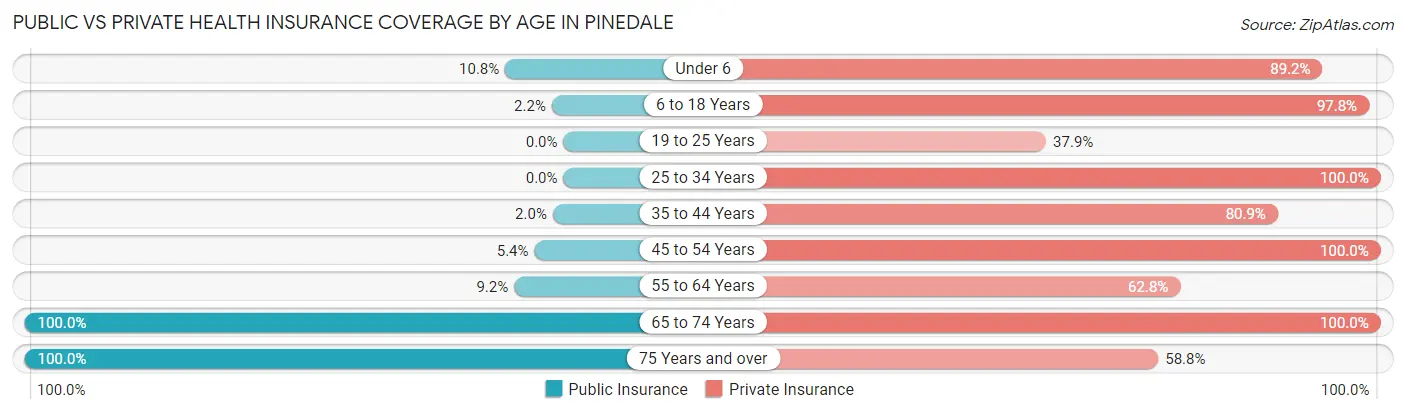
| Age Bracket | Public Insurance | Private Insurance |
| Under 6 | 12 (10.8%) | 99 (89.2%) |
| 6 to 18 Years | 8 (2.2%) | 362 (97.8%) |
| 19 to 25 Years | 0 (0.0%) | 33 (37.9%) |
| 25 to 34 Years | 0 (0.0%) | 91 (100.0%) |
| 35 to 44 Years | 7 (2.0%) | 288 (80.9%) |
| 45 to 54 Years | 15 (5.4%) | 279 (100.0%) |
| 55 to 64 Years | 15 (9.1%) | 103 (62.8%) |
| 65 to 74 Years | 300 (100.0%) | 300 (100.0%) |
| 75 Years and over | 160 (100.0%) | 94 (58.8%) |
| Total | 517 (27.0%) | 1,649 (86.0%) |
Disability Status by Sex by Age in Pinedale
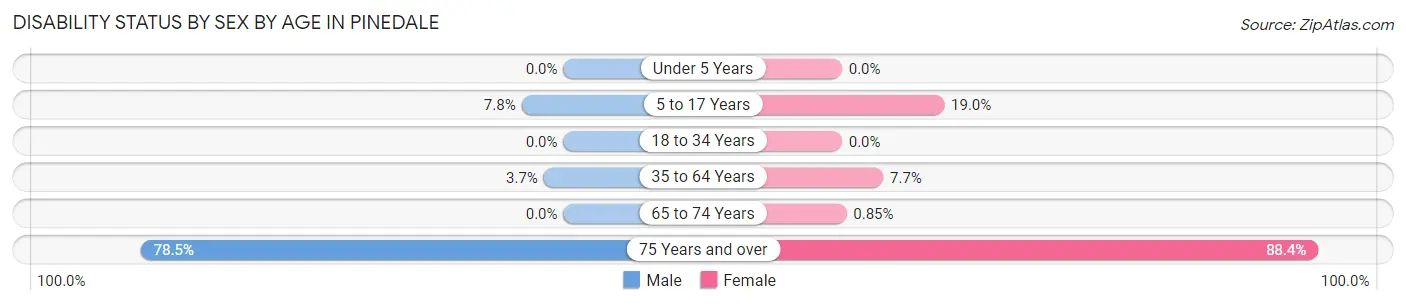
| Age Bracket | Male | Female |
| Under 5 Years | 0 (0.0%) | 0 (0.0%) |
| 5 to 17 Years | 22 (7.8%) | 30 (19.0%) |
| 18 to 34 Years | 0 (0.0%) | 0 (0.0%) |
| 35 to 64 Years | 13 (3.6%) | 34 (7.7%) |
| 65 to 74 Years | 0 (0.0%) | 2 (0.9%) |
| 75 Years and over | 51 (78.5%) | 84 (88.4%) |
Disability Class by Sex by Age in Pinedale
Disability Class: Hearing Difficulty
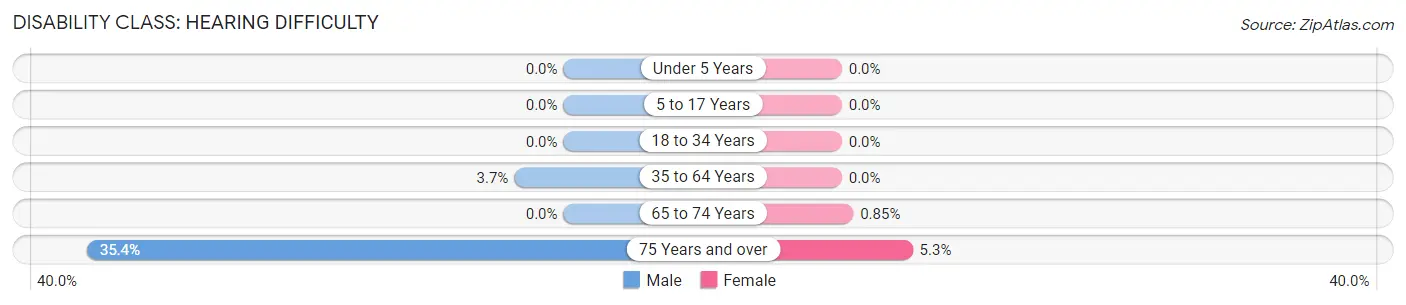
| Age Bracket | Male | Female |
| Under 5 Years | 0 (0.0%) | 0 (0.0%) |
| 5 to 17 Years | 0 (0.0%) | 0 (0.0%) |
| 18 to 34 Years | 0 (0.0%) | 0 (0.0%) |
| 35 to 64 Years | 13 (3.6%) | 0 (0.0%) |
| 65 to 74 Years | 0 (0.0%) | 2 (0.9%) |
| 75 Years and over | 23 (35.4%) | 5 (5.3%) |
Disability Class: Vision Difficulty
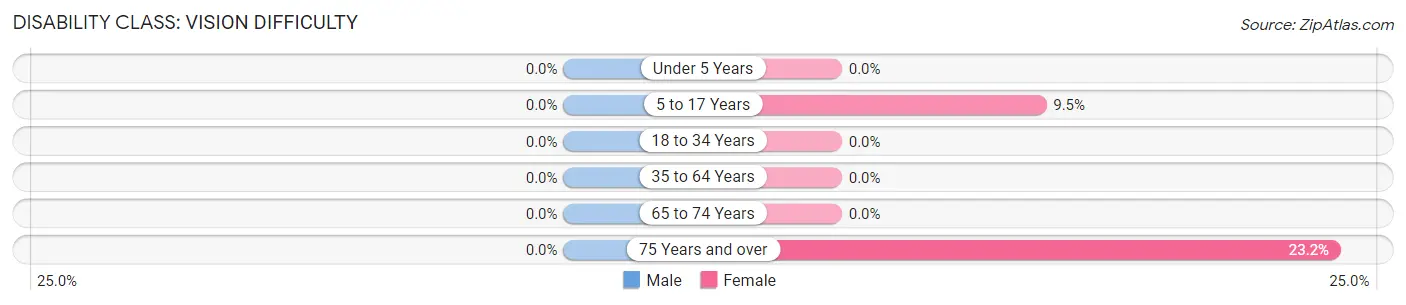
| Age Bracket | Male | Female |
| Under 5 Years | 0 (0.0%) | 0 (0.0%) |
| 5 to 17 Years | 0 (0.0%) | 15 (9.5%) |
| 18 to 34 Years | 0 (0.0%) | 0 (0.0%) |
| 35 to 64 Years | 0 (0.0%) | 0 (0.0%) |
| 65 to 74 Years | 0 (0.0%) | 0 (0.0%) |
| 75 Years and over | 0 (0.0%) | 22 (23.2%) |
Disability Class: Cognitive Difficulty
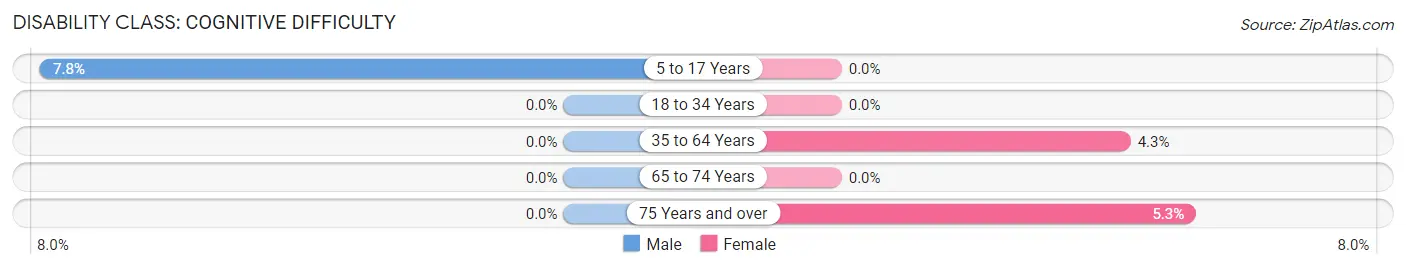
| Age Bracket | Male | Female |
| 5 to 17 Years | 22 (7.8%) | 0 (0.0%) |
| 18 to 34 Years | 0 (0.0%) | 0 (0.0%) |
| 35 to 64 Years | 0 (0.0%) | 19 (4.3%) |
| 65 to 74 Years | 0 (0.0%) | 0 (0.0%) |
| 75 Years and over | 0 (0.0%) | 5 (5.3%) |
Disability Class: Ambulatory Difficulty
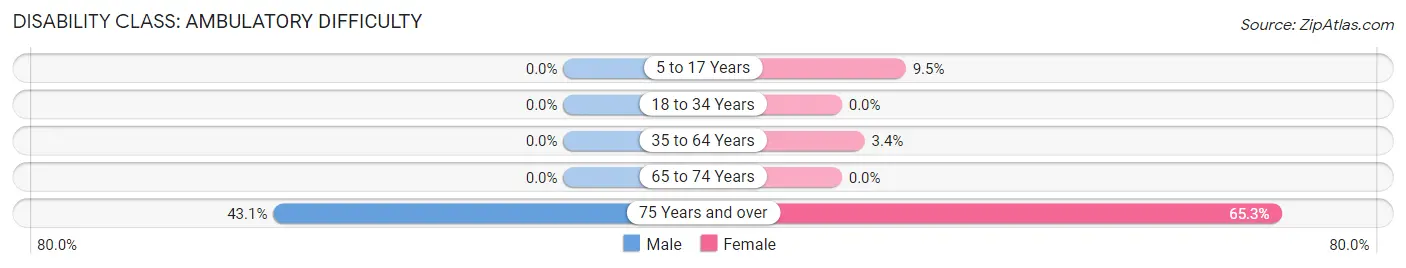
| Age Bracket | Male | Female |
| 5 to 17 Years | 0 (0.0%) | 15 (9.5%) |
| 18 to 34 Years | 0 (0.0%) | 0 (0.0%) |
| 35 to 64 Years | 0 (0.0%) | 15 (3.4%) |
| 65 to 74 Years | 0 (0.0%) | 0 (0.0%) |
| 75 Years and over | 28 (43.1%) | 62 (65.3%) |
Disability Class: Self-Care Difficulty
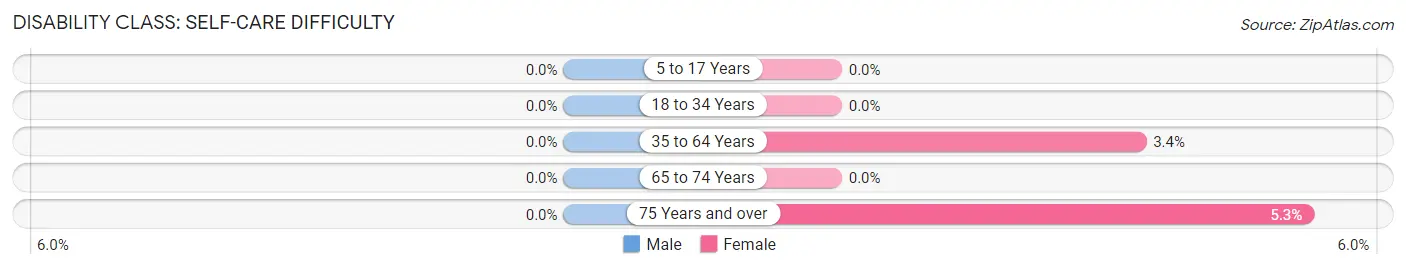
| Age Bracket | Male | Female |
| 5 to 17 Years | 0 (0.0%) | 0 (0.0%) |
| 18 to 34 Years | 0 (0.0%) | 0 (0.0%) |
| 35 to 64 Years | 0 (0.0%) | 15 (3.4%) |
| 65 to 74 Years | 0 (0.0%) | 0 (0.0%) |
| 75 Years and over | 0 (0.0%) | 5 (5.3%) |
Technology Access in Pinedale
Computing Device Access in Pinedale
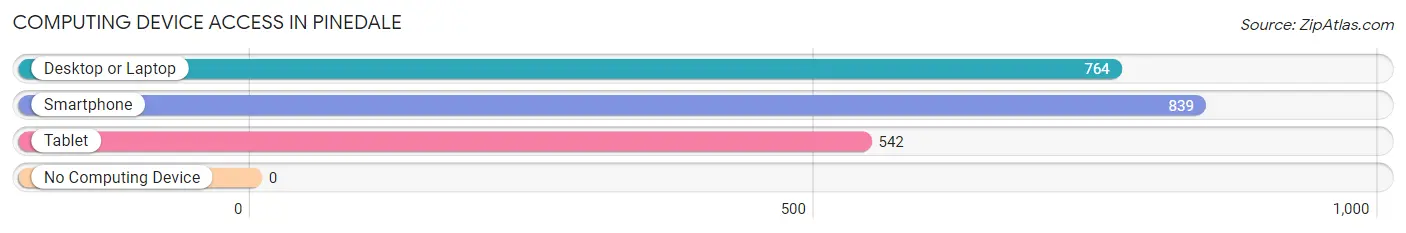
| Device Type | # Households | % Households |
| Desktop or Laptop | 764 | 90.3% |
| Smartphone | 839 | 99.2% |
| Tablet | 542 | 64.1% |
| No Computing Device | 0 | 0.0% |
| Total | 846 | 100.0% |
Internet Access in Pinedale
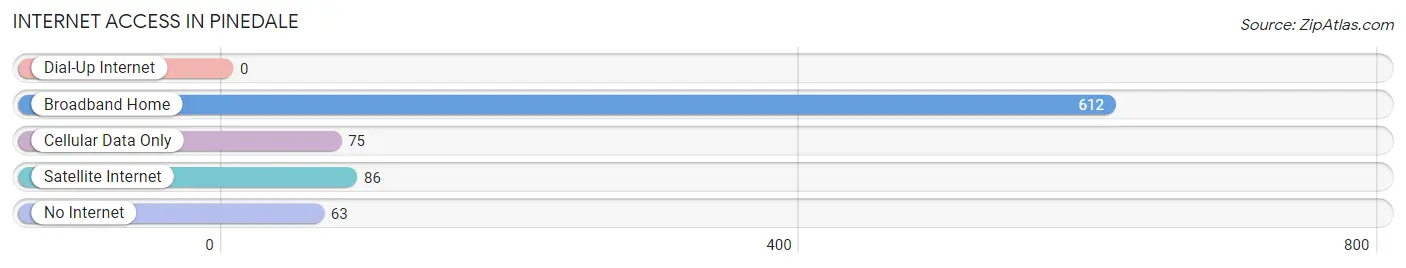
| Internet Type | # Households | % Households |
| Dial-Up Internet | 0 | 0.0% |
| Broadband Home | 612 | 72.3% |
| Cellular Data Only | 75 | 8.9% |
| Satellite Internet | 86 | 10.2% |
| No Internet | 63 | 7.4% |
| Total | 846 | 100.0% |
Pinedale Summary
Pinedale, Wyoming is a small town located in the western part of the state, in Sublette County. It is situated at the base of the Wind River Mountains, and is surrounded by the Bridger-Teton National Forest. The town is located at an elevation of 7,100 feet, and has a population of approximately 2,000 people.
History
Pinedale was first settled in the late 1800s by ranchers and homesteaders. The town was officially incorporated in 1906, and was named after the abundance of pine trees in the area. In the early 1900s, the town was a hub for the timber industry, and the local economy was largely based on the production of lumber.
In the 1950s, the town began to experience a decline in the timber industry, and the local economy shifted to focus on tourism and recreation. The town is now a popular destination for outdoor enthusiasts, and is home to a variety of recreational activities, including fishing, hunting, camping, and skiing.
Geography
Pinedale is located in the western part of Wyoming, in Sublette County. It is situated at the base of the Wind River Mountains, and is surrounded by the Bridger-Teton National Forest. The town is located at an elevation of 7,100 feet, and has a total area of 2.2 square miles.
The climate in Pinedale is semi-arid, with cold winters and mild summers. The average annual temperature is 37.5 degrees Fahrenheit, and the average annual precipitation is 11.5 inches.
Economy
The economy of Pinedale is largely based on tourism and recreation. The town is a popular destination for outdoor enthusiasts, and is home to a variety of recreational activities, including fishing, hunting, camping, and skiing.
The town is also home to a number of businesses, including restaurants, hotels, and retail stores. The local economy is also supported by the oil and gas industry, as well as the timber industry.
Demographics
As of the 2010 census, the population of Pinedale was 2,064. The racial makeup of the town was 95.3% White, 0.3% African American, 0.7% Native American, 0.3% Asian, 0.1% Pacific Islander, 1.2% from other races, and 2.3% from two or more races. Hispanic or Latino of any race were 4.2% of the population.
The median household income in Pinedale was $45,938, and the median family income was $51,250. The per capita income was $22,945. About 11.2% of families and 14.2% of the population were below the poverty line, including 17.2% of those under age 18 and 8.3% of those age 65 or over.
Common Questions
What is Per Capita Income in Pinedale?
Per Capita income in Pinedale is $57,316.
What is the Median Family Income in Pinedale?
Median Family Income in Pinedale is $96,190.
What is the Median Household income in Pinedale?
Median Household Income in Pinedale is $95,120.
What is Income or Wage Gap in Pinedale?
Income or Wage Gap in Pinedale is 36.8%.
Women in Pinedale earn 63.2 cents for every dollar earned by a man.
What is Inequality or Gini Index in Pinedale?
Inequality or Gini Index in Pinedale is 0.52.
What is the Total Population of Pinedale?
Total Population of Pinedale is 1,946.
What is the Total Male Population of Pinedale?
Total Male Population of Pinedale is 924.
What is the Total Female Population of Pinedale?
Total Female Population of Pinedale is 1,022.
What is the Ratio of Males per 100 Females in Pinedale?
There are 90.41 Males per 100 Females in Pinedale.
What is the Ratio of Females per 100 Males in Pinedale?
There are 110.61 Females per 100 Males in Pinedale.
What is the Median Population Age in Pinedale?
Median Population Age in Pinedale is 41.7 Years.
What is the Average Family Size in Pinedale
Average Family Size in Pinedale is 2.9 People.
What is the Average Household Size in Pinedale
Average Household Size in Pinedale is 2.3 People.
How Large is the Labor Force in Pinedale?
There are 965 People in the Labor Forcein in Pinedale.
What is the Percentage of People in the Labor Force in Pinedale?
65.9% of People are in the Labor Force in Pinedale.