Glendo, WY Map & Demographics
Glendo Map
Glendo Overview
$34,738
PER CAPITA INCOME
$155,331
AVG FAMILY INCOME
59.1%
WAGE / INCOME GAP [ % ]
40.9¢/ $1
WAGE / INCOME GAP [ $ ]
0.48
INEQUALITY / GINI INDEX
209
TOTAL POPULATION
108
MALE POPULATION
101
FEMALE POPULATION
106.93
MALES / 100 FEMALES
93.52
FEMALES / 100 MALES
61.4
MEDIAN AGE
2.3
AVG FAMILY SIZE
1.8
AVG HOUSEHOLD SIZE
95
LABOR FORCE [ PEOPLE ]
48.7%
PERCENT IN LABOR FORCE
4.2%
UNEMPLOYMENT RATE
Glendo Zip Codes
Glendo Area Codes
Income in Glendo
Income Overview in Glendo
| Characteristic | Number | Measure |
| Per Capita Income | 209 | $34,738 |
| Median Family Income | 59 | $155,331 |
| Mean Family Income | 59 | $111,527 |
| Median Household Income | 116 | $0 |
| Mean Household Income | 116 | $70,274 |
| Income Deficit | 59 | $0 |
| Wage / Income Gap (%) | 209 | 59.07% |
| Wage / Income Gap ($) | 209 | 40.93¢ per $1 |
| Gini / Inequality Index | 209 | 0.48 |
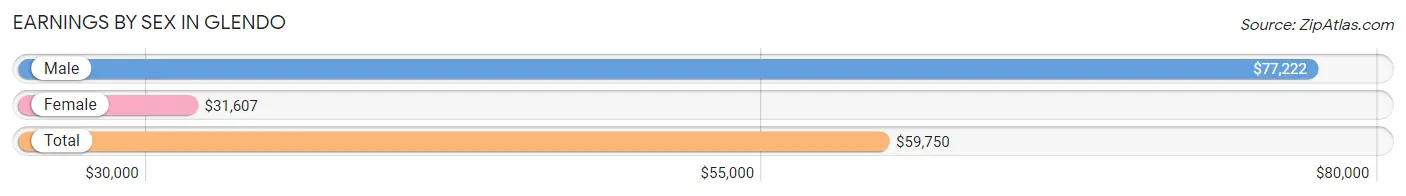
Earnings by Sex in Glendo
Average Earnings in Glendo are $59,750, $77,222 for men and $31,607 for women, a difference of 59.1%.
| Sex | Number | Average Earnings |
| Male | 70 (72.2%) | $77,222 |
| Female | 27 (27.8%) | $31,607 |
| Total | 97 (100.0%) | $59,750 |
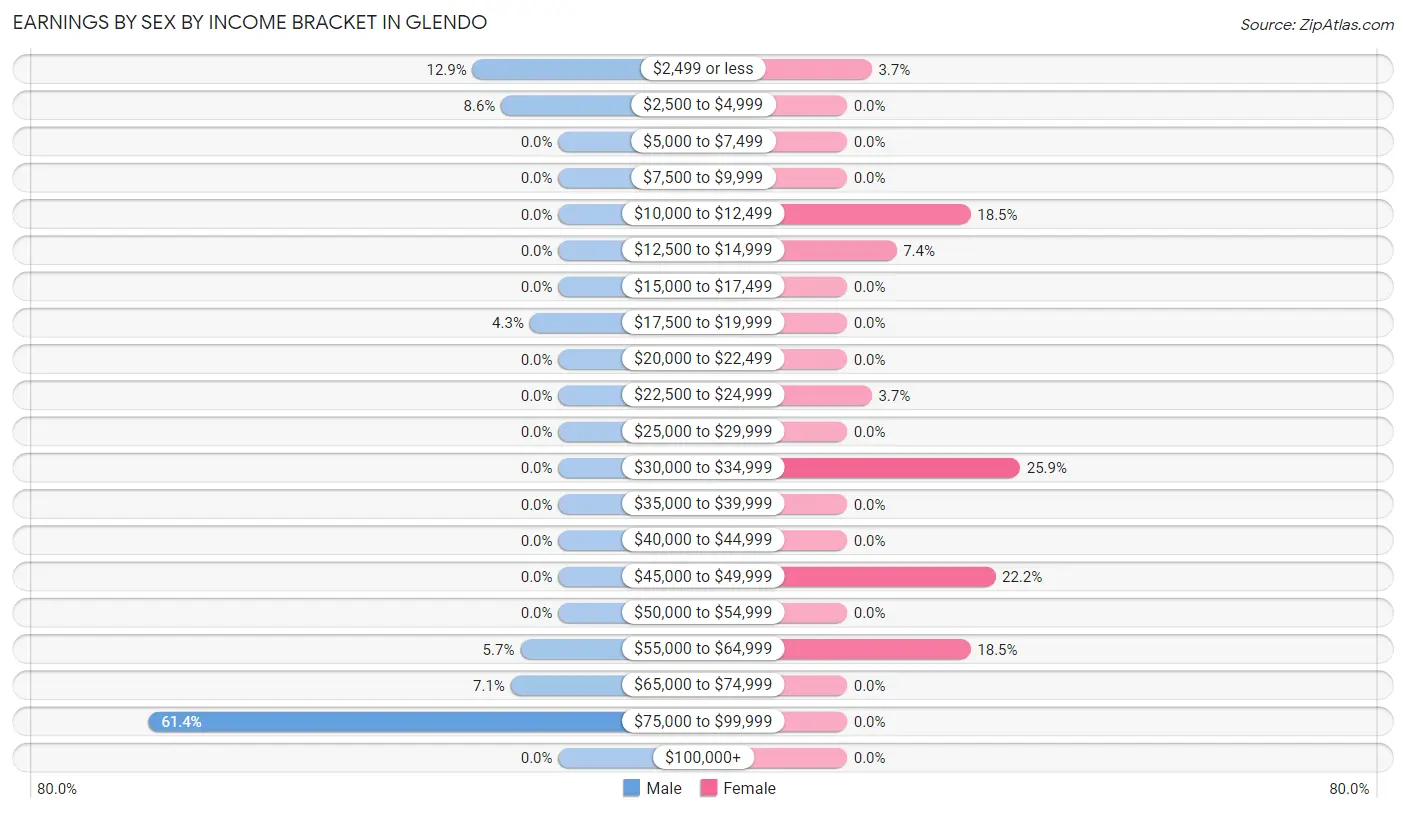
Earnings by Sex by Income Bracket in Glendo
The most common earnings brackets in Glendo are $75,000 to $99,999 for men (43 | 61.4%) and $30,000 to $34,999 for women (7 | 25.9%).
| Income | Male | Female |
| $2,499 or less | 9 (12.9%) | 1 (3.7%) |
| $2,500 to $4,999 | 6 (8.6%) | 0 (0.0%) |
| $5,000 to $7,499 | 0 (0.0%) | 0 (0.0%) |
| $7,500 to $9,999 | 0 (0.0%) | 0 (0.0%) |
| $10,000 to $12,499 | 0 (0.0%) | 5 (18.5%) |
| $12,500 to $14,999 | 0 (0.0%) | 2 (7.4%) |
| $15,000 to $17,499 | 0 (0.0%) | 0 (0.0%) |
| $17,500 to $19,999 | 3 (4.3%) | 0 (0.0%) |
| $20,000 to $22,499 | 0 (0.0%) | 0 (0.0%) |
| $22,500 to $24,999 | 0 (0.0%) | 1 (3.7%) |
| $25,000 to $29,999 | 0 (0.0%) | 0 (0.0%) |
| $30,000 to $34,999 | 0 (0.0%) | 7 (25.9%) |
| $35,000 to $39,999 | 0 (0.0%) | 0 (0.0%) |
| $40,000 to $44,999 | 0 (0.0%) | 0 (0.0%) |
| $45,000 to $49,999 | 0 (0.0%) | 6 (22.2%) |
| $50,000 to $54,999 | 0 (0.0%) | 0 (0.0%) |
| $55,000 to $64,999 | 4 (5.7%) | 5 (18.5%) |
| $65,000 to $74,999 | 5 (7.1%) | 0 (0.0%) |
| $75,000 to $99,999 | 43 (61.4%) | 0 (0.0%) |
| $100,000+ | 0 (0.0%) | 0 (0.0%) |
| Total | 70 (100.0%) | 27 (100.0%) |
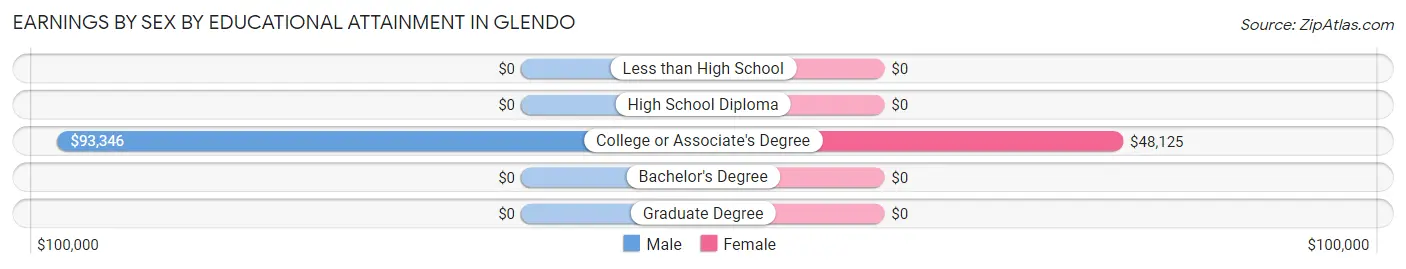
Earnings by Sex by Educational Attainment in Glendo
Average earnings in Glendo are $92,757 for men and $31,607 for women, a difference of 65.9%. Men with an educational attainment of college or associate's degree enjoy the highest average annual earnings of $93,346, while those with college or associate's degree education earn the least with $93,346. Women with an educational attainment of college or associate's degree earn the most with the average annual earnings of $48,125, while those with college or associate's degree education have the smallest earnings of $48,125.
| Educational Attainment | Male Income | Female Income |
| Less than High School | - | - |
| High School Diploma | - | - |
| College or Associate's Degree | $93,346 | $48,125 |
| Bachelor's Degree | - | - |
| Graduate Degree | - | - |
| Total | $92,757 | $31,607 |
Family Income in Glendo
Family Income Brackets in Glendo
According to the Glendo family income data, there are 34 families falling into the $150,000 to $199,999 income range, which is the most common income bracket and makes up 57.6% of all families.
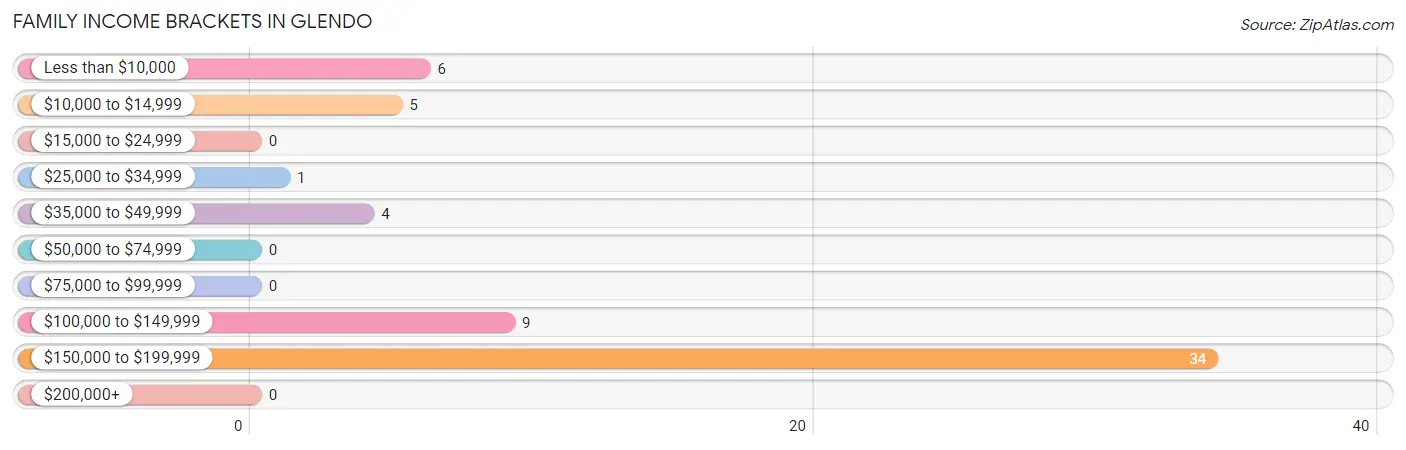
| Income Bracket | # Families | % Families |
| Less than $10,000 | 6 | 10.2% |
| $10,000 to $14,999 | 5 | 8.5% |
| $15,000 to $24,999 | 0 | 0.0% |
| $25,000 to $34,999 | 1 | 1.7% |
| $35,000 to $49,999 | 4 | 6.8% |
| $50,000 to $74,999 | 0 | 0.0% |
| $75,000 to $99,999 | 0 | 0.0% |
| $100,000 to $149,999 | 9 | 15.3% |
| $150,000 to $199,999 | 34 | 57.6% |
| $200,000+ | 0 | 0.0% |
Family Income by Famaliy Size in Glendo
2-person families (46 | 78.0%) account for the highest median family income in Glendo with $155,809 per family, while 2-person families (46 | 78.0%) have the highest median income of $77,904 per family member.
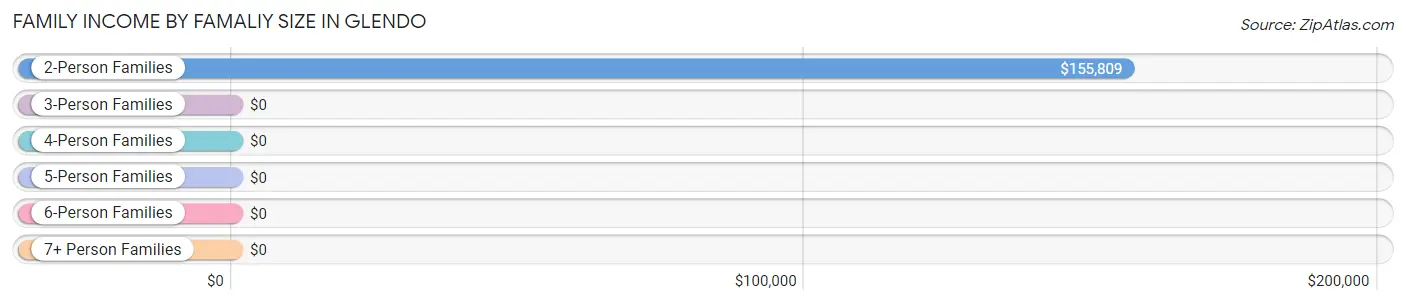
| Income Bracket | # Families | Median Income |
| 2-Person Families | 46 (78.0%) | $155,809 |
| 3-Person Families | 7 (11.9%) | $0 |
| 4-Person Families | 0 (0.0%) | $0 |
| 5-Person Families | 6 (10.2%) | $0 |
| 6-Person Families | 0 (0.0%) | $0 |
| 7+ Person Families | 0 (0.0%) | $0 |
| Total | 59 (100.0%) | $155,331 |
Family Income by Number of Earners in Glendo
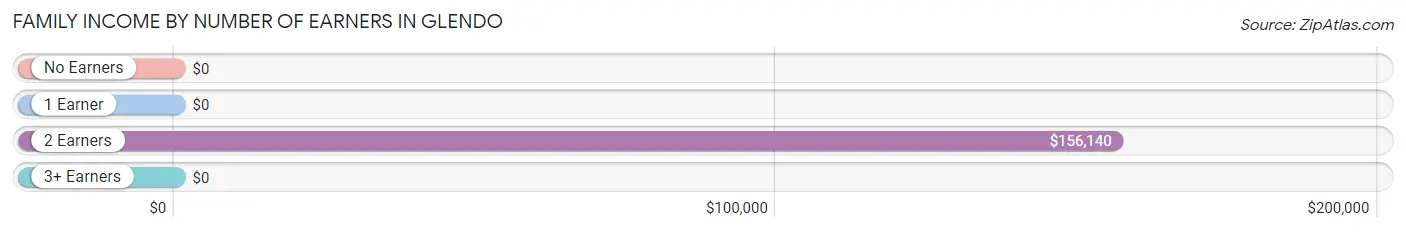
| Number of Earners | # Families | Median Income |
| No Earners | 10 (17.0%) | $0 |
| 1 Earner | 6 (10.2%) | $0 |
| 2 Earners | 37 (62.7%) | $156,140 |
| 3+ Earners | 6 (10.2%) | $0 |
| Total | 59 (100.0%) | $155,331 |
Household Income in Glendo
Household Income Brackets in Glendo
With 34 households falling in the category, the $150,000 to $199,999 income range is the most frequent in Glendo, accounting for 29.3% of all households.
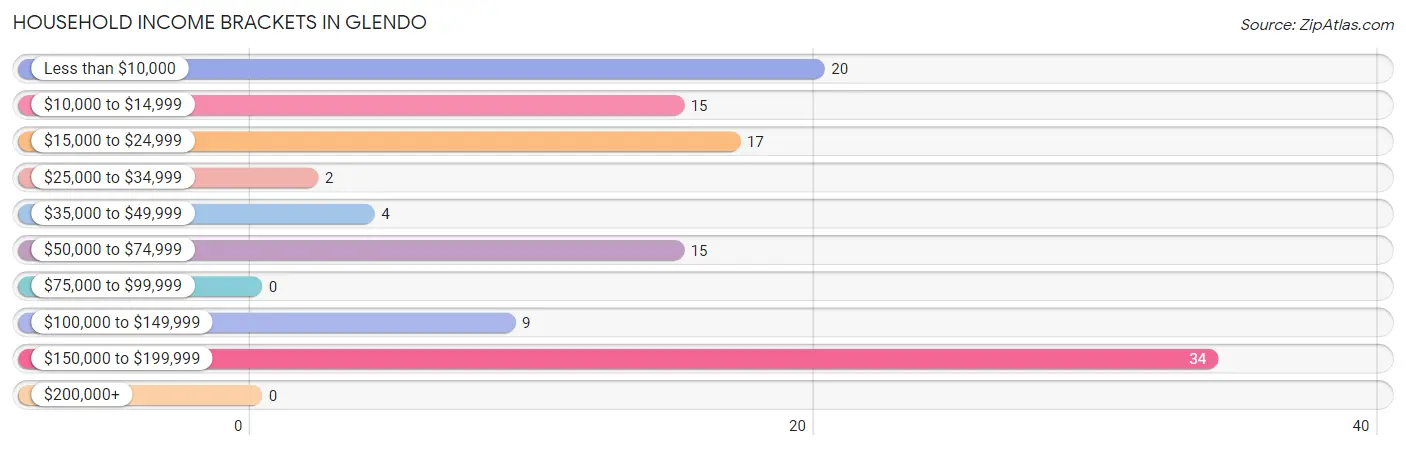
| Income Bracket | # Households | % Households |
| Less than $10,000 | 20 | 17.2% |
| $10,000 to $14,999 | 15 | 12.9% |
| $15,000 to $24,999 | 17 | 14.7% |
| $25,000 to $34,999 | 2 | 1.7% |
| $35,000 to $49,999 | 4 | 3.4% |
| $50,000 to $74,999 | 15 | 12.9% |
| $75,000 to $99,999 | 0 | 0.0% |
| $100,000 to $149,999 | 9 | 7.8% |
| $150,000 to $199,999 | 34 | 29.3% |
| $200,000+ | 0 | 0.0% |
Household Income by Householder Age in Glendo
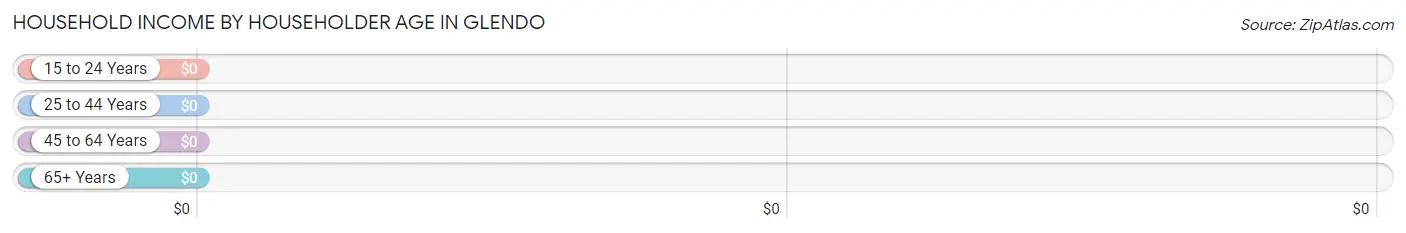
| Income Bracket | # Households | Median Income |
| 15 to 24 Years | 0 (0.0%) | $0 |
| 25 to 44 Years | 11 (9.5%) | $0 |
| 45 to 64 Years | 29 (25.0%) | $0 |
| 65+ Years | 76 (65.5%) | $0 |
| Total | 116 (100.0%) | $0 |
Poverty in Glendo
Income Below Poverty by Sex and Age in Glendo
With 12.0% poverty level for males and 48.5% for females among the residents of Glendo, 75 year old and over males and 65 to 74 year old females are the most vulnerable to poverty, with 5 males (41.7%) and 7 females (63.6%) in their respective age groups living below the poverty level.
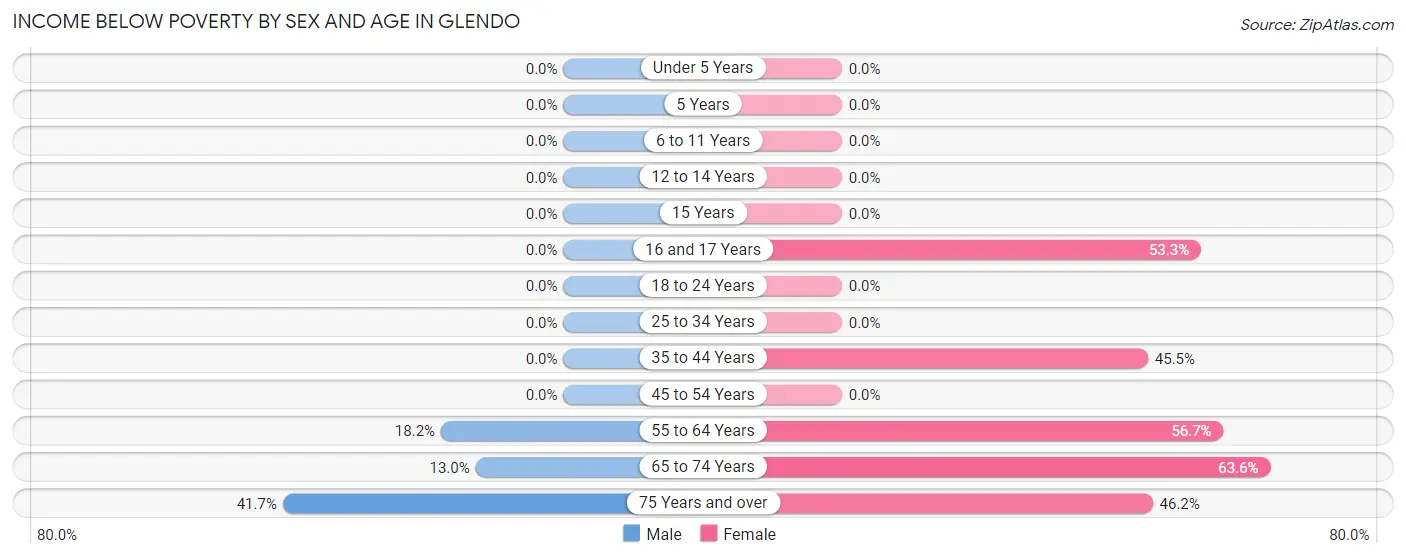
| Age Bracket | Male | Female |
| Under 5 Years | 0 (0.0%) | 0 (0.0%) |
| 5 Years | 0 (0.0%) | 0 (0.0%) |
| 6 to 11 Years | 0 (0.0%) | 0 (0.0%) |
| 12 to 14 Years | 0 (0.0%) | 0 (0.0%) |
| 15 Years | 0 (0.0%) | 0 (0.0%) |
| 16 and 17 Years | 0 (0.0%) | 8 (53.3%) |
| 18 to 24 Years | 0 (0.0%) | 0 (0.0%) |
| 25 to 34 Years | 0 (0.0%) | 0 (0.0%) |
| 35 to 44 Years | 0 (0.0%) | 5 (45.5%) |
| 45 to 54 Years | 0 (0.0%) | 0 (0.0%) |
| 55 to 64 Years | 2 (18.2%) | 17 (56.7%) |
| 65 to 74 Years | 6 (13.0%) | 7 (63.6%) |
| 75 Years and over | 5 (41.7%) | 12 (46.2%) |
| Total | 13 (12.0%) | 49 (48.5%) |
Income Above Poverty by Sex and Age in Glendo
According to the poverty statistics in Glendo, males aged 6 to 11 years and females aged 15 years are the age groups that are most secure financially, with 100.0% of males and 100.0% of females in these age groups living above the poverty line.
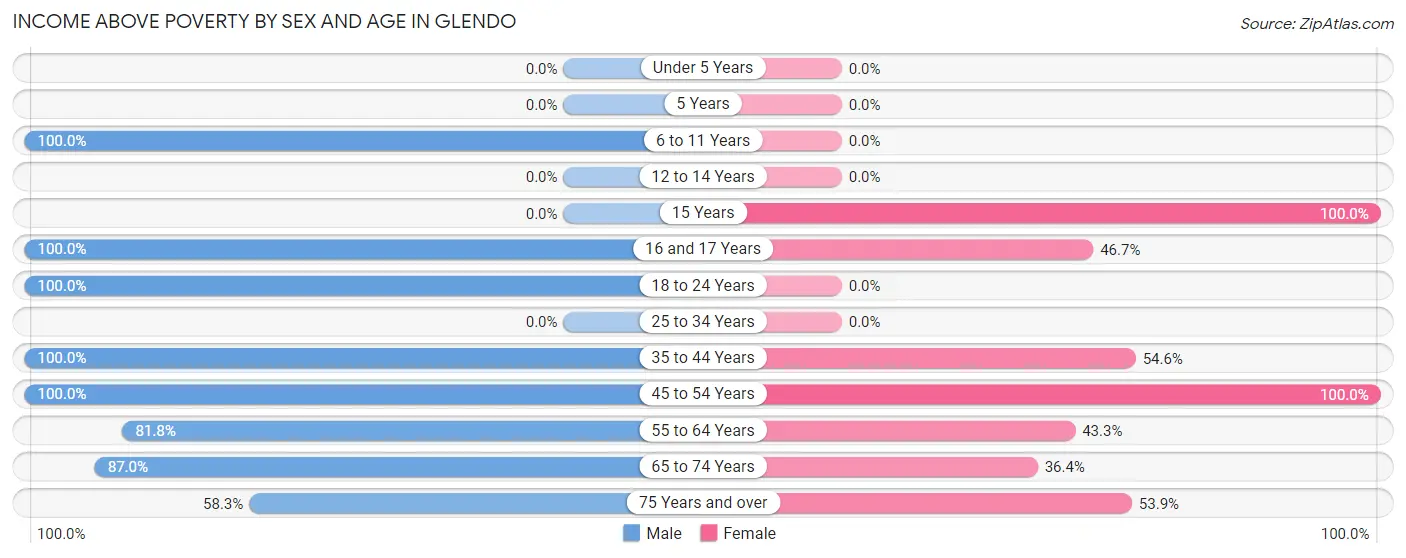
| Age Bracket | Male | Female |
| Under 5 Years | 0 (0.0%) | 0 (0.0%) |
| 5 Years | 0 (0.0%) | 0 (0.0%) |
| 6 to 11 Years | 9 (100.0%) | 0 (0.0%) |
| 12 to 14 Years | 0 (0.0%) | 0 (0.0%) |
| 15 Years | 0 (0.0%) | 5 (100.0%) |
| 16 and 17 Years | 9 (100.0%) | 7 (46.7%) |
| 18 to 24 Years | 5 (100.0%) | 0 (0.0%) |
| 25 to 34 Years | 0 (0.0%) | 0 (0.0%) |
| 35 to 44 Years | 9 (100.0%) | 6 (54.5%) |
| 45 to 54 Years | 7 (100.0%) | 3 (100.0%) |
| 55 to 64 Years | 9 (81.8%) | 13 (43.3%) |
| 65 to 74 Years | 40 (87.0%) | 4 (36.4%) |
| 75 Years and over | 7 (58.3%) | 14 (53.8%) |
| Total | 95 (88.0%) | 52 (51.5%) |
Income Below Poverty Among Married-Couple Families in Glendo
The poverty statistics for married-couple families in Glendo show that 12.2% or 6 of the total 49 families live below the poverty line. Families with no children have the highest poverty rate of 14.0%, comprising of 6 families. On the other hand, families with 3 or 4 children have the lowest poverty rate of 0.0%, which includes 0 families.
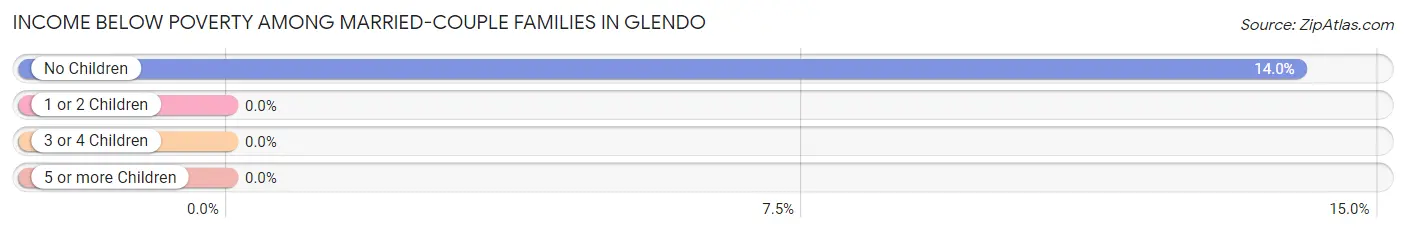
| Children | Above Poverty | Below Poverty |
| No Children | 37 (86.1%) | 6 (14.0%) |
| 1 or 2 Children | 0 (0.0%) | 0 (0.0%) |
| 3 or 4 Children | 6 (100.0%) | 0 (0.0%) |
| 5 or more Children | 0 (0.0%) | 0 (0.0%) |
| Total | 43 (87.8%) | 6 (12.2%) |
Income Below Poverty Among Single-Parent Households in Glendo
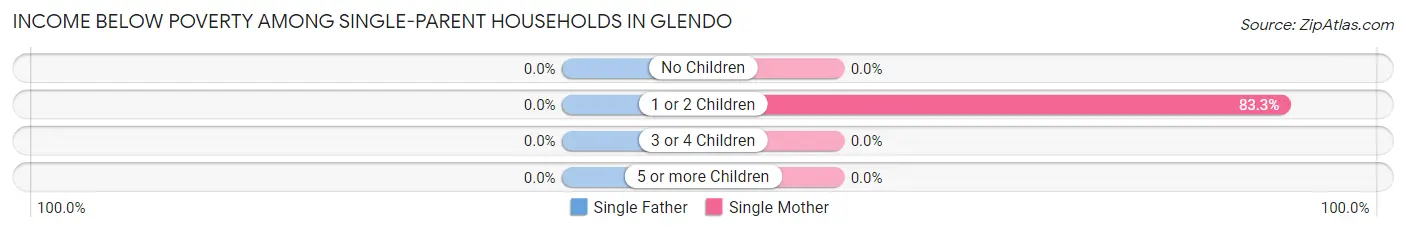
| Children | Single Father | Single Mother |
| No Children | 0 (0.0%) | 0 (0.0%) |
| 1 or 2 Children | 0 (0.0%) | 5 (83.3%) |
| 3 or 4 Children | 0 (0.0%) | 0 (0.0%) |
| 5 or more Children | 0 (0.0%) | 0 (0.0%) |
| Total | 0 (0.0%) | 5 (50.0%) |
Income Below Poverty Among Married-Couple vs Single-Parent Households in Glendo
The poverty data for Glendo shows that 6 of the married-couple family households (12.2%) and 5 of the single-parent households (50.0%) are living below the poverty level. Within the married-couple family households, those with no children have the highest poverty rate, with 6 households (14.0%) falling below the poverty line. Among the single-parent households, those with 1 or 2 children have the highest poverty rate, with 5 household (83.3%) living below poverty.
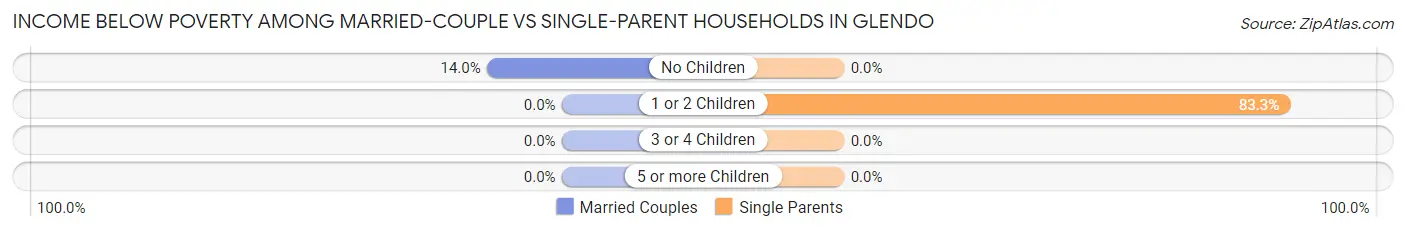
| Children | Married-Couple Families | Single-Parent Households |
| No Children | 6 (14.0%) | 0 (0.0%) |
| 1 or 2 Children | 0 (0.0%) | 5 (83.3%) |
| 3 or 4 Children | 0 (0.0%) | 0 (0.0%) |
| 5 or more Children | 0 (0.0%) | 0 (0.0%) |
| Total | 6 (12.2%) | 5 (50.0%) |
Race in Glendo
The most populous races in Glendo are White / Caucasian (201 | 96.2%), Two or more Races (8 | 3.8%), and Hispanic or Latino (4 | 1.9%).
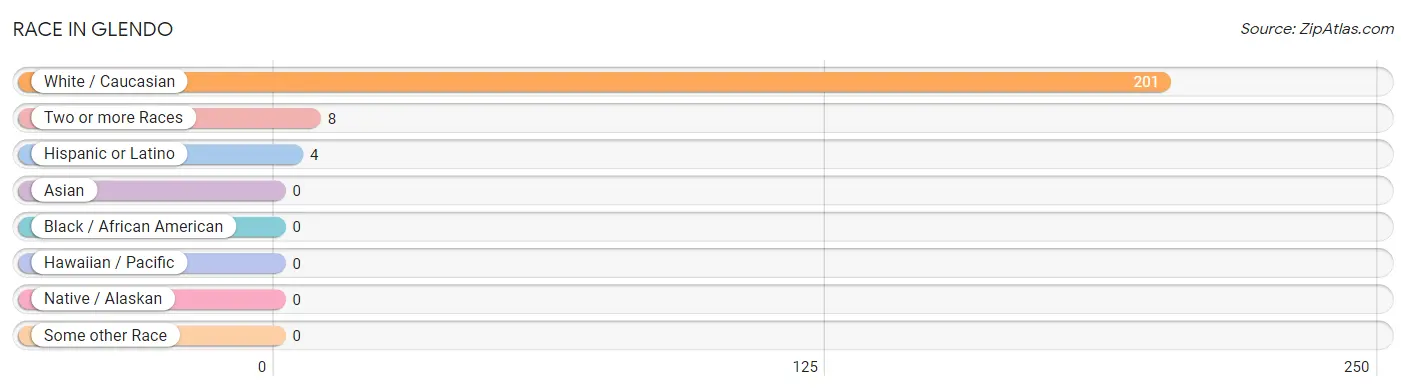
| Race | # Population | % Population |
| Asian | 0 | 0.0% |
| Black / African American | 0 | 0.0% |
| Hawaiian / Pacific | 0 | 0.0% |
| Hispanic or Latino | 4 | 1.9% |
| Native / Alaskan | 0 | 0.0% |
| White / Caucasian | 201 | 96.2% |
| Two or more Races | 8 | 3.8% |
| Some other Race | 0 | 0.0% |
| Total | 209 | 100.0% |
Ancestry in Glendo
The most populous ancestries reported in Glendo are Irish (54 | 25.8%), German (41 | 19.6%), European (34 | 16.3%), French (20 | 9.6%), and English (17 | 8.1%), together accounting for 79.4% of all Glendo residents.
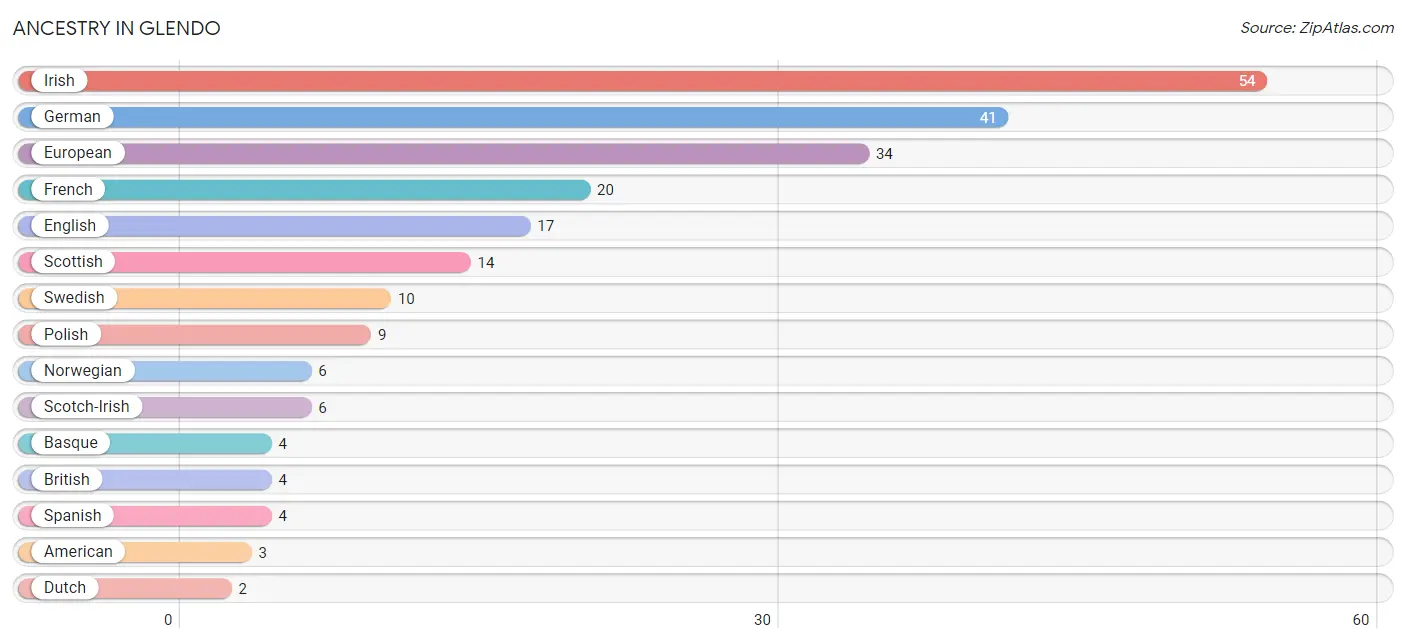
| Ancestry | # Population | % Population |
| American | 3 | 1.4% |
| Basque | 4 | 1.9% |
| British | 4 | 1.9% |
| Dutch | 2 | 1.0% |
| English | 17 | 8.1% |
| European | 34 | 16.3% |
| French | 20 | 9.6% |
| German | 41 | 19.6% |
| Irish | 54 | 25.8% |
| Norwegian | 6 | 2.9% |
| Polish | 9 | 4.3% |
| Scotch-Irish | 6 | 2.9% |
| Scottish | 14 | 6.7% |
| Spanish | 4 | 1.9% |
| Swedish | 10 | 4.8% | View All 15 Rows |
Immigrants in Glendo

| Immigration Origin | # Population | % Population | View All 0 Rows |
Sex and Age in Glendo
Sex and Age in Glendo
The most populous age groups in Glendo are 65 to 69 Years (40 | 37.0%) for men and 15 to 19 Years (20 | 19.8%) for women.
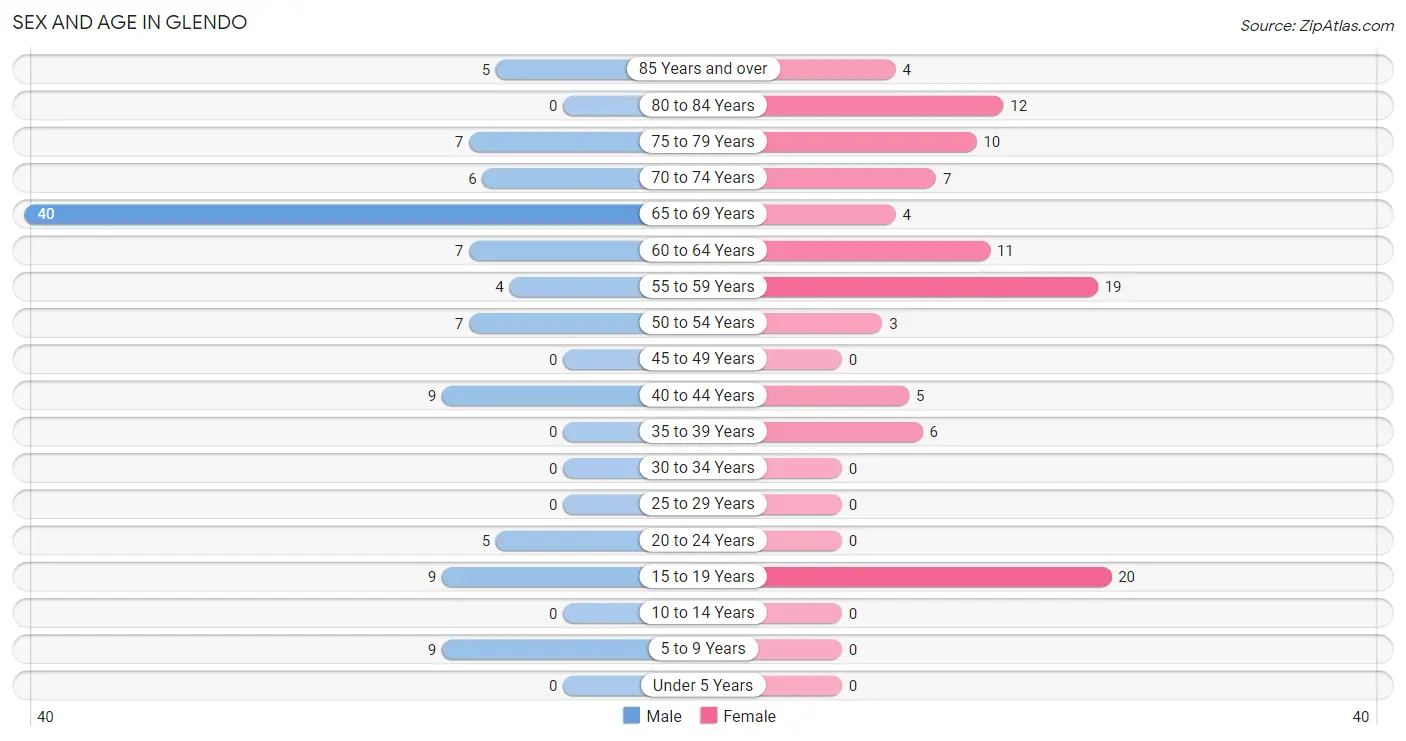
| Age Bracket | Male | Female |
| Under 5 Years | 0 (0.0%) | 0 (0.0%) |
| 5 to 9 Years | 9 (8.3%) | 0 (0.0%) |
| 10 to 14 Years | 0 (0.0%) | 0 (0.0%) |
| 15 to 19 Years | 9 (8.3%) | 20 (19.8%) |
| 20 to 24 Years | 5 (4.6%) | 0 (0.0%) |
| 25 to 29 Years | 0 (0.0%) | 0 (0.0%) |
| 30 to 34 Years | 0 (0.0%) | 0 (0.0%) |
| 35 to 39 Years | 0 (0.0%) | 6 (5.9%) |
| 40 to 44 Years | 9 (8.3%) | 5 (5.0%) |
| 45 to 49 Years | 0 (0.0%) | 0 (0.0%) |
| 50 to 54 Years | 7 (6.5%) | 3 (3.0%) |
| 55 to 59 Years | 4 (3.7%) | 19 (18.8%) |
| 60 to 64 Years | 7 (6.5%) | 11 (10.9%) |
| 65 to 69 Years | 40 (37.0%) | 4 (4.0%) |
| 70 to 74 Years | 6 (5.6%) | 7 (6.9%) |
| 75 to 79 Years | 7 (6.5%) | 10 (9.9%) |
| 80 to 84 Years | 0 (0.0%) | 12 (11.9%) |
| 85 Years and over | 5 (4.6%) | 4 (4.0%) |
| Total | 108 (100.0%) | 101 (100.0%) |
Families and Households in Glendo
Median Family Size in Glendo
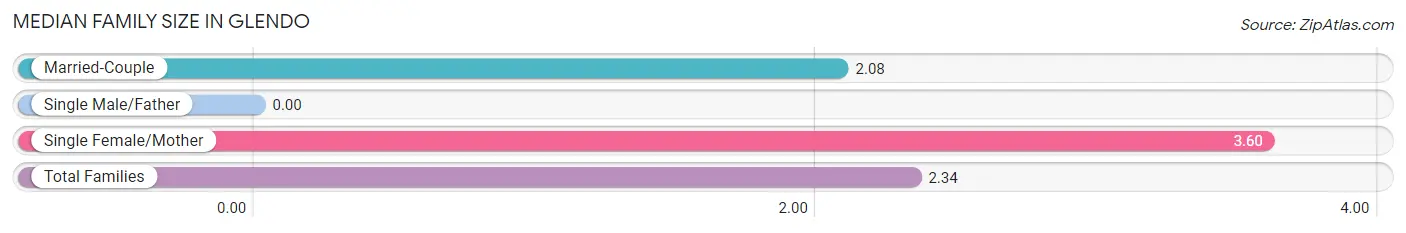
| Family Type | # Families | Family Size |
| Married-Couple | 49 (83.1%) | 2.08 |
| Single Male/Father | 0 (0.0%) | - |
| Single Female/Mother | 10 (17.0%) | 3.60 |
| Total Families | 59 (100.0%) | 2.34 |
Median Household Size in Glendo
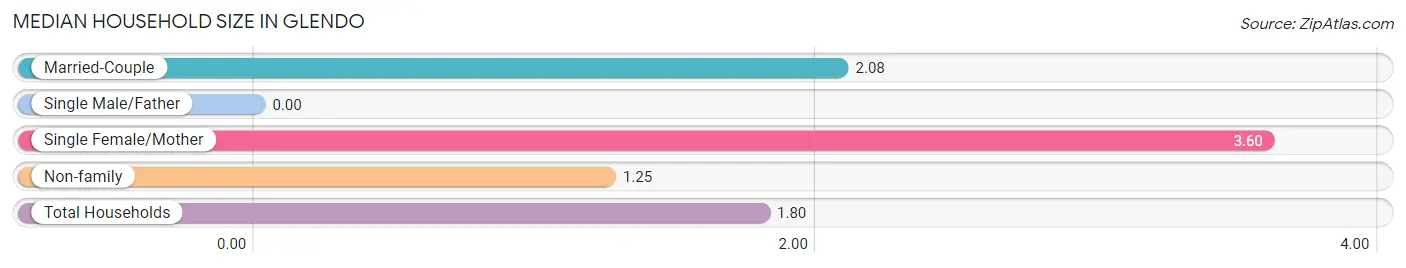
| Household Type | # Households | Household Size |
| Married-Couple | 49 (42.2%) | 2.08 |
| Single Male/Father | 0 (0.0%) | - |
| Single Female/Mother | 10 (8.6%) | 3.60 |
| Non-family | 57 (49.1%) | 1.25 |
| Total Households | 116 (100.0%) | 1.80 |
Household Size by Marriage Status in Glendo
Out of a total of 116 households in Glendo, 59 (50.9%) are family households, while 57 (49.1%) are nonfamily households. The most numerous type of family households are 2-person households, comprising 46, and the most common type of nonfamily households are 1-person households, comprising 47.
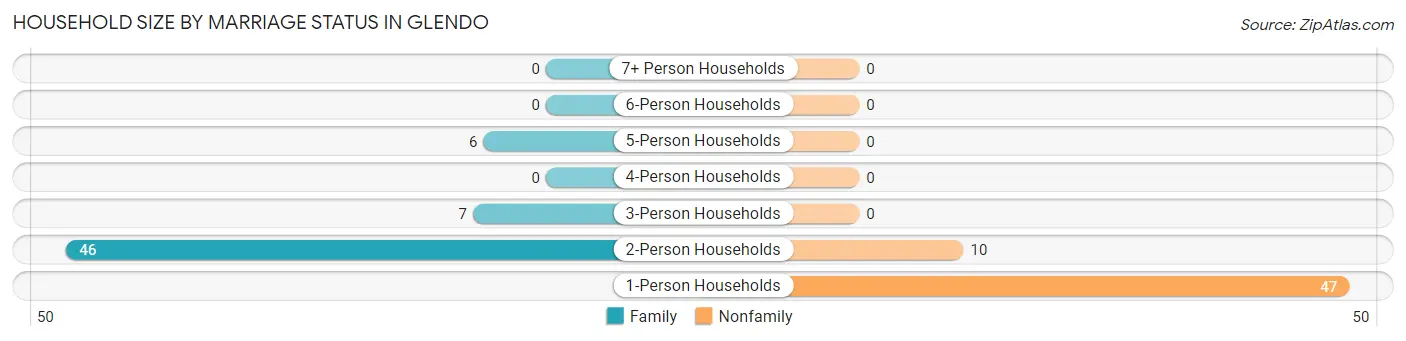
| Household Size | Family Households | Nonfamily Households |
| 1-Person Households | - | 47 (40.5%) |
| 2-Person Households | 46 (39.7%) | 10 (8.6%) |
| 3-Person Households | 7 (6.0%) | 0 (0.0%) |
| 4-Person Households | 0 (0.0%) | 0 (0.0%) |
| 5-Person Households | 6 (5.2%) | 0 (0.0%) |
| 6-Person Households | 0 (0.0%) | 0 (0.0%) |
| 7+ Person Households | 0 (0.0%) | 0 (0.0%) |
| Total | 59 (50.9%) | 57 (49.1%) |
Female Fertility in Glendo
Fertility by Age in Glendo
| Age Bracket | Women with Births | Births / 1,000 Women |
| 15 to 19 years | 0 (0.0%) | 0.0 |
| 20 to 34 years | 0 (0.0%) | 0.0 |
| 35 to 50 years | 0 (0.0%) | 0.0 |
| Total | 0 (0.0%) | 0.0 |
Fertility by Age by Marriage Status in Glendo
| Age Bracket | Married | Unmarried |
| 15 to 19 years | 0 (0.0%) | 0 (0.0%) |
| 20 to 34 years | 0 (0.0%) | 0 (0.0%) |
| 35 to 50 years | 0 (0.0%) | 0 (0.0%) |
| Total | 0 (0.0%) | 0 (0.0%) |
Fertility by Education in Glendo
| Educational Attainment | Women with Births | Births / 1,000 Women |
| Less than High School | 0 (0.0%) | 0.0 |
| High School Diploma | 0 (0.0%) | 0.0 |
| College or Associate's Degree | 0 (0.0%) | 0.0 |
| Bachelor's Degree | 0 (0.0%) | 0.0 |
| Graduate Degree | 0 (0.0%) | 0.0 |
| Total | 0 (0.0%) | 0.0 |
Fertility by Education by Marriage Status in Glendo
| Educational Attainment | Married | Unmarried |
| Less than High School | 0 (0.0%) | 0 (0.0%) |
| High School Diploma | 0 (0.0%) | 0 (0.0%) |
| College or Associate's Degree | 0 (0.0%) | 0 (0.0%) |
| Bachelor's Degree | 0 (0.0%) | 0 (0.0%) |
| Graduate Degree | 0 (0.0%) | 0 (0.0%) |
| Total | 0 (0.0%) | 0 (0.0%) |
Employment Characteristics in Glendo
Employment by Class of Employer in Glendo
Among the 91 employed individuals in Glendo, private company employees (43 | 47.2%), unpaid family workers (34 | 37.4%), and self-employed (incorporated) (6 | 6.6%) make up the most common classes of employment.
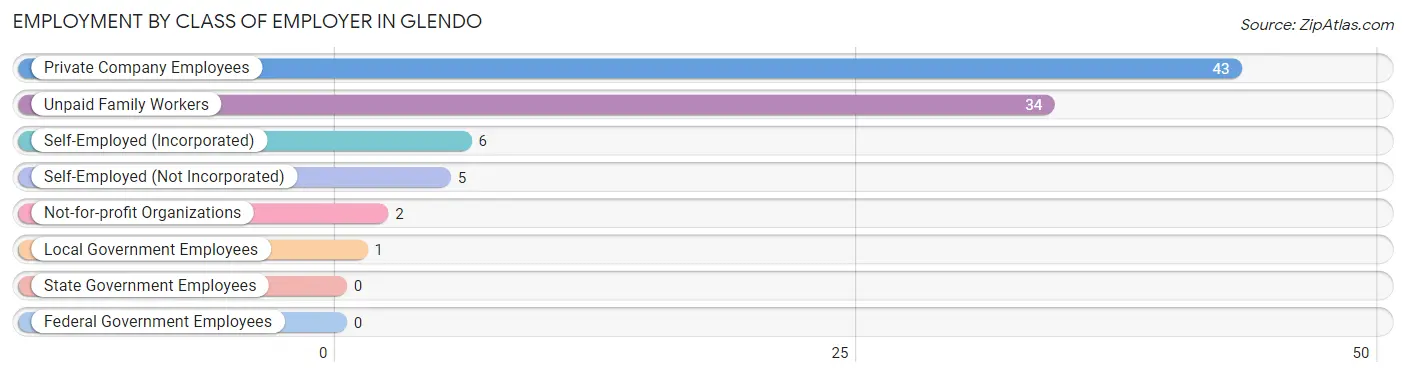
| Employer Class | # Employees | % Employees |
| Private Company Employees | 43 | 47.2% |
| Self-Employed (Incorporated) | 6 | 6.6% |
| Self-Employed (Not Incorporated) | 5 | 5.5% |
| Not-for-profit Organizations | 2 | 2.2% |
| Local Government Employees | 1 | 1.1% |
| State Government Employees | 0 | 0.0% |
| Federal Government Employees | 0 | 0.0% |
| Unpaid Family Workers | 34 | 37.4% |
| Total | 91 | 100.0% |
Employment Status by Age in Glendo
According to the labor force statistics for Glendo, out of the total population over 16 years of age (195), 48.7% or 95 individuals are in the labor force, with 4.2% or 4 of them unemployed. The age group with the highest labor force participation rate is 35 to 44 years, with 100.0% or 20 individuals in the labor force. Within the labor force, the 45 to 54 years age range has the highest percentage of unemployed individuals, with 40.0% or 4 of them being unemployed.
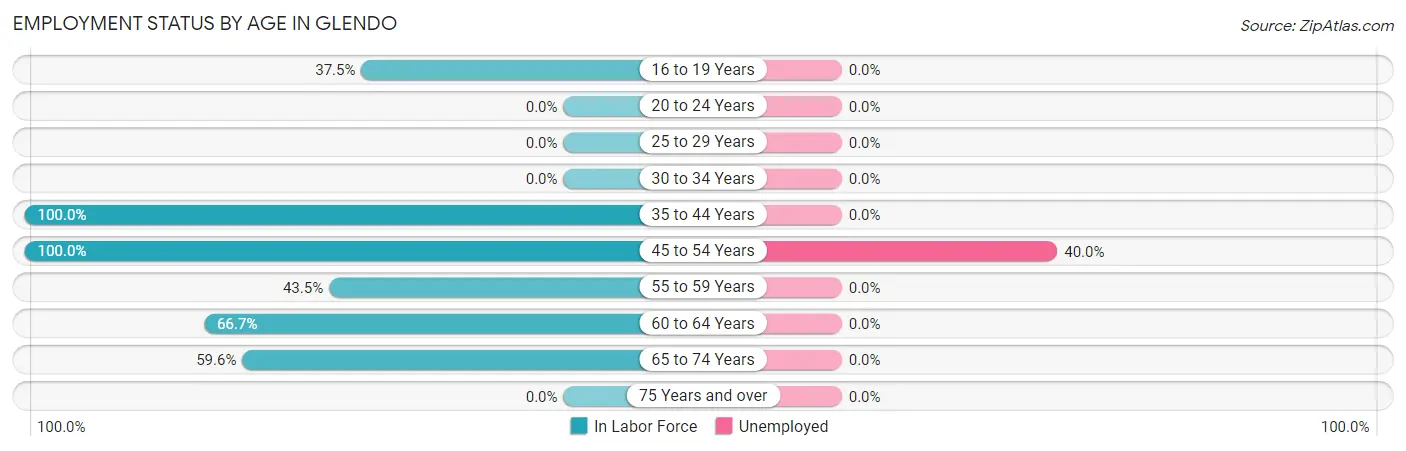
| Age Bracket | In Labor Force | Unemployed |
| 16 to 19 Years | 9 (37.5%) | 0 (0.0%) |
| 20 to 24 Years | 0 (0.0%) | 0 (0.0%) |
| 25 to 29 Years | 0 (0.0%) | 0 (0.0%) |
| 30 to 34 Years | 0 (0.0%) | 0 (0.0%) |
| 35 to 44 Years | 20 (100.0%) | 0 (0.0%) |
| 45 to 54 Years | 10 (100.0%) | 4 (40.0%) |
| 55 to 59 Years | 10 (43.5%) | 0 (0.0%) |
| 60 to 64 Years | 12 (66.7%) | 0 (0.0%) |
| 65 to 74 Years | 34 (59.6%) | 0 (0.0%) |
| 75 Years and over | 0 (0.0%) | 0 (0.0%) |
| Total | 95 (48.7%) | 4 (4.2%) |
Employment Status by Educational Attainment in Glendo
According to labor force statistics for Glendo, 73.2% of individuals (52) out of the total population between 25 and 64 years of age (71) are in the labor force, with 7.7% or 4 of them being unemployed. The group with the highest labor force participation rate are those with the educational attainment of bachelor's degree or higher, with 100.0% or 12 individuals in the labor force. Within the labor force, individuals with college / associate degree education have the highest percentage of unemployment, with 14.3% or 4 of them being unemployed.
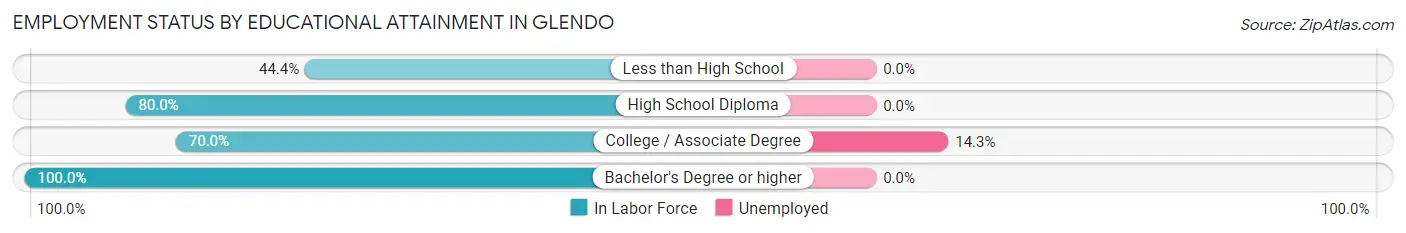
| Educational Attainment | In Labor Force | Unemployed |
| Less than High School | 4 (44.4%) | 0 (0.0%) |
| High School Diploma | 8 (80.0%) | 0 (0.0%) |
| College / Associate Degree | 28 (70.0%) | 6 (14.3%) |
| Bachelor's Degree or higher | 12 (100.0%) | 0 (0.0%) |
| Total | 52 (73.2%) | 5 (7.7%) |
Employment Occupations by Sex in Glendo
Management, Business, Science and Arts Occupations
The most common Management, Business, Science and Arts occupations in Glendo are Health Diagnosing & Treating (6 | 6.6%), Business & Financial (5 | 5.5%), and Management (1 | 1.1%).
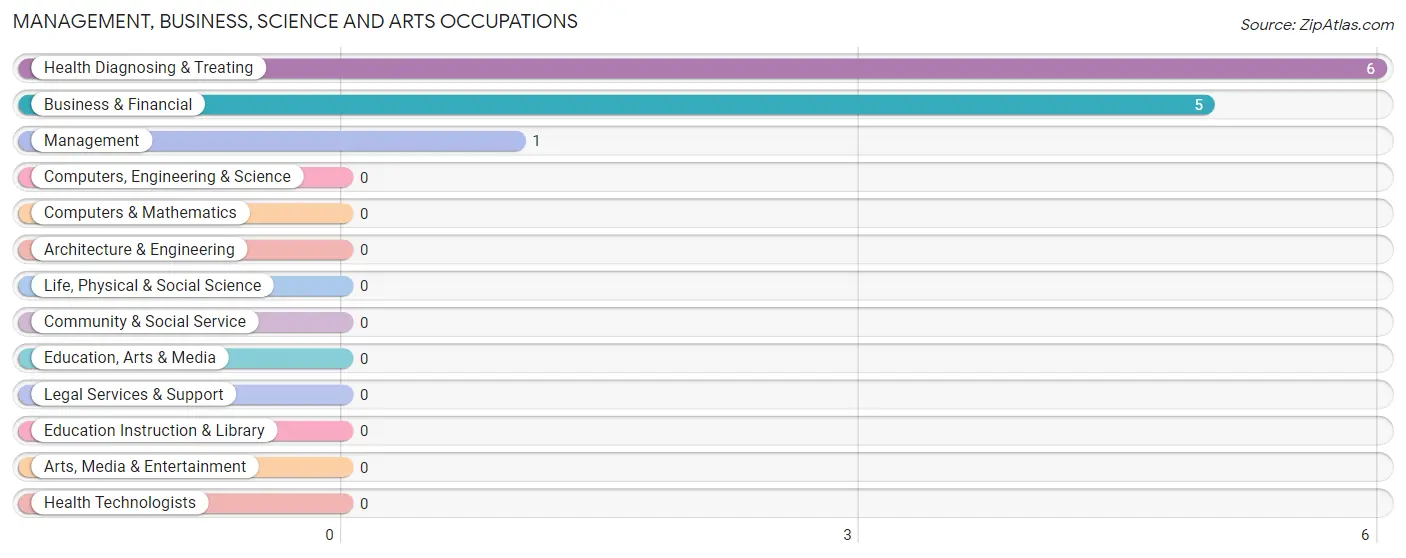
Management, Business, Science and Arts Occupations by Sex
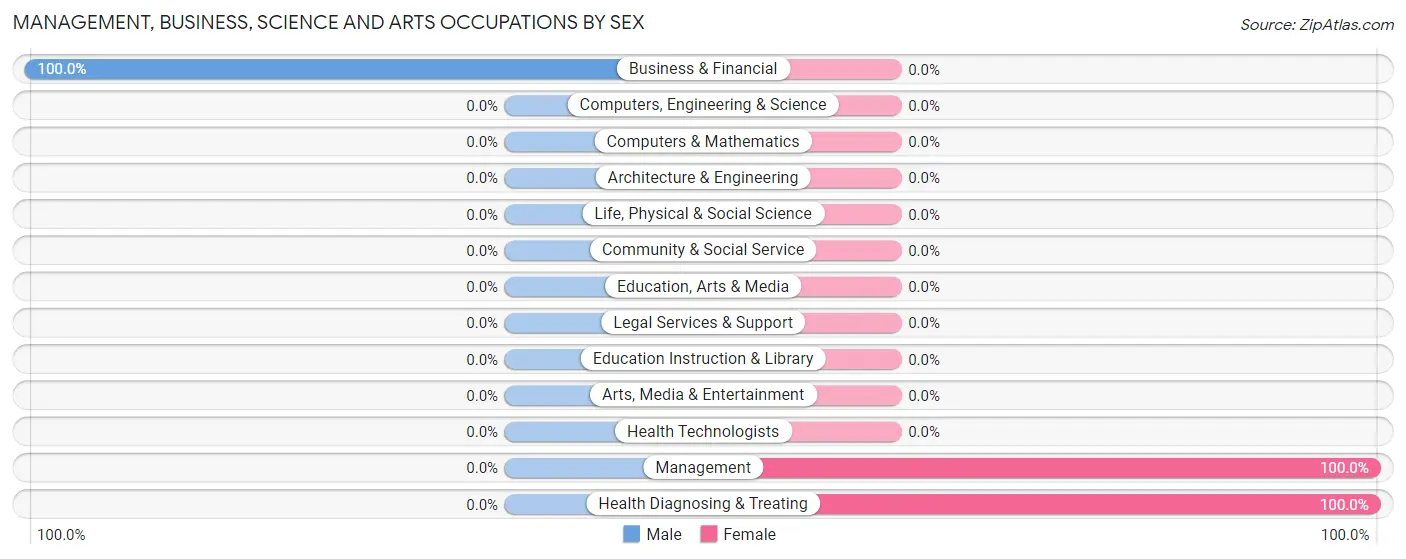
| Occupation | Male | Female |
| Management | 0 (0.0%) | 1 (100.0%) |
| Business & Financial | 5 (100.0%) | 0 (0.0%) |
| Computers, Engineering & Science | 0 (0.0%) | 0 (0.0%) |
| Computers & Mathematics | 0 (0.0%) | 0 (0.0%) |
| Architecture & Engineering | 0 (0.0%) | 0 (0.0%) |
| Life, Physical & Social Science | 0 (0.0%) | 0 (0.0%) |
| Community & Social Service | 0 (0.0%) | 0 (0.0%) |
| Education, Arts & Media | 0 (0.0%) | 0 (0.0%) |
| Legal Services & Support | 0 (0.0%) | 0 (0.0%) |
| Education Instruction & Library | 0 (0.0%) | 0 (0.0%) |
| Arts, Media & Entertainment | 0 (0.0%) | 0 (0.0%) |
| Health Diagnosing & Treating | 0 (0.0%) | 6 (100.0%) |
| Health Technologists | 0 (0.0%) | 0 (0.0%) |
| Total (Category) | 5 (41.7%) | 7 (58.3%) |
| Total (Overall) | 64 (70.3%) | 27 (29.7%) |
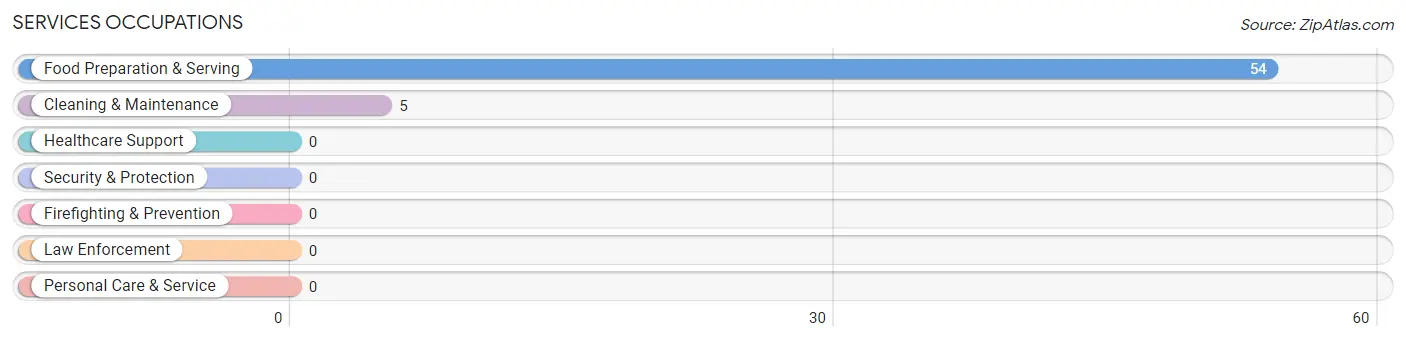
Services Occupations
The most common Services occupations in Glendo are Food Preparation & Serving (54 | 59.3%), and Cleaning & Maintenance (5 | 5.5%).
Services Occupations by Sex
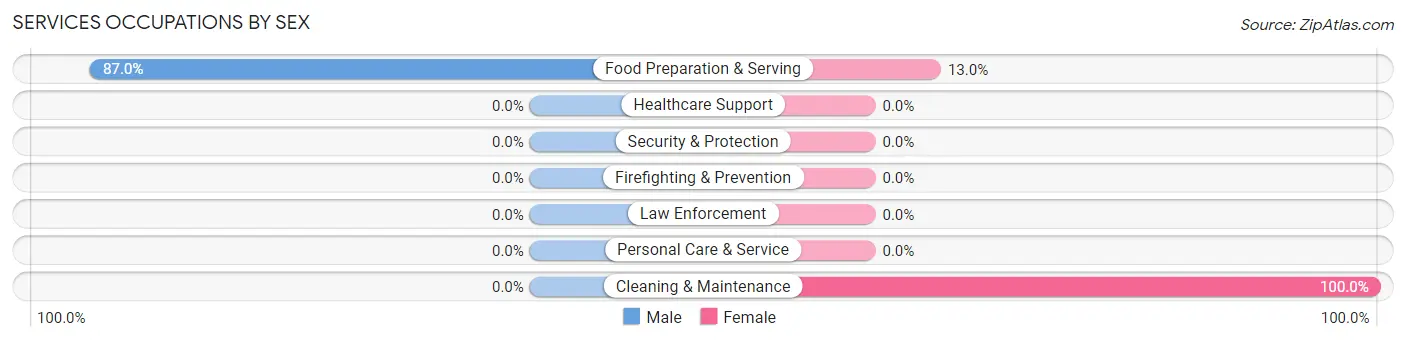
| Occupation | Male | Female |
| Healthcare Support | 0 (0.0%) | 0 (0.0%) |
| Security & Protection | 0 (0.0%) | 0 (0.0%) |
| Firefighting & Prevention | 0 (0.0%) | 0 (0.0%) |
| Law Enforcement | 0 (0.0%) | 0 (0.0%) |
| Food Preparation & Serving | 47 (87.0%) | 7 (13.0%) |
| Cleaning & Maintenance | 0 (0.0%) | 5 (100.0%) |
| Personal Care & Service | 0 (0.0%) | 0 (0.0%) |
| Total (Category) | 47 (79.7%) | 12 (20.3%) |
| Total (Overall) | 64 (70.3%) | 27 (29.7%) |
Sales and Office Occupations
The most common Sales and Office occupations in Glendo are , and Office & Administration (8 | 8.8%).
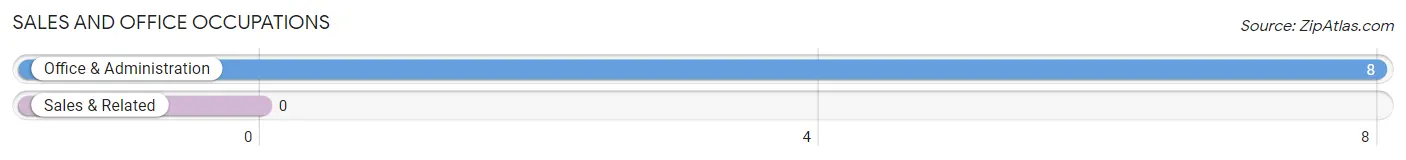
Sales and Office Occupations by Sex
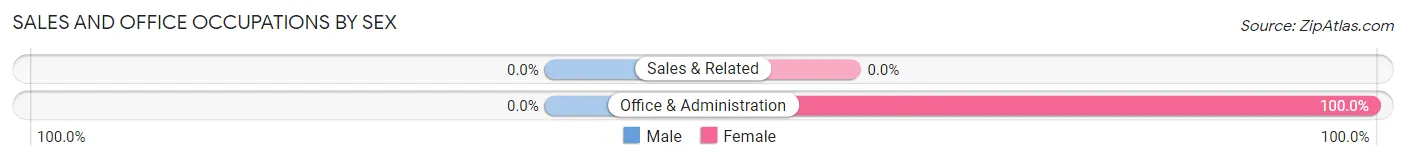
| Occupation | Male | Female |
| Sales & Related | 0 (0.0%) | 0 (0.0%) |
| Office & Administration | 0 (0.0%) | 8 (100.0%) |
| Total (Category) | 0 (0.0%) | 8 (100.0%) |
| Total (Overall) | 64 (70.3%) | 27 (29.7%) |
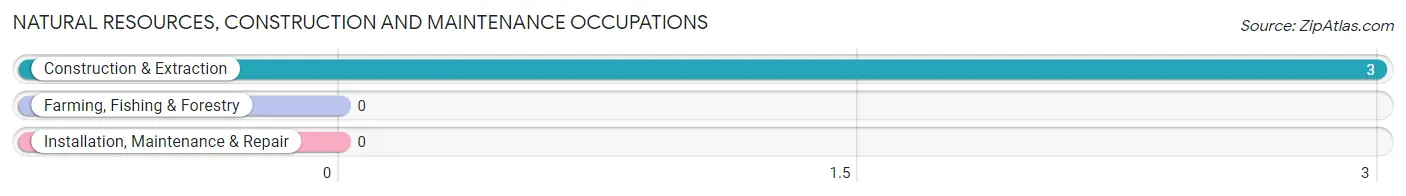
Natural Resources, Construction and Maintenance Occupations
The most common Natural Resources, Construction and Maintenance occupations in Glendo are , and Construction & Extraction (3 | 3.3%).
Natural Resources, Construction and Maintenance Occupations by Sex
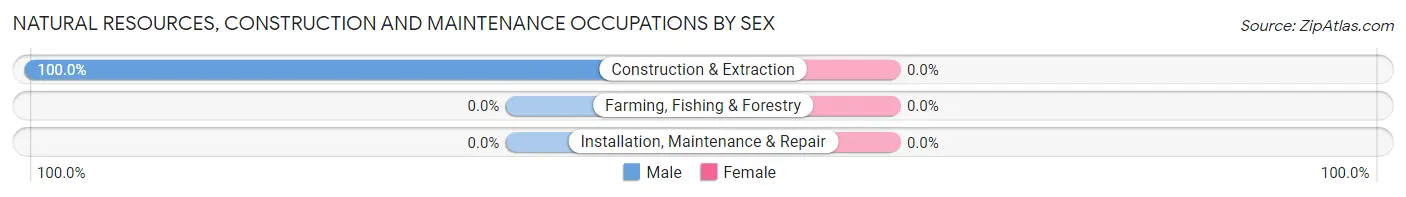
| Occupation | Male | Female |
| Farming, Fishing & Forestry | 0 (0.0%) | 0 (0.0%) |
| Construction & Extraction | 3 (100.0%) | 0 (0.0%) |
| Installation, Maintenance & Repair | 0 (0.0%) | 0 (0.0%) |
| Total (Category) | 3 (100.0%) | 0 (0.0%) |
| Total (Overall) | 64 (70.3%) | 27 (29.7%) |
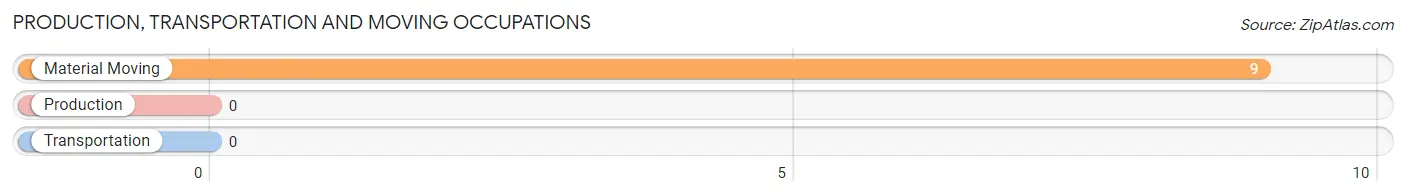
Production, Transportation and Moving Occupations
The most common Production, Transportation and Moving occupations in Glendo are , and Material Moving (9 | 9.9%).
Production, Transportation and Moving Occupations by Sex
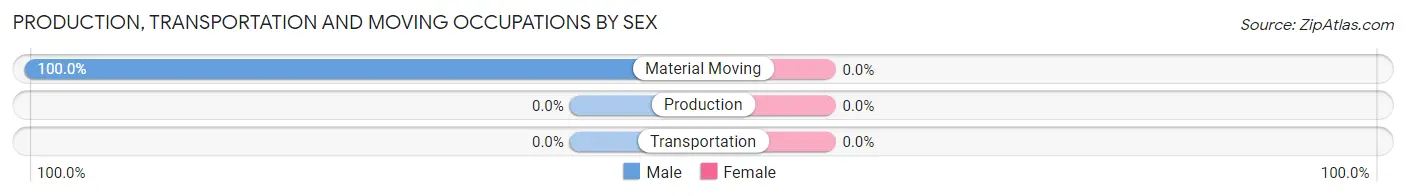
| Occupation | Male | Female |
| Production | 0 (0.0%) | 0 (0.0%) |
| Transportation | 0 (0.0%) | 0 (0.0%) |
| Material Moving | 9 (100.0%) | 0 (0.0%) |
| Total (Category) | 9 (100.0%) | 0 (0.0%) |
| Total (Overall) | 64 (70.3%) | 27 (29.7%) |
Employment Industries by Sex in Glendo
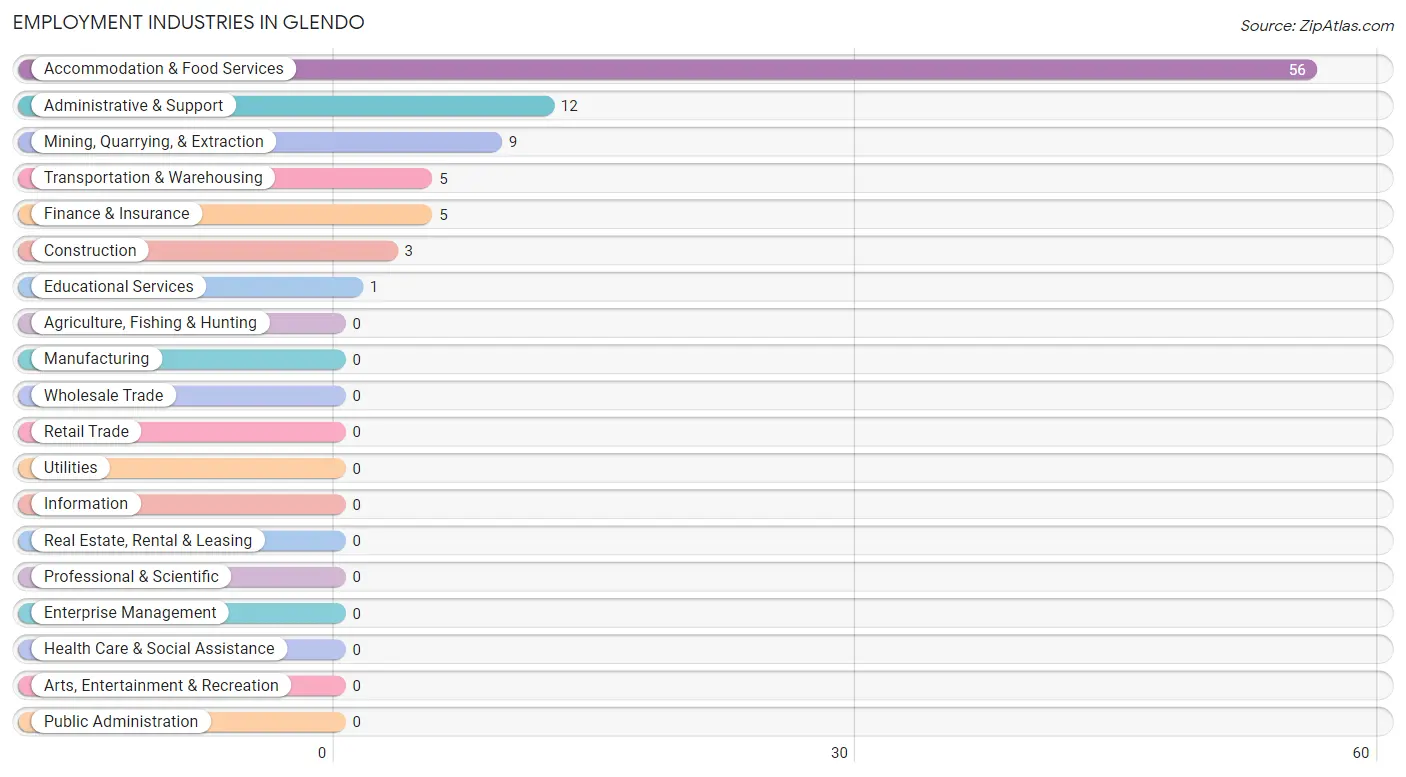
Employment Industries in Glendo
The major employment industries in Glendo include Accommodation & Food Services (56 | 61.5%), Administrative & Support (12 | 13.2%), Mining, Quarrying, & Extraction (9 | 9.9%), Transportation & Warehousing (5 | 5.5%), and Finance & Insurance (5 | 5.5%).
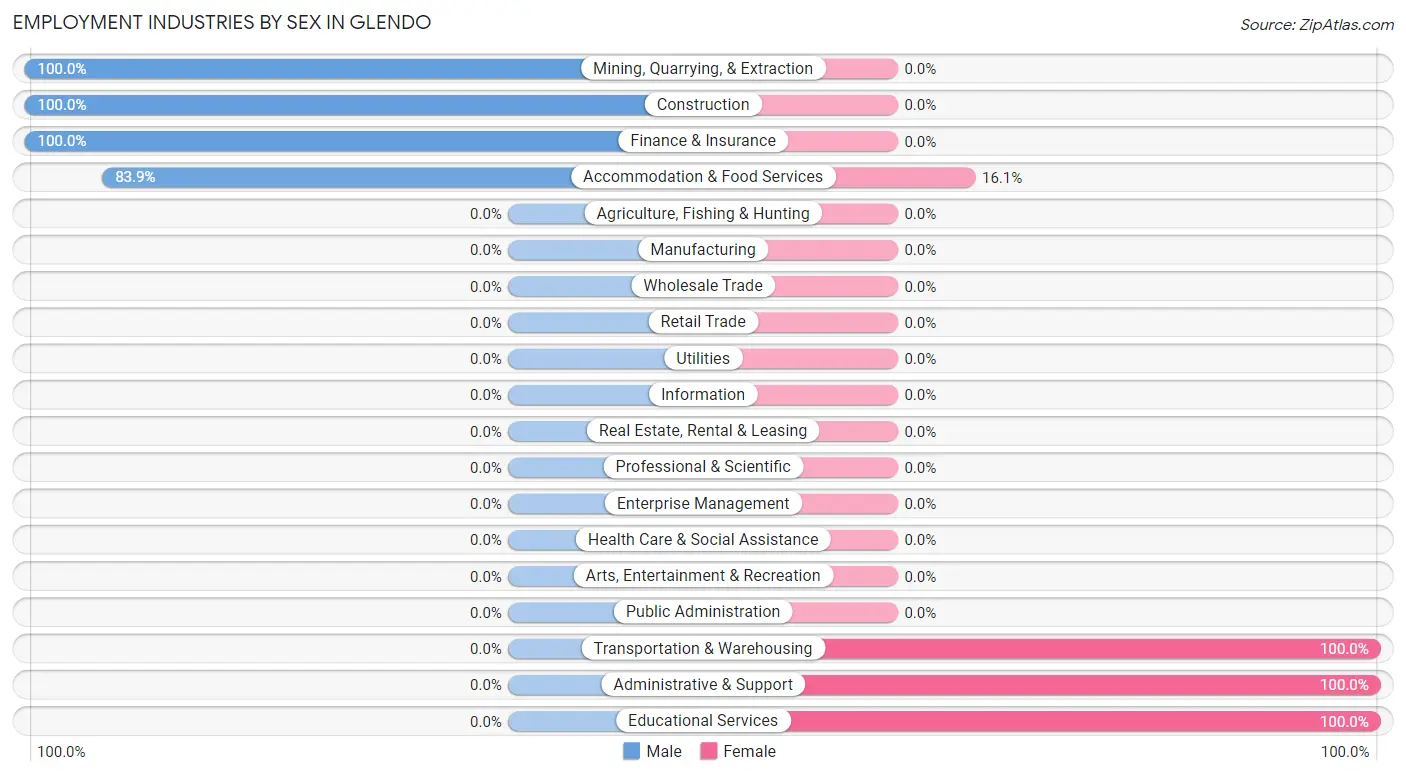
Employment Industries by Sex in Glendo
The Glendo industries that see more men than women are Mining, Quarrying, & Extraction (100.0%), Construction (100.0%), and Finance & Insurance (100.0%), whereas the industries that tend to have a higher number of women are Transportation & Warehousing (100.0%), Administrative & Support (100.0%), and Educational Services (100.0%).
| Industry | Male | Female |
| Agriculture, Fishing & Hunting | 0 (0.0%) | 0 (0.0%) |
| Mining, Quarrying, & Extraction | 9 (100.0%) | 0 (0.0%) |
| Construction | 3 (100.0%) | 0 (0.0%) |
| Manufacturing | 0 (0.0%) | 0 (0.0%) |
| Wholesale Trade | 0 (0.0%) | 0 (0.0%) |
| Retail Trade | 0 (0.0%) | 0 (0.0%) |
| Transportation & Warehousing | 0 (0.0%) | 5 (100.0%) |
| Utilities | 0 (0.0%) | 0 (0.0%) |
| Information | 0 (0.0%) | 0 (0.0%) |
| Finance & Insurance | 5 (100.0%) | 0 (0.0%) |
| Real Estate, Rental & Leasing | 0 (0.0%) | 0 (0.0%) |
| Professional & Scientific | 0 (0.0%) | 0 (0.0%) |
| Enterprise Management | 0 (0.0%) | 0 (0.0%) |
| Administrative & Support | 0 (0.0%) | 12 (100.0%) |
| Educational Services | 0 (0.0%) | 1 (100.0%) |
| Health Care & Social Assistance | 0 (0.0%) | 0 (0.0%) |
| Arts, Entertainment & Recreation | 0 (0.0%) | 0 (0.0%) |
| Accommodation & Food Services | 47 (83.9%) | 9 (16.1%) |
| Public Administration | 0 (0.0%) | 0 (0.0%) |
| Total | 64 (70.3%) | 27 (29.7%) |
Education in Glendo
School Enrollment in Glendo
The most common levels of schooling among the 49 students in Glendo are high school (29 | 59.2%), elementary school (9 | 18.4%), and graduate / professional (9 | 18.4%).
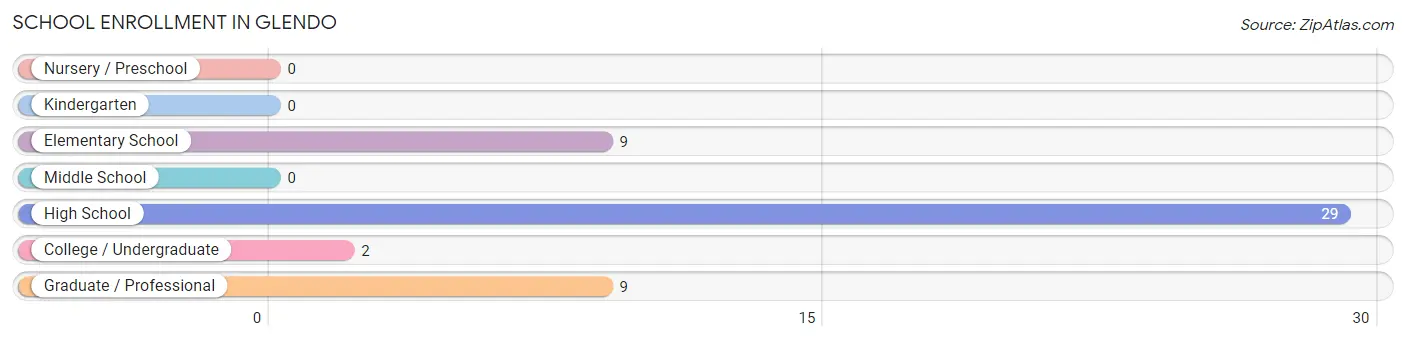
| School Level | # Students | % Students |
| Nursery / Preschool | 0 | 0.0% |
| Kindergarten | 0 | 0.0% |
| Elementary School | 9 | 18.4% |
| Middle School | 0 | 0.0% |
| High School | 29 | 59.2% |
| College / Undergraduate | 2 | 4.1% |
| Graduate / Professional | 9 | 18.4% |
| Total | 49 | 100.0% |
School Enrollment by Age by Funding Source in Glendo
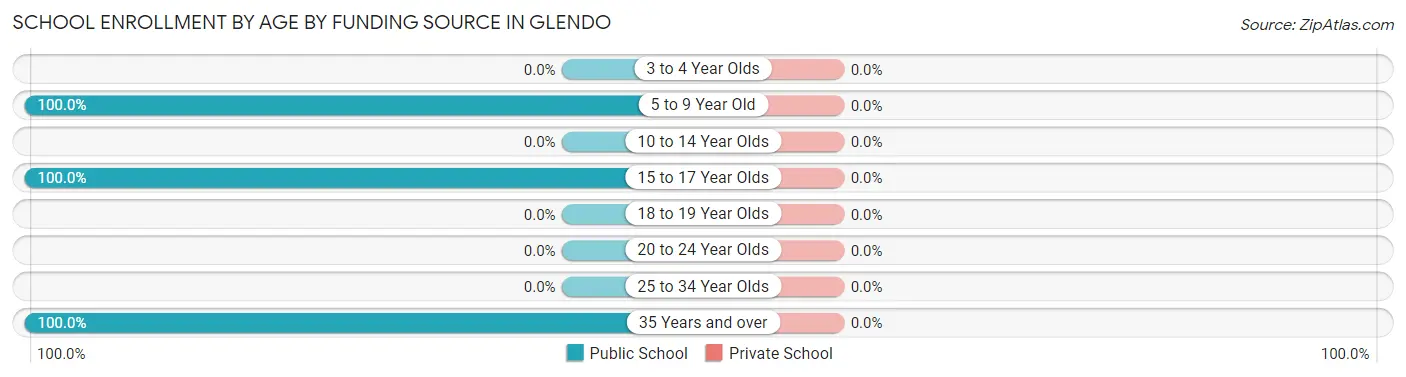
| Age Bracket | Public School | Private School |
| 3 to 4 Year Olds | 0 (0.0%) | 0 (0.0%) |
| 5 to 9 Year Old | 9 (100.0%) | 0 (0.0%) |
| 10 to 14 Year Olds | 0 (0.0%) | 0 (0.0%) |
| 15 to 17 Year Olds | 29 (100.0%) | 0 (0.0%) |
| 18 to 19 Year Olds | 0 (0.0%) | 0 (0.0%) |
| 20 to 24 Year Olds | 0 (0.0%) | 0 (0.0%) |
| 25 to 34 Year Olds | 0 (0.0%) | 0 (0.0%) |
| 35 Years and over | 11 (100.0%) | 0 (0.0%) |
| Total | 49 (100.0%) | 0 (0.0%) |
Educational Attainment by Field of Study in Glendo
Business (9 | 42.9%), physical & health sciences (7 | 33.3%), psychology (3 | 14.3%), and social sciences (2 | 9.5%) are the most common fields of study among 21 individuals in Glendo who have obtained a bachelor's degree or higher.
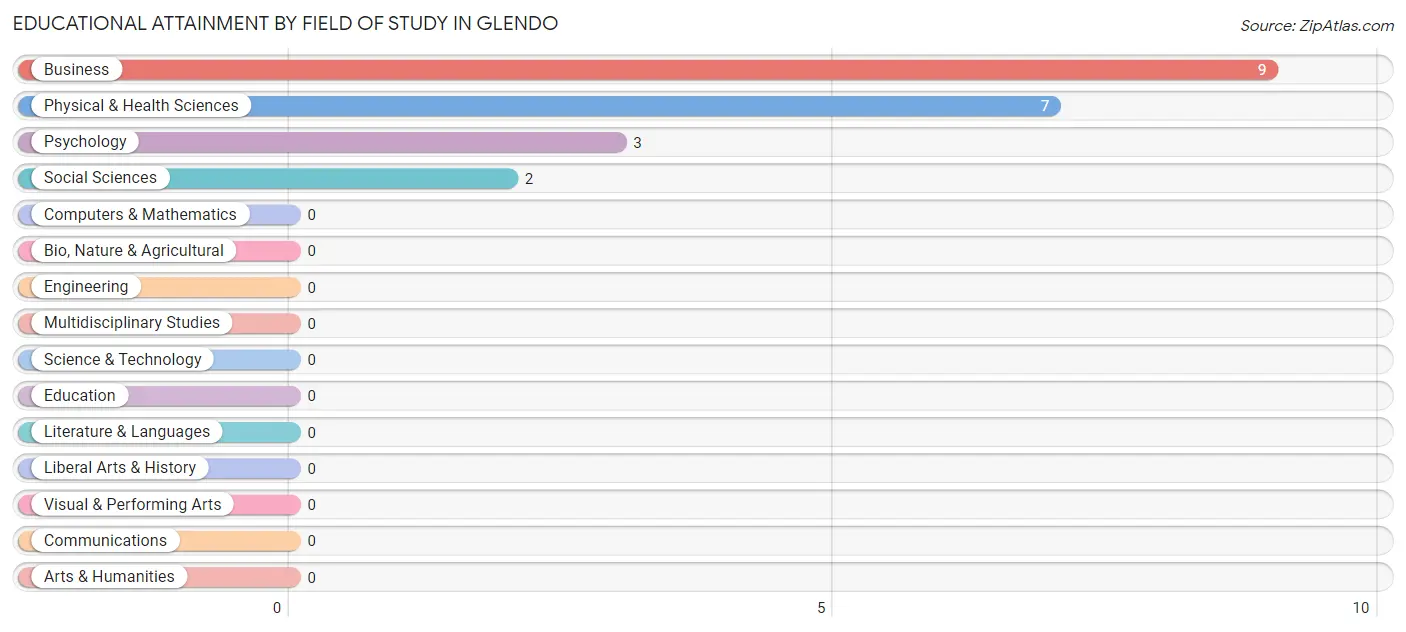
| Field of Study | # Graduates | % Graduates |
| Computers & Mathematics | 0 | 0.0% |
| Bio, Nature & Agricultural | 0 | 0.0% |
| Physical & Health Sciences | 7 | 33.3% |
| Psychology | 3 | 14.3% |
| Social Sciences | 2 | 9.5% |
| Engineering | 0 | 0.0% |
| Multidisciplinary Studies | 0 | 0.0% |
| Science & Technology | 0 | 0.0% |
| Business | 9 | 42.9% |
| Education | 0 | 0.0% |
| Literature & Languages | 0 | 0.0% |
| Liberal Arts & History | 0 | 0.0% |
| Visual & Performing Arts | 0 | 0.0% |
| Communications | 0 | 0.0% |
| Arts & Humanities | 0 | 0.0% |
| Total | 21 | 100.0% |
Transportation & Commute in Glendo
Vehicle Availability by Sex in Glendo
The most prevalent vehicle ownership categories in Glendo are males with 2 vehicles (42, accounting for 65.6%) and females with 2 vehicles (11, making up 155.6%).
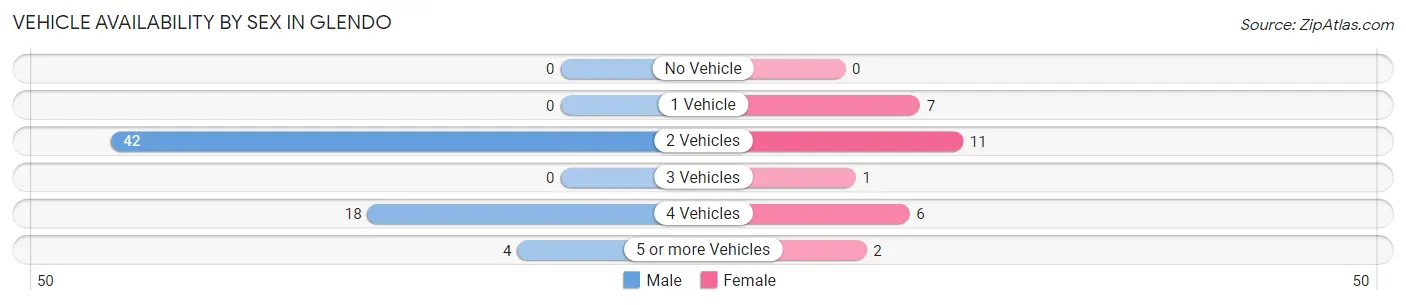
| Vehicles Available | Male | Female |
| No Vehicle | 0 (0.0%) | 0 (0.0%) |
| 1 Vehicle | 0 (0.0%) | 7 (25.9%) |
| 2 Vehicles | 42 (65.6%) | 11 (40.7%) |
| 3 Vehicles | 0 (0.0%) | 1 (3.7%) |
| 4 Vehicles | 18 (28.1%) | 6 (22.2%) |
| 5 or more Vehicles | 4 (6.2%) | 2 (7.4%) |
| Total | 64 (100.0%) | 27 (100.0%) |
Commute Time in Glendo
The most frequently occuring commute durations in Glendo are 5 to 9 minutes (50 commuters, 58.8%), less than 5 minutes (15 commuters, 17.6%), and 90 or more minutes (14 commuters, 16.5%).
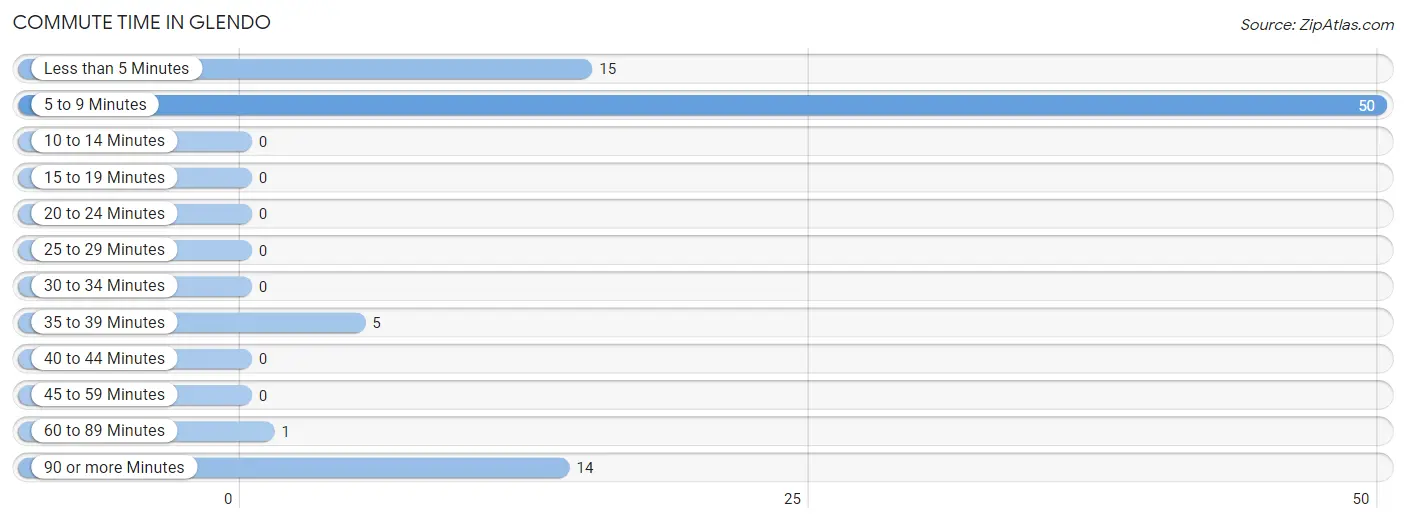
| Commute Time | # Commuters | % Commuters |
| Less than 5 Minutes | 15 | 17.6% |
| 5 to 9 Minutes | 50 | 58.8% |
| 10 to 14 Minutes | 0 | 0.0% |
| 15 to 19 Minutes | 0 | 0.0% |
| 20 to 24 Minutes | 0 | 0.0% |
| 25 to 29 Minutes | 0 | 0.0% |
| 30 to 34 Minutes | 0 | 0.0% |
| 35 to 39 Minutes | 5 | 5.9% |
| 40 to 44 Minutes | 0 | 0.0% |
| 45 to 59 Minutes | 0 | 0.0% |
| 60 to 89 Minutes | 1 | 1.2% |
| 90 or more Minutes | 14 | 16.5% |
Commute Time by Sex in Glendo
The most common commute times in Glendo are 5 to 9 minutes (43 commuters, 67.2%) for males and less than 5 minutes (8 commuters, 38.1%) for females.
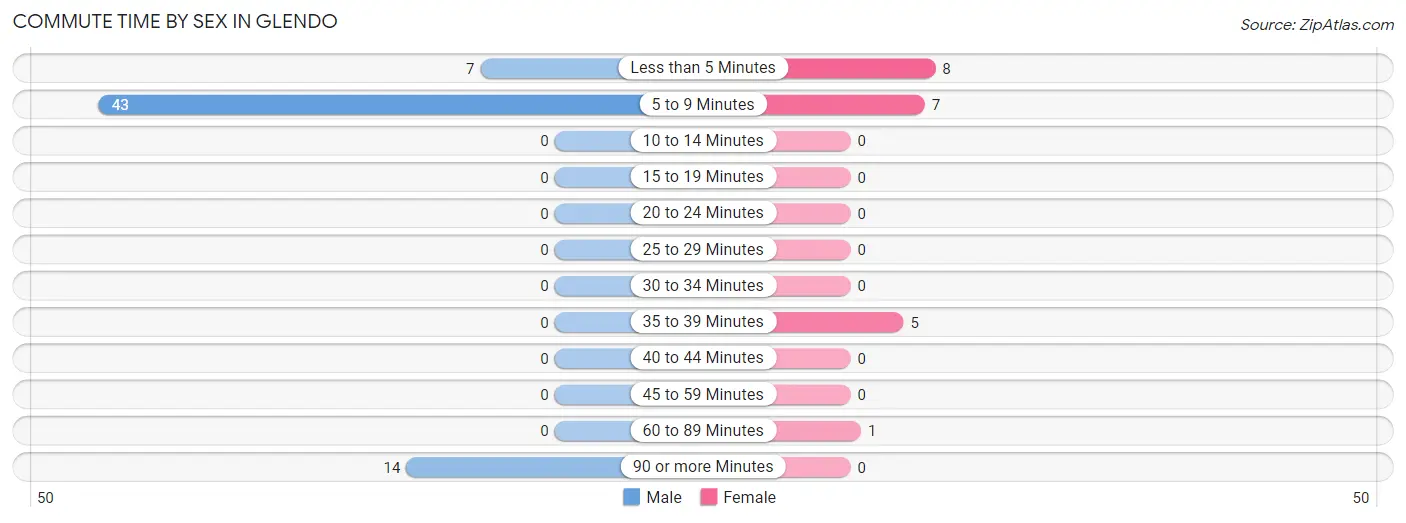
| Commute Time | Male | Female |
| Less than 5 Minutes | 7 (10.9%) | 8 (38.1%) |
| 5 to 9 Minutes | 43 (67.2%) | 7 (33.3%) |
| 10 to 14 Minutes | 0 (0.0%) | 0 (0.0%) |
| 15 to 19 Minutes | 0 (0.0%) | 0 (0.0%) |
| 20 to 24 Minutes | 0 (0.0%) | 0 (0.0%) |
| 25 to 29 Minutes | 0 (0.0%) | 0 (0.0%) |
| 30 to 34 Minutes | 0 (0.0%) | 0 (0.0%) |
| 35 to 39 Minutes | 0 (0.0%) | 5 (23.8%) |
| 40 to 44 Minutes | 0 (0.0%) | 0 (0.0%) |
| 45 to 59 Minutes | 0 (0.0%) | 0 (0.0%) |
| 60 to 89 Minutes | 0 (0.0%) | 1 (4.8%) |
| 90 or more Minutes | 14 (21.9%) | 0 (0.0%) |
Time of Departure to Work by Sex in Glendo
The most frequent times of departure to work in Glendo are 8:00 AM to 8:29 AM (34, 53.1%) for males and 8:00 AM to 8:29 AM (6, 28.6%) for females.
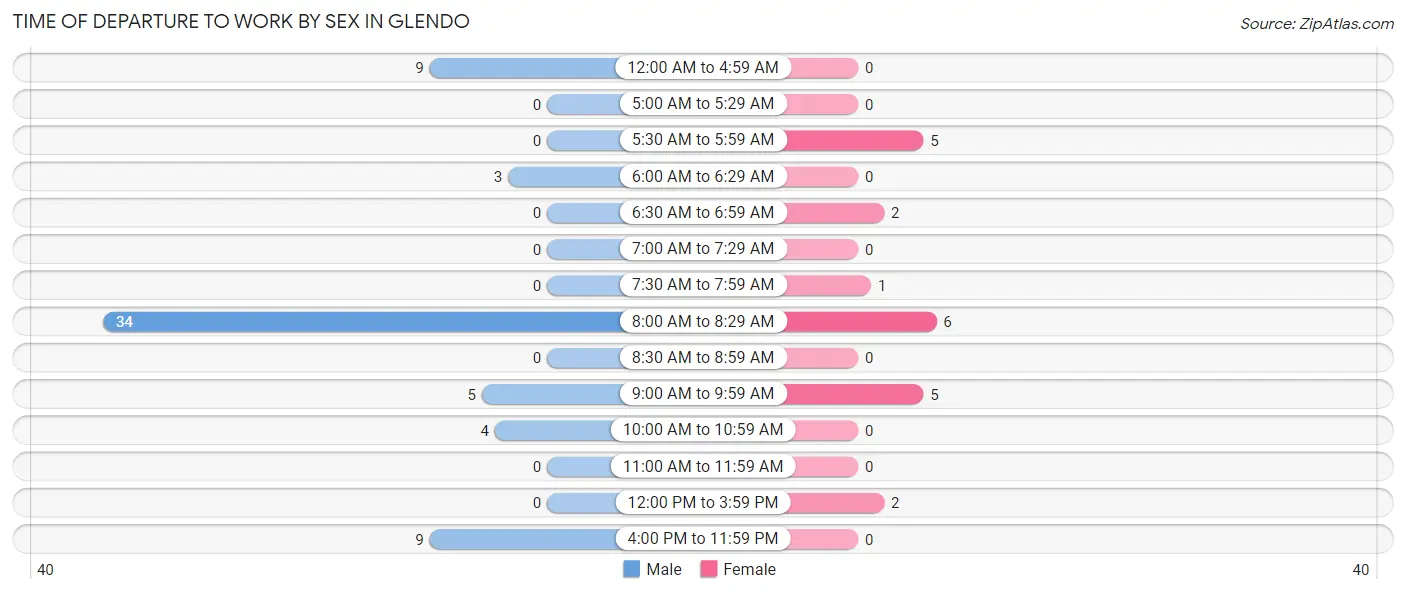
| Time of Departure | Male | Female |
| 12:00 AM to 4:59 AM | 9 (14.1%) | 0 (0.0%) |
| 5:00 AM to 5:29 AM | 0 (0.0%) | 0 (0.0%) |
| 5:30 AM to 5:59 AM | 0 (0.0%) | 5 (23.8%) |
| 6:00 AM to 6:29 AM | 3 (4.7%) | 0 (0.0%) |
| 6:30 AM to 6:59 AM | 0 (0.0%) | 2 (9.5%) |
| 7:00 AM to 7:29 AM | 0 (0.0%) | 0 (0.0%) |
| 7:30 AM to 7:59 AM | 0 (0.0%) | 1 (4.8%) |
| 8:00 AM to 8:29 AM | 34 (53.1%) | 6 (28.6%) |
| 8:30 AM to 8:59 AM | 0 (0.0%) | 0 (0.0%) |
| 9:00 AM to 9:59 AM | 5 (7.8%) | 5 (23.8%) |
| 10:00 AM to 10:59 AM | 4 (6.2%) | 0 (0.0%) |
| 11:00 AM to 11:59 AM | 0 (0.0%) | 0 (0.0%) |
| 12:00 PM to 3:59 PM | 0 (0.0%) | 2 (9.5%) |
| 4:00 PM to 11:59 PM | 9 (14.1%) | 0 (0.0%) |
| Total | 64 (100.0%) | 21 (100.0%) |
Housing Occupancy in Glendo
Occupancy by Ownership in Glendo
Of the total 116 dwellings in Glendo, owner-occupied units account for 94 (81.0%), while renter-occupied units make up 22 (19.0%).
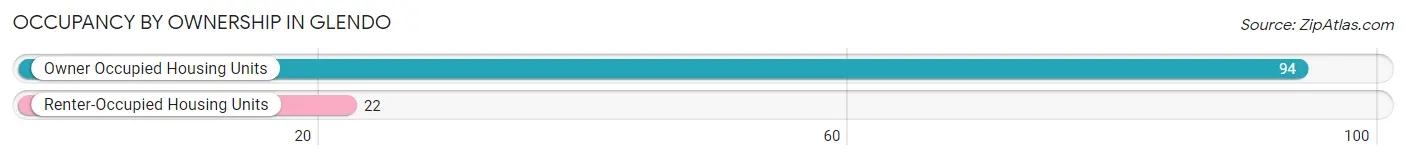
| Occupancy | # Housing Units | % Housing Units |
| Owner Occupied Housing Units | 94 | 81.0% |
| Renter-Occupied Housing Units | 22 | 19.0% |
| Total Occupied Housing Units | 116 | 100.0% |
Occupancy by Household Size in Glendo
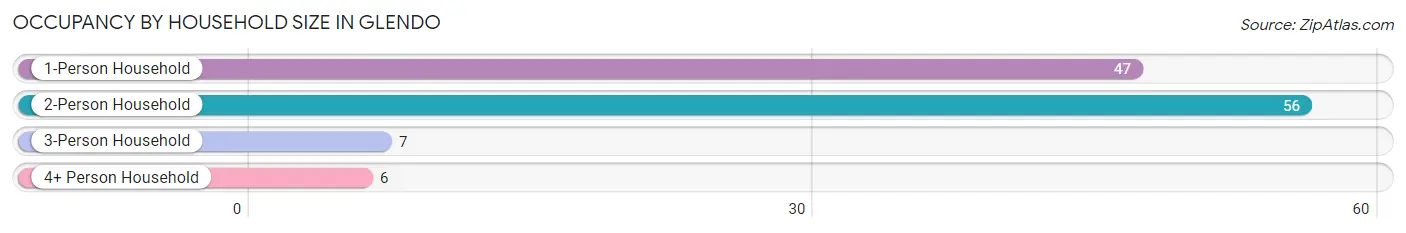
| Household Size | # Housing Units | % Housing Units |
| 1-Person Household | 47 | 40.5% |
| 2-Person Household | 56 | 48.3% |
| 3-Person Household | 7 | 6.0% |
| 4+ Person Household | 6 | 5.2% |
| Total Housing Units | 116 | 100.0% |
Occupancy by Ownership by Household Size in Glendo
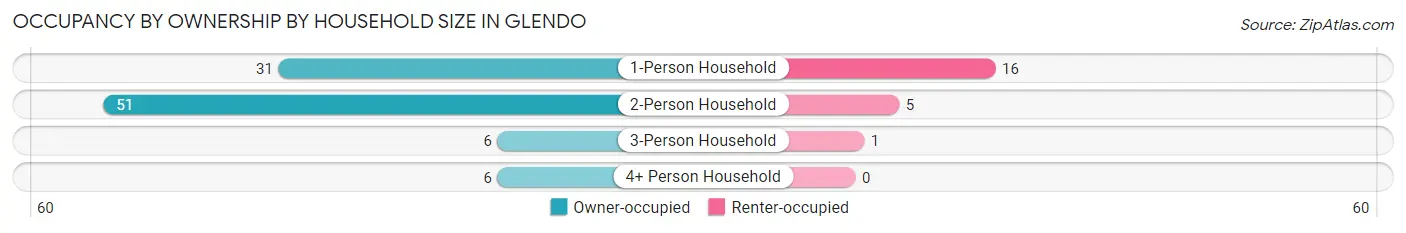
| Household Size | Owner-occupied | Renter-occupied |
| 1-Person Household | 31 (66.0%) | 16 (34.0%) |
| 2-Person Household | 51 (91.1%) | 5 (8.9%) |
| 3-Person Household | 6 (85.7%) | 1 (14.3%) |
| 4+ Person Household | 6 (100.0%) | 0 (0.0%) |
| Total Housing Units | 94 (81.0%) | 22 (19.0%) |
Occupancy by Educational Attainment in Glendo
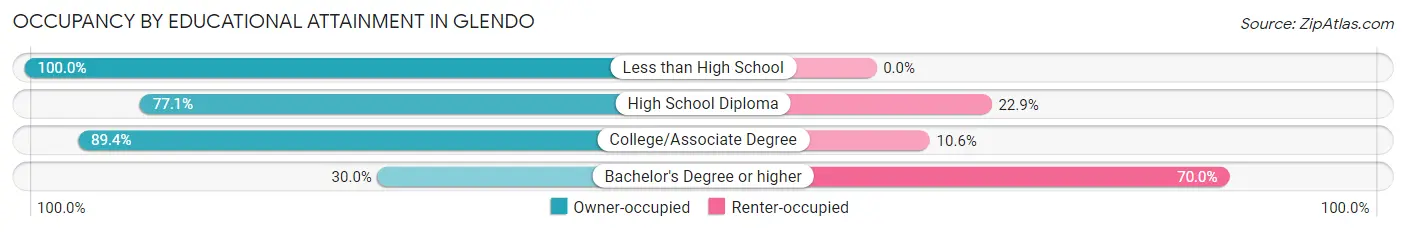
| Household Size | Owner-occupied | Renter-occupied |
| Less than High School | 5 (100.0%) | 0 (0.0%) |
| High School Diploma | 27 (77.1%) | 8 (22.9%) |
| College/Associate Degree | 59 (89.4%) | 7 (10.6%) |
| Bachelor's Degree or higher | 3 (30.0%) | 7 (70.0%) |
Occupancy by Age of Householder in Glendo
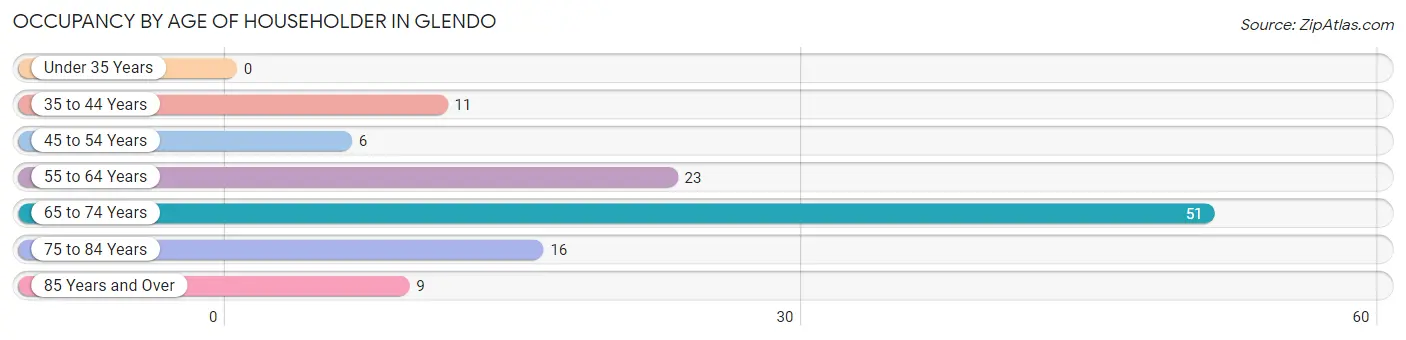
| Age Bracket | # Households | % Households |
| Under 35 Years | 0 | 0.0% |
| 35 to 44 Years | 11 | 9.5% |
| 45 to 54 Years | 6 | 5.2% |
| 55 to 64 Years | 23 | 19.8% |
| 65 to 74 Years | 51 | 44.0% |
| 75 to 84 Years | 16 | 13.8% |
| 85 Years and Over | 9 | 7.8% |
| Total | 116 | 100.0% |
Housing Finances in Glendo
Median Income by Occupancy in Glendo
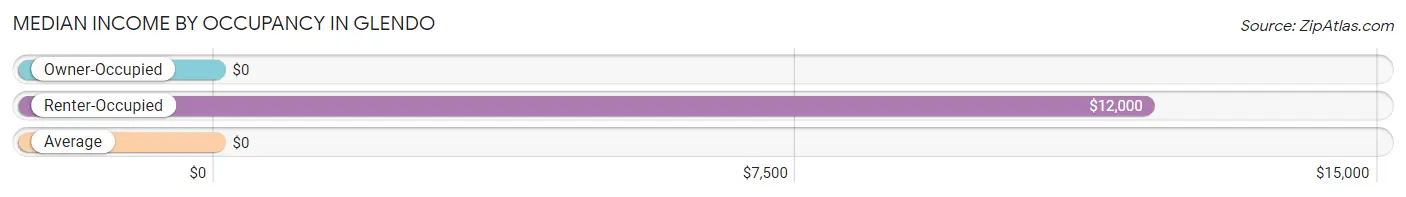
| Occupancy Type | # Households | Median Income |
| Owner-Occupied | 94 (81.0%) | $0 |
| Renter-Occupied | 22 (19.0%) | $12,000 |
| Average | 116 (100.0%) | $0 |
Occupancy by Householder Income Bracket in Glendo
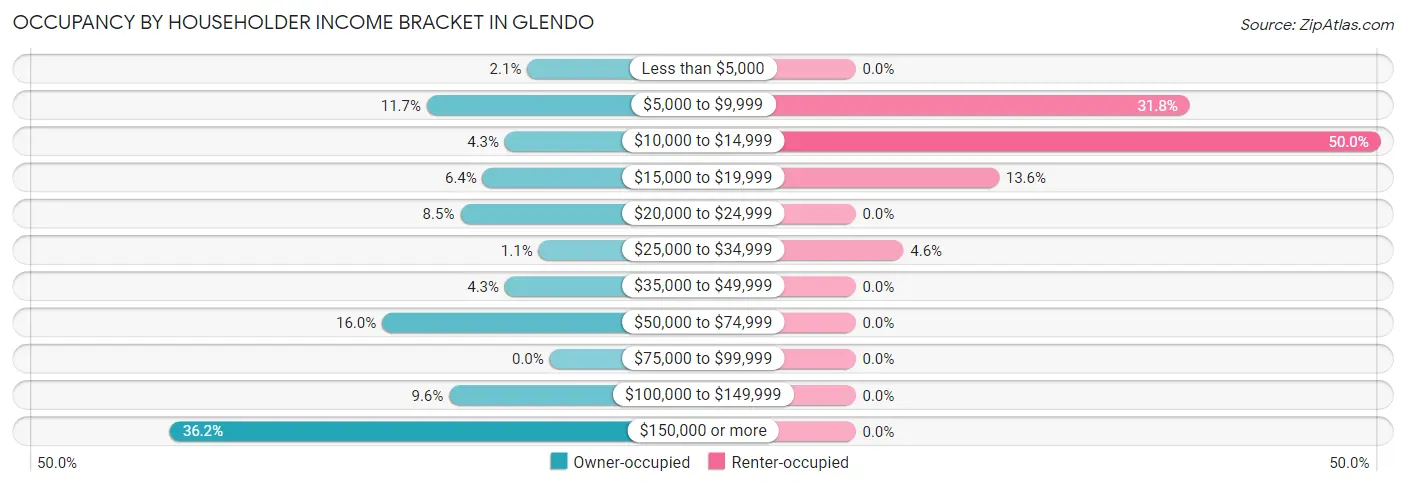
| Income Bracket | Owner-occupied | Renter-occupied |
| Less than $5,000 | 2 (2.1%) | 0 (0.0%) |
| $5,000 to $9,999 | 11 (11.7%) | 7 (31.8%) |
| $10,000 to $14,999 | 4 (4.3%) | 11 (50.0%) |
| $15,000 to $19,999 | 6 (6.4%) | 3 (13.6%) |
| $20,000 to $24,999 | 8 (8.5%) | 0 (0.0%) |
| $25,000 to $34,999 | 1 (1.1%) | 1 (4.5%) |
| $35,000 to $49,999 | 4 (4.3%) | 0 (0.0%) |
| $50,000 to $74,999 | 15 (16.0%) | 0 (0.0%) |
| $75,000 to $99,999 | 0 (0.0%) | 0 (0.0%) |
| $100,000 to $149,999 | 9 (9.6%) | 0 (0.0%) |
| $150,000 or more | 34 (36.2%) | 0 (0.0%) |
| Total | 94 (100.0%) | 22 (100.0%) |
Monthly Housing Cost Tiers in Glendo
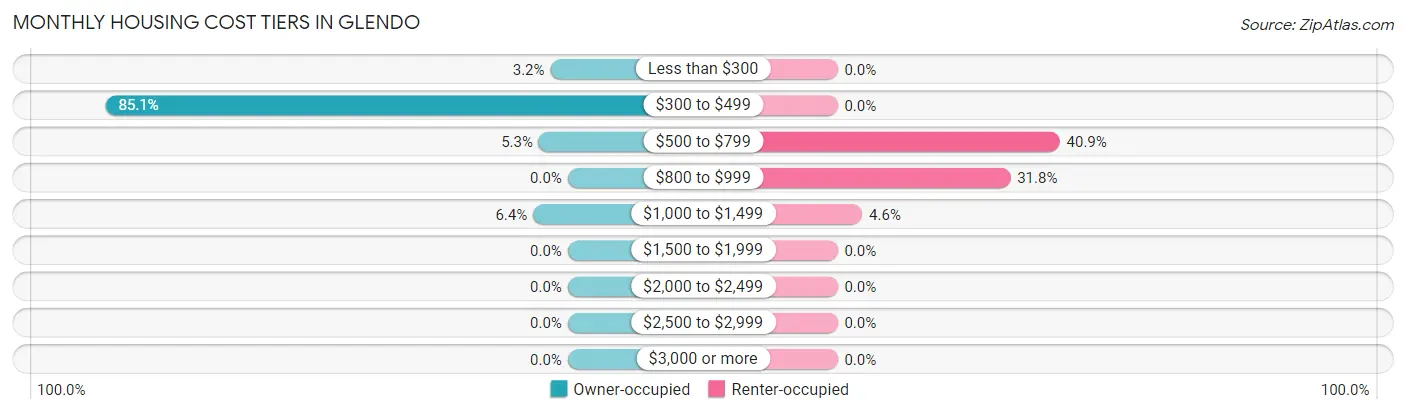
| Monthly Cost | Owner-occupied | Renter-occupied |
| Less than $300 | 3 (3.2%) | 0 (0.0%) |
| $300 to $499 | 80 (85.1%) | 0 (0.0%) |
| $500 to $799 | 5 (5.3%) | 9 (40.9%) |
| $800 to $999 | 0 (0.0%) | 7 (31.8%) |
| $1,000 to $1,499 | 6 (6.4%) | 1 (4.5%) |
| $1,500 to $1,999 | 0 (0.0%) | 0 (0.0%) |
| $2,000 to $2,499 | 0 (0.0%) | 0 (0.0%) |
| $2,500 to $2,999 | 0 (0.0%) | 0 (0.0%) |
| $3,000 or more | 0 (0.0%) | 0 (0.0%) |
| Total | 94 (100.0%) | 22 (100.0%) |
Physical Housing Characteristics in Glendo
Housing Structures in Glendo
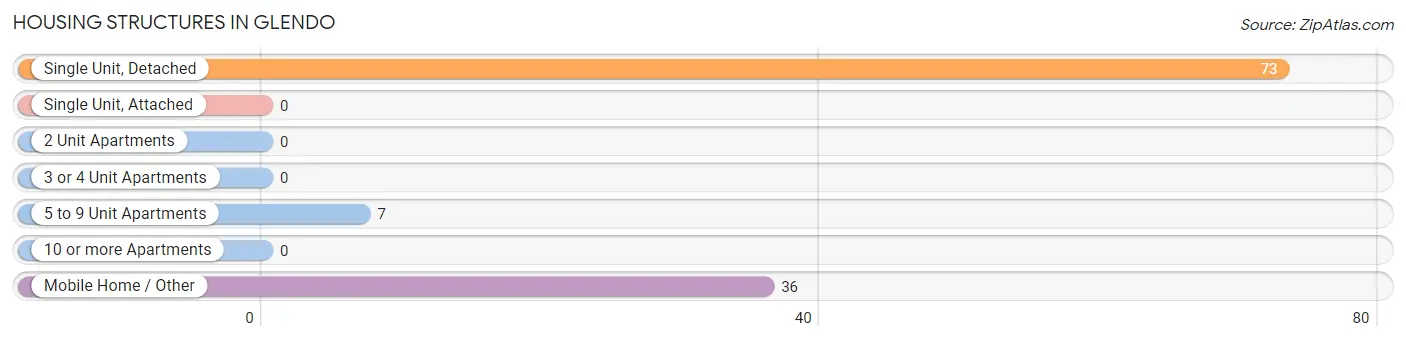
| Structure Type | # Housing Units | % Housing Units |
| Single Unit, Detached | 73 | 62.9% |
| Single Unit, Attached | 0 | 0.0% |
| 2 Unit Apartments | 0 | 0.0% |
| 3 or 4 Unit Apartments | 0 | 0.0% |
| 5 to 9 Unit Apartments | 7 | 6.0% |
| 10 or more Apartments | 0 | 0.0% |
| Mobile Home / Other | 36 | 31.0% |
| Total | 116 | 100.0% |
Housing Structures by Occupancy in Glendo
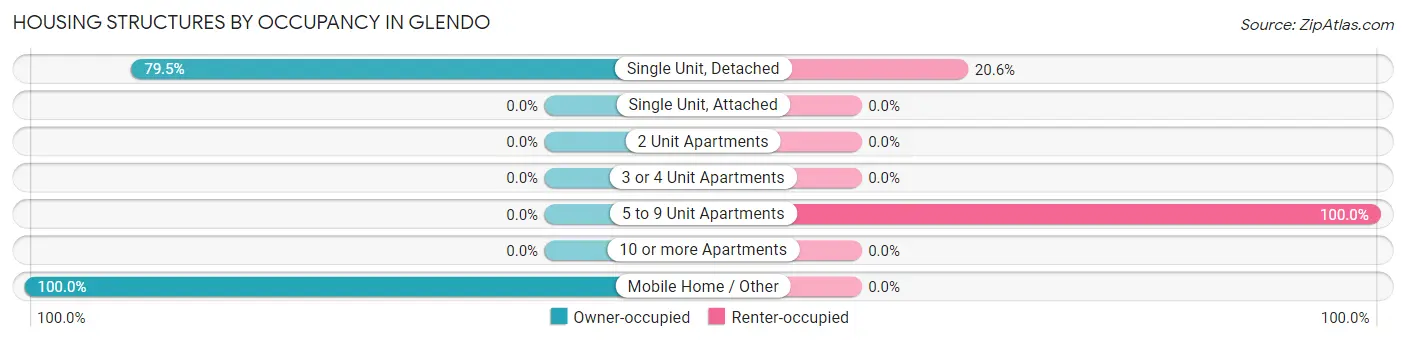
| Structure Type | Owner-occupied | Renter-occupied |
| Single Unit, Detached | 58 (79.4%) | 15 (20.5%) |
| Single Unit, Attached | 0 (0.0%) | 0 (0.0%) |
| 2 Unit Apartments | 0 (0.0%) | 0 (0.0%) |
| 3 or 4 Unit Apartments | 0 (0.0%) | 0 (0.0%) |
| 5 to 9 Unit Apartments | 0 (0.0%) | 7 (100.0%) |
| 10 or more Apartments | 0 (0.0%) | 0 (0.0%) |
| Mobile Home / Other | 36 (100.0%) | 0 (0.0%) |
| Total | 94 (81.0%) | 22 (19.0%) |
Housing Structures by Number of Rooms in Glendo
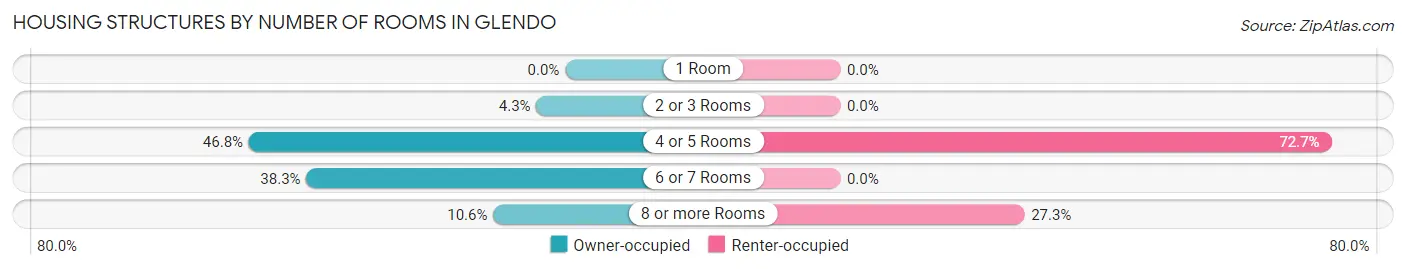
| Number of Rooms | Owner-occupied | Renter-occupied |
| 1 Room | 0 (0.0%) | 0 (0.0%) |
| 2 or 3 Rooms | 4 (4.3%) | 0 (0.0%) |
| 4 or 5 Rooms | 44 (46.8%) | 16 (72.7%) |
| 6 or 7 Rooms | 36 (38.3%) | 0 (0.0%) |
| 8 or more Rooms | 10 (10.6%) | 6 (27.3%) |
| Total | 94 (100.0%) | 22 (100.0%) |
Housing Structure by Heating Type in Glendo
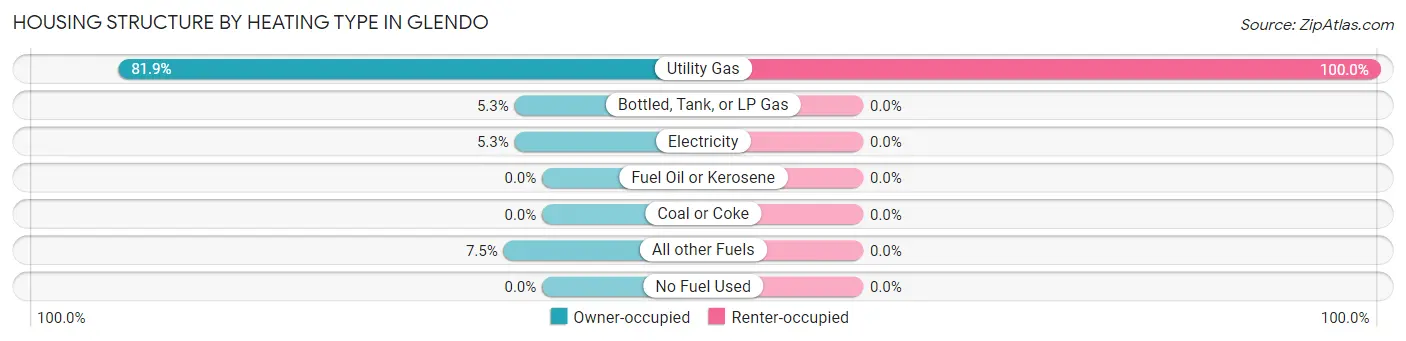
| Heating Type | Owner-occupied | Renter-occupied |
| Utility Gas | 77 (81.9%) | 22 (100.0%) |
| Bottled, Tank, or LP Gas | 5 (5.3%) | 0 (0.0%) |
| Electricity | 5 (5.3%) | 0 (0.0%) |
| Fuel Oil or Kerosene | 0 (0.0%) | 0 (0.0%) |
| Coal or Coke | 0 (0.0%) | 0 (0.0%) |
| All other Fuels | 7 (7.4%) | 0 (0.0%) |
| No Fuel Used | 0 (0.0%) | 0 (0.0%) |
| Total | 94 (100.0%) | 22 (100.0%) |
Household Vehicle Usage in Glendo
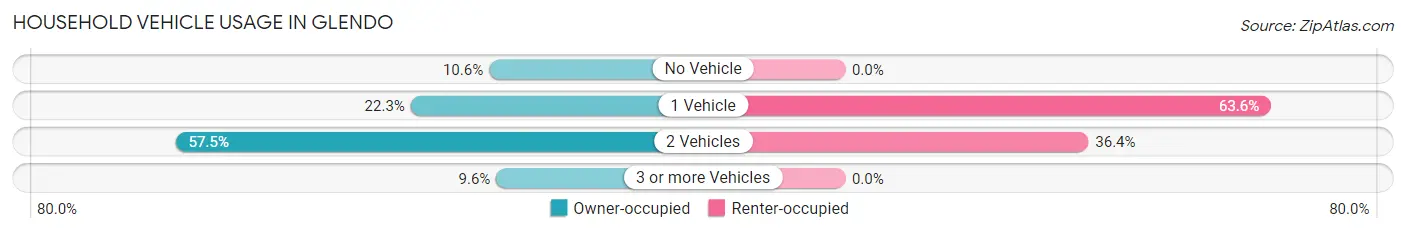
| Vehicles per Household | Owner-occupied | Renter-occupied |
| No Vehicle | 10 (10.6%) | 0 (0.0%) |
| 1 Vehicle | 21 (22.3%) | 14 (63.6%) |
| 2 Vehicles | 54 (57.5%) | 8 (36.4%) |
| 3 or more Vehicles | 9 (9.6%) | 0 (0.0%) |
| Total | 94 (100.0%) | 22 (100.0%) |
Real Estate & Mortgages in Glendo
Real Estate and Mortgage Overview in Glendo
| Characteristic | Without Mortgage | With Mortgage |
| Housing Units | 88 | 6 |
| Median Property Value | $180,100 | $0 |
| Median Household Income | - | - |
| Monthly Housing Costs | $434 | $0 |
| Real Estate Taxes | $1,012 | $0 |
Property Value by Mortgage Status in Glendo
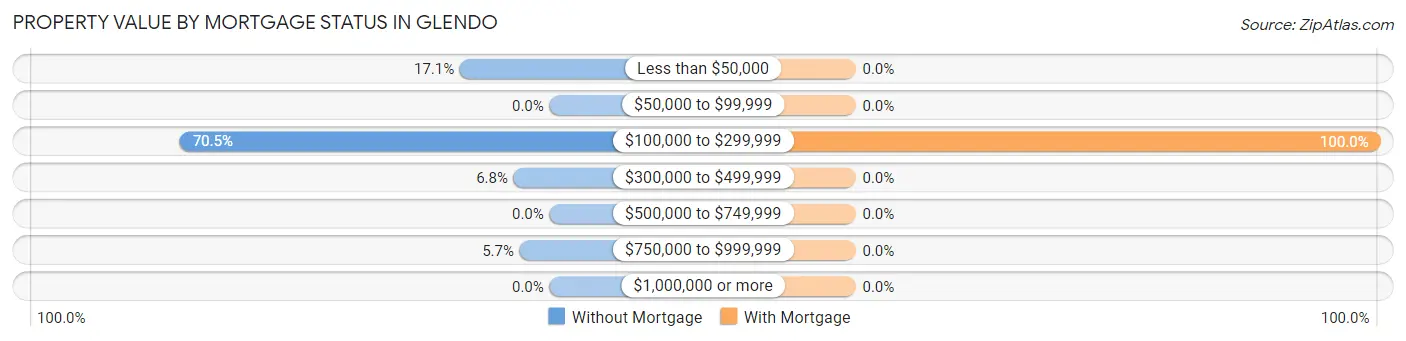
| Property Value | Without Mortgage | With Mortgage |
| Less than $50,000 | 15 (17.1%) | 0 (0.0%) |
| $50,000 to $99,999 | 0 (0.0%) | 0 (0.0%) |
| $100,000 to $299,999 | 62 (70.5%) | 6 (100.0%) |
| $300,000 to $499,999 | 6 (6.8%) | 0 (0.0%) |
| $500,000 to $749,999 | 0 (0.0%) | 0 (0.0%) |
| $750,000 to $999,999 | 5 (5.7%) | 0 (0.0%) |
| $1,000,000 or more | 0 (0.0%) | 0 (0.0%) |
| Total | 88 (100.0%) | 6 (100.0%) |
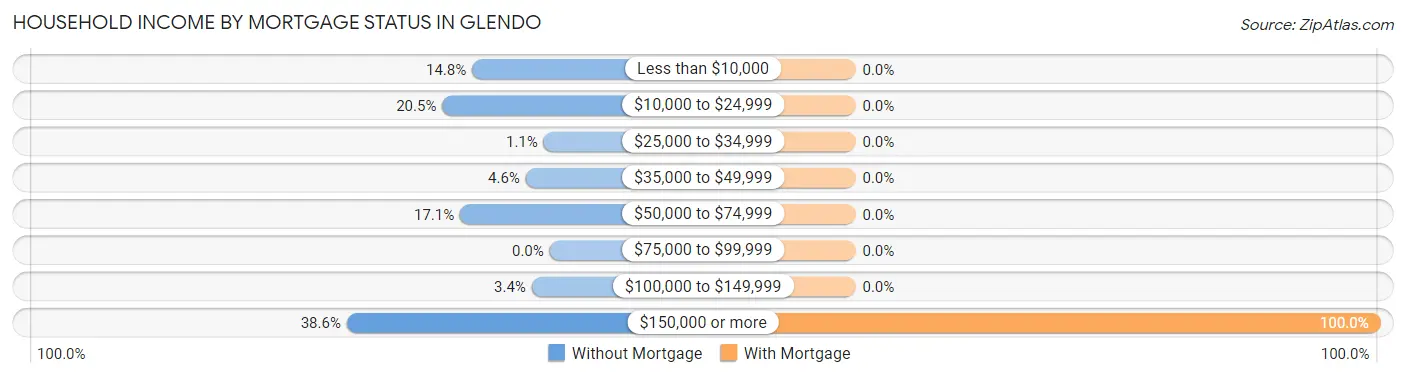
Household Income by Mortgage Status in Glendo
| Household Income | Without Mortgage | With Mortgage |
| Less than $10,000 | 13 (14.8%) | 0 (0.0%) |
| $10,000 to $24,999 | 18 (20.4%) | 0 (0.0%) |
| $25,000 to $34,999 | 1 (1.1%) | 0 (0.0%) |
| $35,000 to $49,999 | 4 (4.5%) | 0 (0.0%) |
| $50,000 to $74,999 | 15 (17.1%) | 0 (0.0%) |
| $75,000 to $99,999 | 0 (0.0%) | 0 (0.0%) |
| $100,000 to $149,999 | 3 (3.4%) | 0 (0.0%) |
| $150,000 or more | 34 (38.6%) | 6 (100.0%) |
| Total | 88 (100.0%) | 6 (100.0%) |
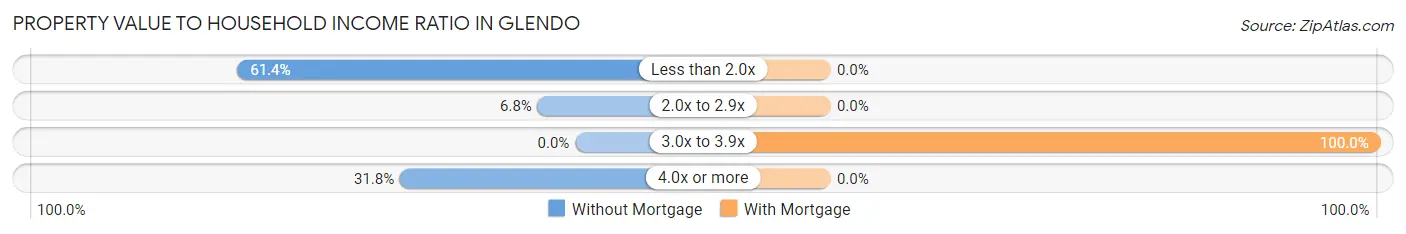
Property Value to Household Income Ratio in Glendo
| Value-to-Income Ratio | Without Mortgage | With Mortgage |
| Less than 2.0x | 54 (61.4%) | 0 (0.0%) |
| 2.0x to 2.9x | 6 (6.8%) | 0 (0.0%) |
| 3.0x to 3.9x | 0 (0.0%) | 6 (100.0%) |
| 4.0x or more | 28 (31.8%) | 0 (0.0%) |
| Total | 88 (100.0%) | 6 (100.0%) |
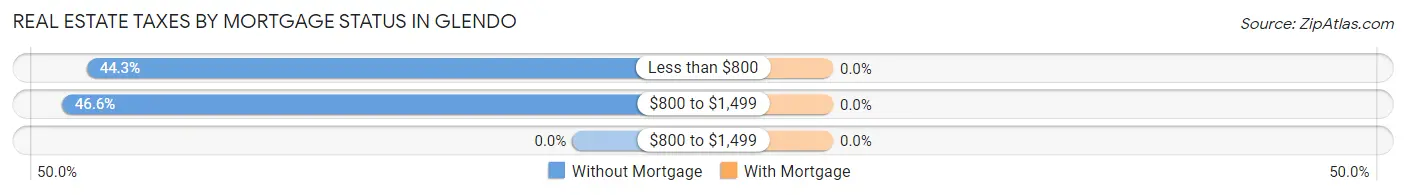
Real Estate Taxes by Mortgage Status in Glendo
| Property Taxes | Without Mortgage | With Mortgage |
| Less than $800 | 39 (44.3%) | 0 (0.0%) |
| $800 to $1,499 | 41 (46.6%) | 0 (0.0%) |
| $800 to $1,499 | 0 (0.0%) | 0 (0.0%) |
| Total | 88 (100.0%) | 6 (100.0%) |
Health & Disability in Glendo
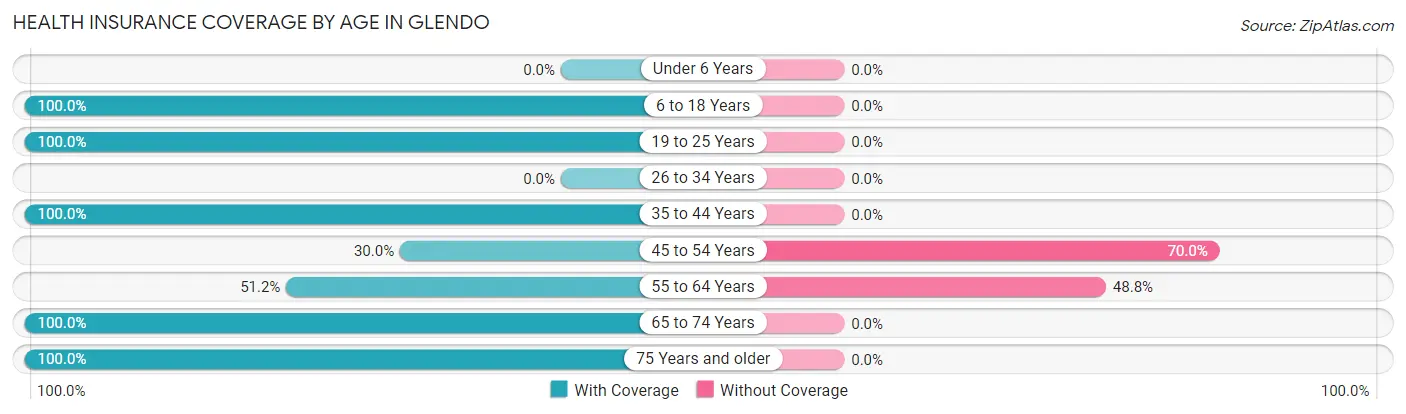
Health Insurance Coverage by Age in Glendo
| Age Bracket | With Coverage | Without Coverage |
| Under 6 Years | 0 (0.0%) | 0 (0.0%) |
| 6 to 18 Years | 38 (100.0%) | 0 (0.0%) |
| 19 to 25 Years | 5 (100.0%) | 0 (0.0%) |
| 26 to 34 Years | 0 (0.0%) | 0 (0.0%) |
| 35 to 44 Years | 20 (100.0%) | 0 (0.0%) |
| 45 to 54 Years | 3 (30.0%) | 7 (70.0%) |
| 55 to 64 Years | 21 (51.2%) | 20 (48.8%) |
| 65 to 74 Years | 57 (100.0%) | 0 (0.0%) |
| 75 Years and older | 38 (100.0%) | 0 (0.0%) |
| Total | 182 (87.1%) | 27 (12.9%) |
Health Insurance Coverage by Citizenship Status in Glendo
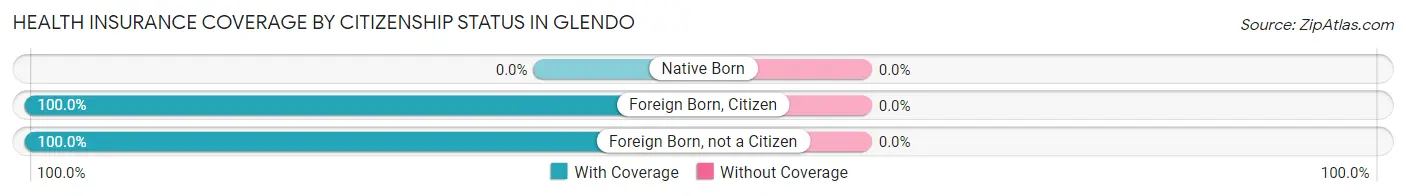
| Citizenship Status | With Coverage | Without Coverage |
| Native Born | 0 (0.0%) | 0 (0.0%) |
| Foreign Born, Citizen | 38 (100.0%) | 0 (0.0%) |
| Foreign Born, not a Citizen | 5 (100.0%) | 0 (0.0%) |
Health Insurance Coverage by Household Income in Glendo
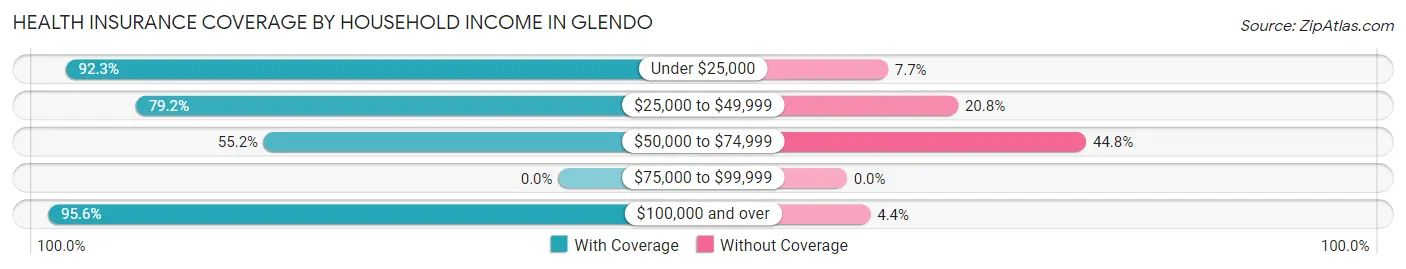
| Household Income | With Coverage | Without Coverage |
| Under $25,000 | 60 (92.3%) | 5 (7.7%) |
| $25,000 to $49,999 | 19 (79.2%) | 5 (20.8%) |
| $50,000 to $74,999 | 16 (55.2%) | 13 (44.8%) |
| $75,000 to $99,999 | 0 (0.0%) | 0 (0.0%) |
| $100,000 and over | 87 (95.6%) | 4 (4.4%) |
Public vs Private Health Insurance Coverage by Age in Glendo
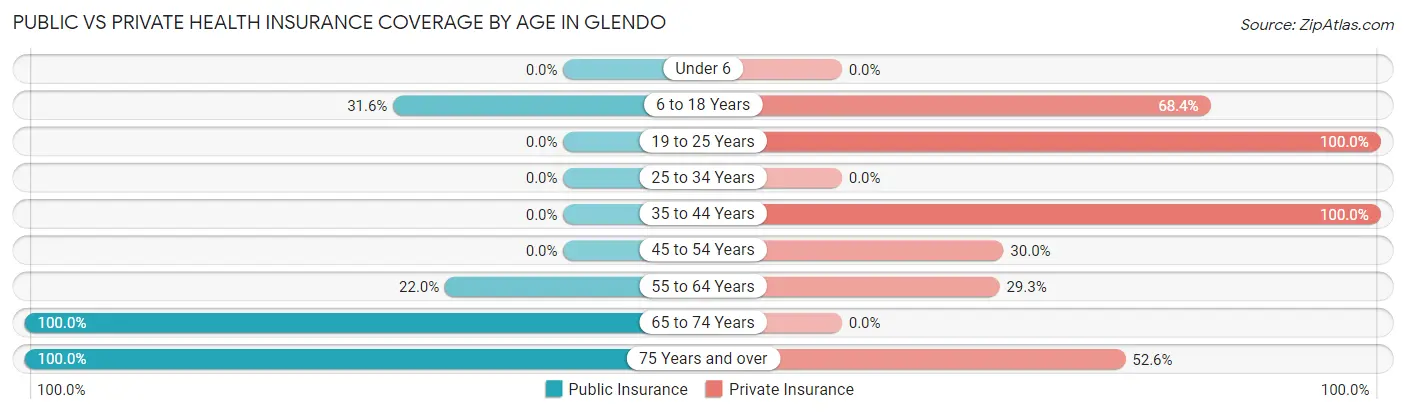
| Age Bracket | Public Insurance | Private Insurance |
| Under 6 | 0 (0.0%) | 0 (0.0%) |
| 6 to 18 Years | 12 (31.6%) | 26 (68.4%) |
| 19 to 25 Years | 0 (0.0%) | 5 (100.0%) |
| 25 to 34 Years | 0 (0.0%) | 0 (0.0%) |
| 35 to 44 Years | 0 (0.0%) | 20 (100.0%) |
| 45 to 54 Years | 0 (0.0%) | 3 (30.0%) |
| 55 to 64 Years | 9 (22.0%) | 12 (29.3%) |
| 65 to 74 Years | 57 (100.0%) | 0 (0.0%) |
| 75 Years and over | 38 (100.0%) | 20 (52.6%) |
| Total | 116 (55.5%) | 86 (41.1%) |
Disability Status by Sex by Age in Glendo
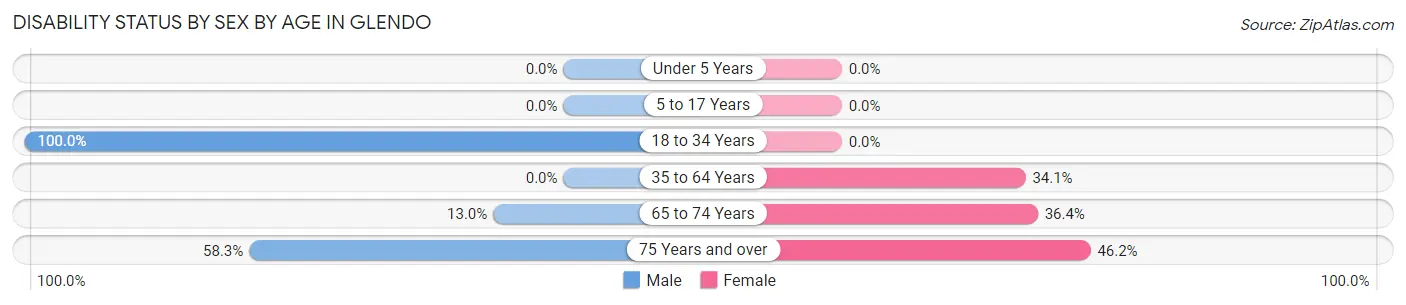
| Age Bracket | Male | Female |
| Under 5 Years | 0 (0.0%) | 0 (0.0%) |
| 5 to 17 Years | 0 (0.0%) | 0 (0.0%) |
| 18 to 34 Years | 5 (100.0%) | 0 (0.0%) |
| 35 to 64 Years | 0 (0.0%) | 15 (34.1%) |
| 65 to 74 Years | 6 (13.0%) | 4 (36.4%) |
| 75 Years and over | 7 (58.3%) | 12 (46.2%) |
Disability Class by Sex by Age in Glendo
Disability Class: Hearing Difficulty
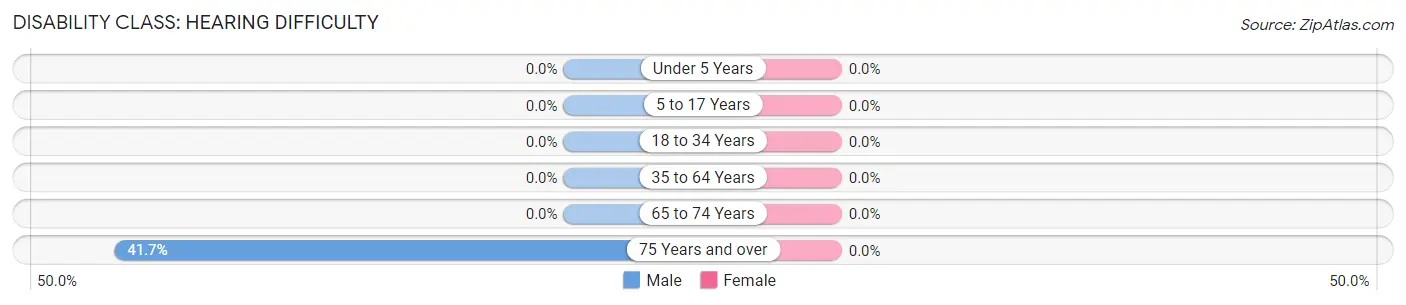
| Age Bracket | Male | Female |
| Under 5 Years | 0 (0.0%) | 0 (0.0%) |
| 5 to 17 Years | 0 (0.0%) | 0 (0.0%) |
| 18 to 34 Years | 0 (0.0%) | 0 (0.0%) |
| 35 to 64 Years | 0 (0.0%) | 0 (0.0%) |
| 65 to 74 Years | 0 (0.0%) | 0 (0.0%) |
| 75 Years and over | 5 (41.7%) | 0 (0.0%) |
Disability Class: Vision Difficulty
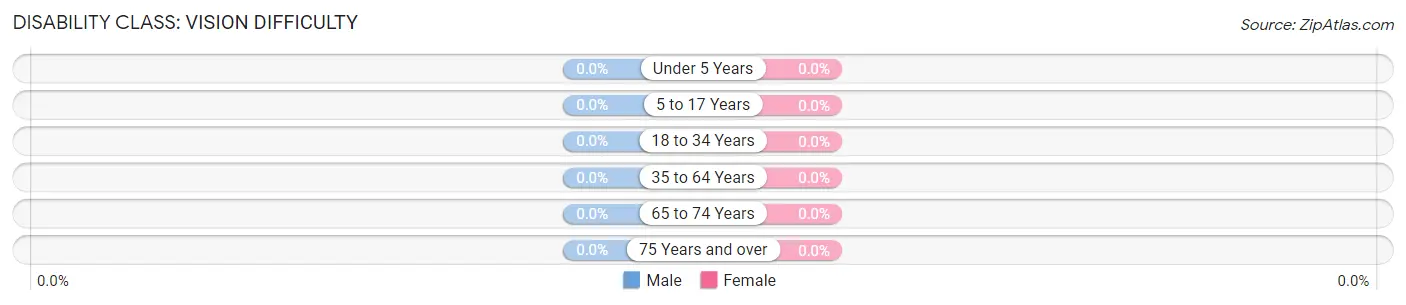
| Age Bracket | Male | Female |
| Under 5 Years | 0 (0.0%) | 0 (0.0%) |
| 5 to 17 Years | 0 (0.0%) | 0 (0.0%) |
| 18 to 34 Years | 0 (0.0%) | 0 (0.0%) |
| 35 to 64 Years | 0 (0.0%) | 0 (0.0%) |
| 65 to 74 Years | 0 (0.0%) | 0 (0.0%) |
| 75 Years and over | 0 (0.0%) | 0 (0.0%) |
Disability Class: Cognitive Difficulty
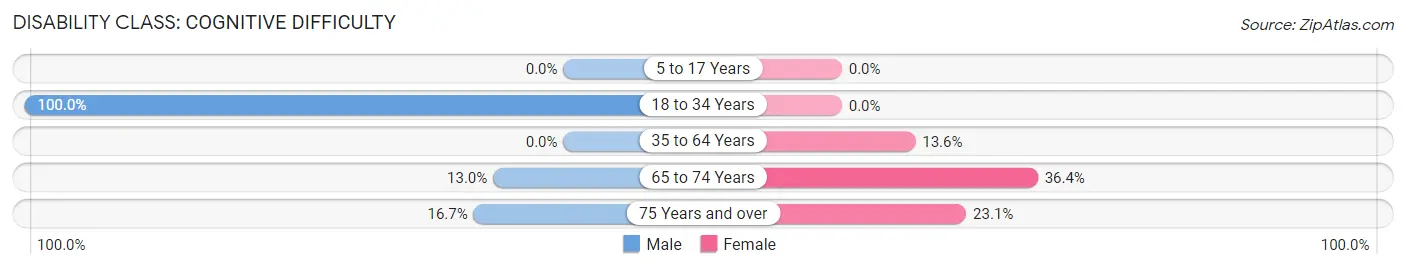
| Age Bracket | Male | Female |
| 5 to 17 Years | 0 (0.0%) | 0 (0.0%) |
| 18 to 34 Years | 5 (100.0%) | 0 (0.0%) |
| 35 to 64 Years | 0 (0.0%) | 6 (13.6%) |
| 65 to 74 Years | 6 (13.0%) | 4 (36.4%) |
| 75 Years and over | 2 (16.7%) | 6 (23.1%) |
Disability Class: Ambulatory Difficulty
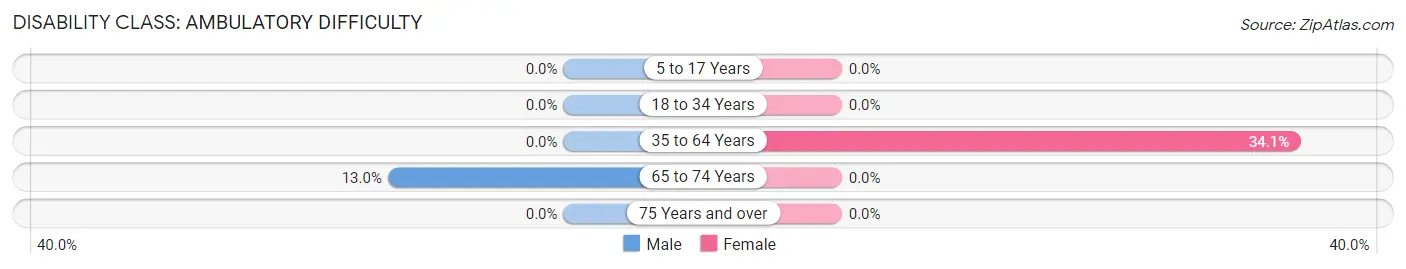
| Age Bracket | Male | Female |
| 5 to 17 Years | 0 (0.0%) | 0 (0.0%) |
| 18 to 34 Years | 0 (0.0%) | 0 (0.0%) |
| 35 to 64 Years | 0 (0.0%) | 15 (34.1%) |
| 65 to 74 Years | 6 (13.0%) | 0 (0.0%) |
| 75 Years and over | 0 (0.0%) | 0 (0.0%) |
Disability Class: Self-Care Difficulty
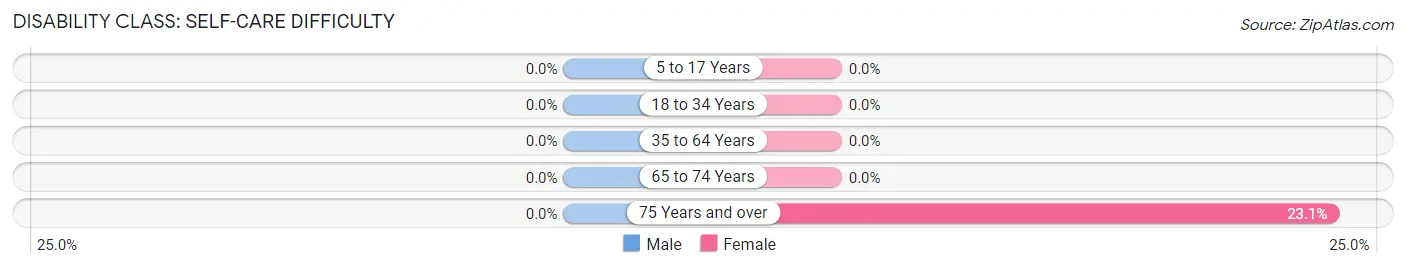
| Age Bracket | Male | Female |
| 5 to 17 Years | 0 (0.0%) | 0 (0.0%) |
| 18 to 34 Years | 0 (0.0%) | 0 (0.0%) |
| 35 to 64 Years | 0 (0.0%) | 0 (0.0%) |
| 65 to 74 Years | 0 (0.0%) | 0 (0.0%) |
| 75 Years and over | 0 (0.0%) | 6 (23.1%) |
Technology Access in Glendo
Computing Device Access in Glendo
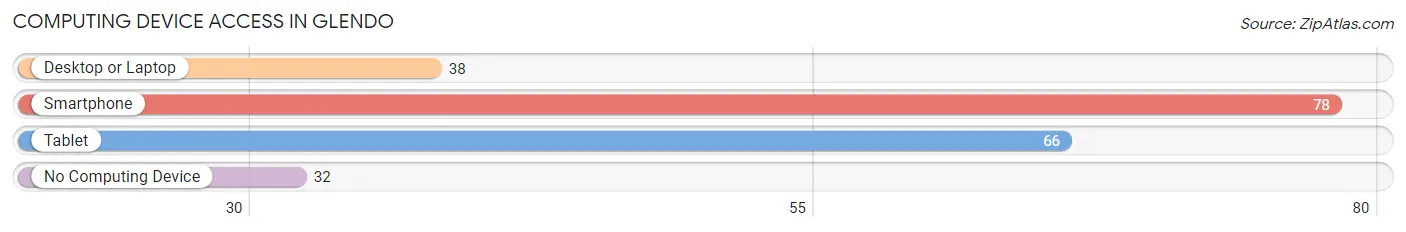
| Device Type | # Households | % Households |
| Desktop or Laptop | 38 | 32.8% |
| Smartphone | 78 | 67.2% |
| Tablet | 66 | 56.9% |
| No Computing Device | 32 | 27.6% |
| Total | 116 | 100.0% |
Internet Access in Glendo
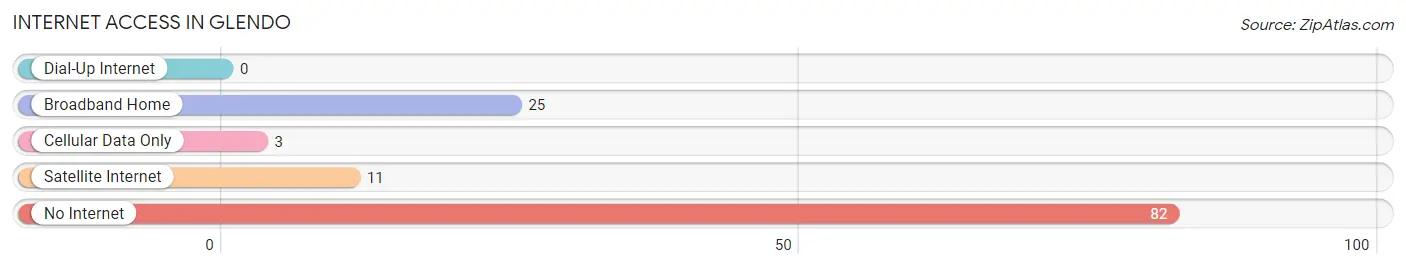
| Internet Type | # Households | % Households |
| Dial-Up Internet | 0 | 0.0% |
| Broadband Home | 25 | 21.5% |
| Cellular Data Only | 3 | 2.6% |
| Satellite Internet | 11 | 9.5% |
| No Internet | 82 | 70.7% |
| Total | 116 | 100.0% |
Glendo Summary
Glendo, Wyoming is a small town located in Platte County, Wyoming. It is situated on the North Platte River, approximately 40 miles east of Casper. The town was founded in 1882 and has a population of approximately 500 people.
Geography
Glendo is located in the high plains of Wyoming, at an elevation of 4,890 feet. The town is surrounded by rolling hills and grasslands, with the North Platte River running through the center of town. The climate is semi-arid, with hot summers and cold winters. The average annual precipitation is 13.5 inches.
Economy
The economy of Glendo is largely based on agriculture and tourism. The town is home to several farms and ranches, which produce hay, wheat, corn, and other crops. Tourism is also an important part of the local economy, with visitors coming to enjoy the area’s natural beauty and outdoor activities.
Demographics
As of the 2010 census, Glendo had a population of 498 people. The racial makeup of the town was 97.2% White, 0.2% African American, 0.4% Native American, 0.2% Asian, 0.2% from other races, and 1.9% from two or more races. Hispanic or Latino of any race were 1.2% of the population.
The median income for a household in Glendo was $37,500, and the median income for a family was $41,250. The per capita income for the town was $17,845. About 11.2% of families and 13.2% of the population were below the poverty line, including 16.7% of those under age 18 and none of those age 65 or over.
History
Glendo was founded in 1882 by a group of settlers from the Midwest. The town was named after the nearby Glendo Reservoir, which was created in the early 1900s. The town grew slowly, but steadily, and by the 1950s it had become a popular tourist destination.
In the late 1960s, the town was threatened by the construction of a dam on the North Platte River. The dam was eventually built, but the town was spared from flooding. In the 1970s, the town experienced a period of growth, as new businesses and industries moved into the area.
Today, Glendo is a small, quiet town with a strong sense of community. The town is home to several churches, a library, a museum, and a variety of shops and restaurants. The town is also home to a number of outdoor activities, including fishing, hunting, camping, and hiking. Glendo is a great place to live, work, and play.
Common Questions
What is Per Capita Income in Glendo?
Per Capita income in Glendo is $34,738.
What is the Median Family Income in Glendo?
Median Family Income in Glendo is $155,331.
What is Income or Wage Gap in Glendo?
Income or Wage Gap in Glendo is 59.1%.
Women in Glendo earn 40.9 cents for every dollar earned by a man.
What is Inequality or Gini Index in Glendo?
Inequality or Gini Index in Glendo is 0.48.
What is the Total Population of Glendo?
Total Population of Glendo is 209.
What is the Total Male Population of Glendo?
Total Male Population of Glendo is 108.
What is the Total Female Population of Glendo?
Total Female Population of Glendo is 101.
What is the Ratio of Males per 100 Females in Glendo?
There are 106.93 Males per 100 Females in Glendo.
What is the Ratio of Females per 100 Males in Glendo?
There are 93.52 Females per 100 Males in Glendo.
What is the Median Population Age in Glendo?
Median Population Age in Glendo is 61.4 Years.
What is the Average Family Size in Glendo
Average Family Size in Glendo is 2.3 People.
What is the Average Household Size in Glendo
Average Household Size in Glendo is 1.8 People.
How Large is the Labor Force in Glendo?
There are 95 People in the Labor Forcein in Glendo.
What is the Percentage of People in the Labor Force in Glendo?
48.7% of People are in the Labor Force in Glendo.
What is the Unemployment Rate in Glendo?
Unemployment Rate in Glendo is 4.2%.