Cokeville, WY Map & Demographics
Cokeville Map
Cokeville Overview
$30,193
PER CAPITA INCOME
$86,125
AVG FAMILY INCOME
$81,563
AVG HOUSEHOLD INCOME
0.35
INEQUALITY / GINI INDEX
423
TOTAL POPULATION
225
MALE POPULATION
198
FEMALE POPULATION
113.64
MALES / 100 FEMALES
88.00
FEMALES / 100 MALES
28.5
MEDIAN AGE
3.2
AVG FAMILY SIZE
2.9
AVG HOUSEHOLD SIZE
191
LABOR FORCE [ PEOPLE ]
62.2%
PERCENT IN LABOR FORCE
6.8%
UNEMPLOYMENT RATE
Cokeville Zip Codes
Cokeville Area Codes
Income in Cokeville
Income Overview in Cokeville
Per Capita Income in Cokeville is $30,193, while median incomes of families and households are $86,125 and $81,563 respectively.
| Characteristic | Number | Measure |
| Per Capita Income | 423 | $30,193 |
| Median Family Income | 119 | $86,125 |
| Mean Family Income | 119 | $98,655 |
| Median Household Income | 145 | $81,563 |
| Mean Household Income | 145 | $85,685 |
| Income Deficit | 119 | $0 |
| Wage / Income Gap (%) | 423 | 0.00% |
| Wage / Income Gap ($) | 423 | 100.00¢ per $1 |
| Gini / Inequality Index | 423 | 0.35 |
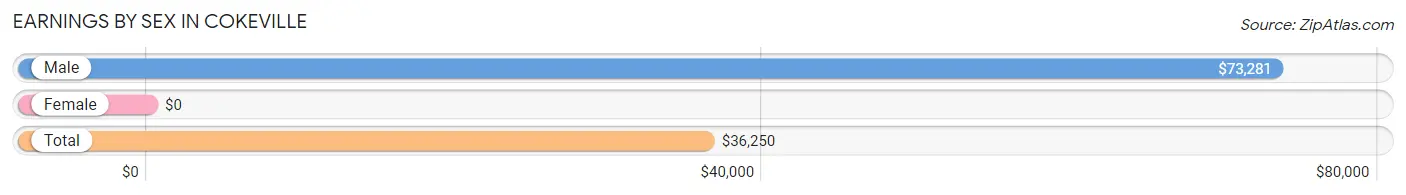
Earnings by Sex in Cokeville
| Sex | Number | Average Earnings |
| Male | 119 (52.4%) | $73,281 |
| Female | 108 (47.6%) | $0 |
| Total | 227 (100.0%) | $36,250 |
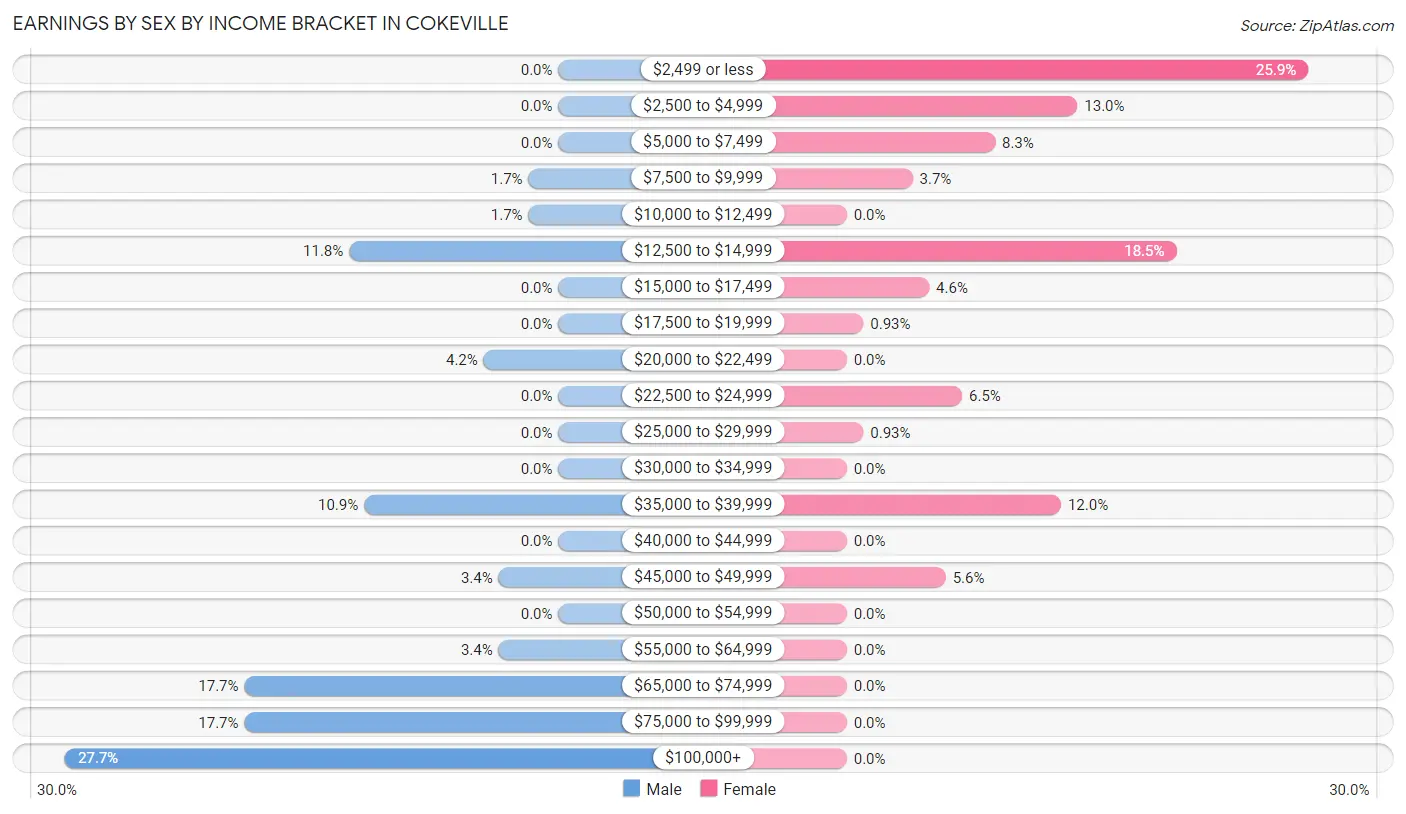
Earnings by Sex by Income Bracket in Cokeville
The most common earnings brackets in Cokeville are $100,000+ for men (33 | 27.7%) and $2,499 or less for women (28 | 25.9%).
| Income | Male | Female |
| $2,499 or less | 0 (0.0%) | 28 (25.9%) |
| $2,500 to $4,999 | 0 (0.0%) | 14 (13.0%) |
| $5,000 to $7,499 | 0 (0.0%) | 9 (8.3%) |
| $7,500 to $9,999 | 2 (1.7%) | 4 (3.7%) |
| $10,000 to $12,499 | 2 (1.7%) | 0 (0.0%) |
| $12,500 to $14,999 | 14 (11.8%) | 20 (18.5%) |
| $15,000 to $17,499 | 0 (0.0%) | 5 (4.6%) |
| $17,500 to $19,999 | 0 (0.0%) | 1 (0.9%) |
| $20,000 to $22,499 | 5 (4.2%) | 0 (0.0%) |
| $22,500 to $24,999 | 0 (0.0%) | 7 (6.5%) |
| $25,000 to $29,999 | 0 (0.0%) | 1 (0.9%) |
| $30,000 to $34,999 | 0 (0.0%) | 0 (0.0%) |
| $35,000 to $39,999 | 13 (10.9%) | 13 (12.0%) |
| $40,000 to $44,999 | 0 (0.0%) | 0 (0.0%) |
| $45,000 to $49,999 | 4 (3.4%) | 6 (5.6%) |
| $50,000 to $54,999 | 0 (0.0%) | 0 (0.0%) |
| $55,000 to $64,999 | 4 (3.4%) | 0 (0.0%) |
| $65,000 to $74,999 | 21 (17.6%) | 0 (0.0%) |
| $75,000 to $99,999 | 21 (17.6%) | 0 (0.0%) |
| $100,000+ | 33 (27.7%) | 0 (0.0%) |
| Total | 119 (100.0%) | 108 (100.0%) |
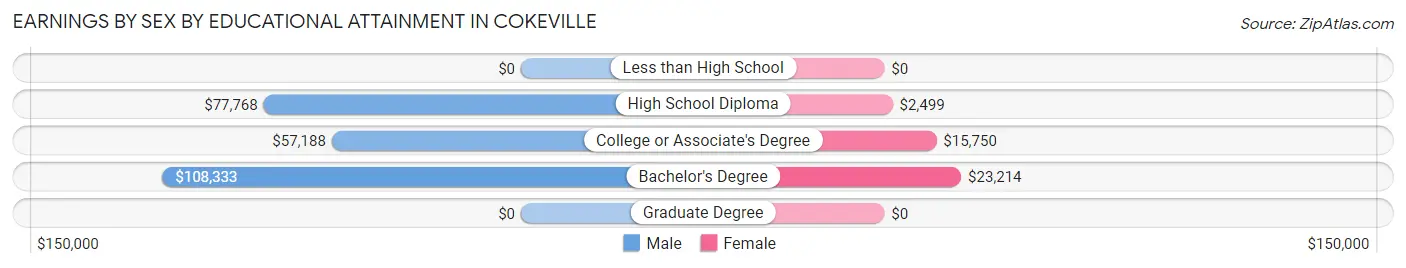
Earnings by Sex by Educational Attainment in Cokeville
Average earnings in Cokeville are $75,000 for men and $14,375 for women, a difference of 80.8%. Men with an educational attainment of bachelor's degree enjoy the highest average annual earnings of $108,333, while those with college or associate's degree education earn the least with $57,188. Women with an educational attainment of bachelor's degree earn the most with the average annual earnings of $23,214, while those with high school diploma education have the smallest earnings of $2,499.
| Educational Attainment | Male Income | Female Income |
| Less than High School | - | - |
| High School Diploma | $77,768 | $2,499 |
| College or Associate's Degree | $57,188 | $15,750 |
| Bachelor's Degree | $108,333 | $23,214 |
| Graduate Degree | - | - |
| Total | $75,000 | $14,375 |
Family Income in Cokeville
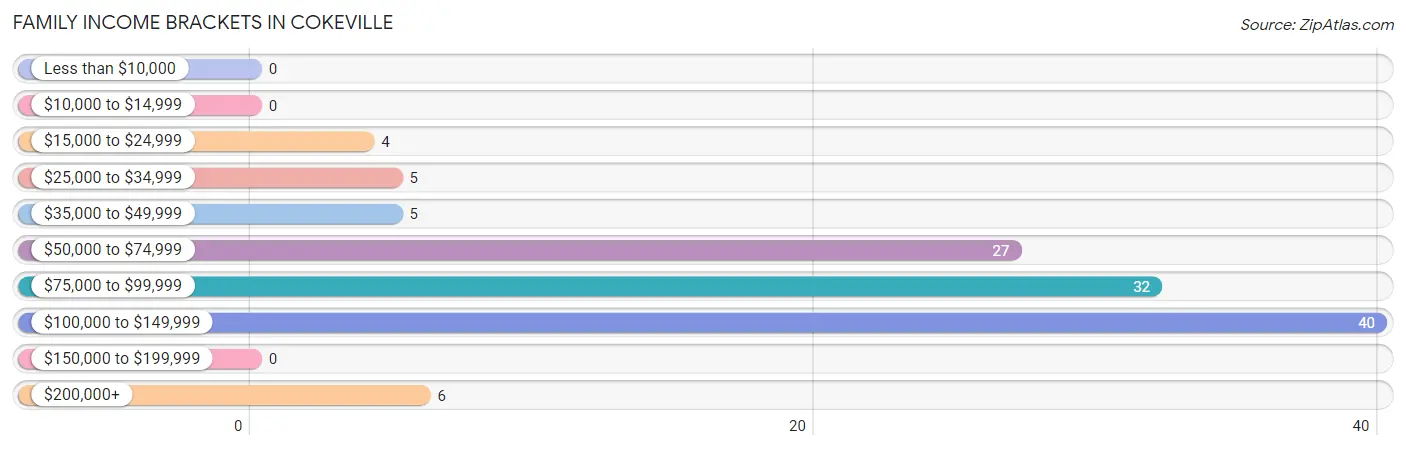
Family Income Brackets in Cokeville
According to the Cokeville family income data, there are 40 families falling into the $100,000 to $149,999 income range, which is the most common income bracket and makes up 33.6% of all families.
| Income Bracket | # Families | % Families |
| Less than $10,000 | 0 | 0.0% |
| $10,000 to $14,999 | 0 | 0.0% |
| $15,000 to $24,999 | 4 | 3.4% |
| $25,000 to $34,999 | 5 | 4.2% |
| $35,000 to $49,999 | 5 | 4.2% |
| $50,000 to $74,999 | 27 | 22.7% |
| $75,000 to $99,999 | 32 | 26.9% |
| $100,000 to $149,999 | 40 | 33.6% |
| $150,000 to $199,999 | 0 | 0.0% |
| $200,000+ | 6 | 5.0% |
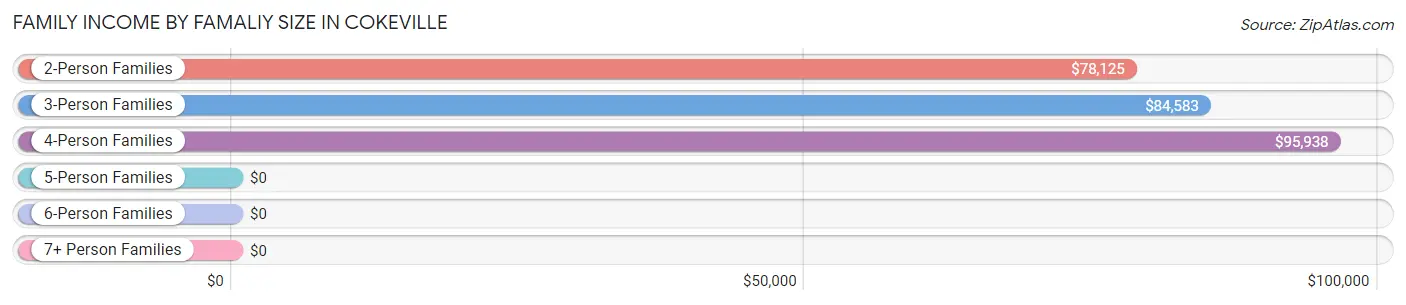
Family Income by Famaliy Size in Cokeville
4-person families (27 | 22.7%) account for the highest median family income in Cokeville with $95,938 per family, while 2-person families (52 | 43.7%) have the highest median income of $39,062 per family member.
| Income Bracket | # Families | Median Income |
| 2-Person Families | 52 (43.7%) | $78,125 |
| 3-Person Families | 20 (16.8%) | $84,583 |
| 4-Person Families | 27 (22.7%) | $95,938 |
| 5-Person Families | 11 (9.2%) | $0 |
| 6-Person Families | 4 (3.4%) | $0 |
| 7+ Person Families | 5 (4.2%) | $0 |
| Total | 119 (100.0%) | $86,125 |
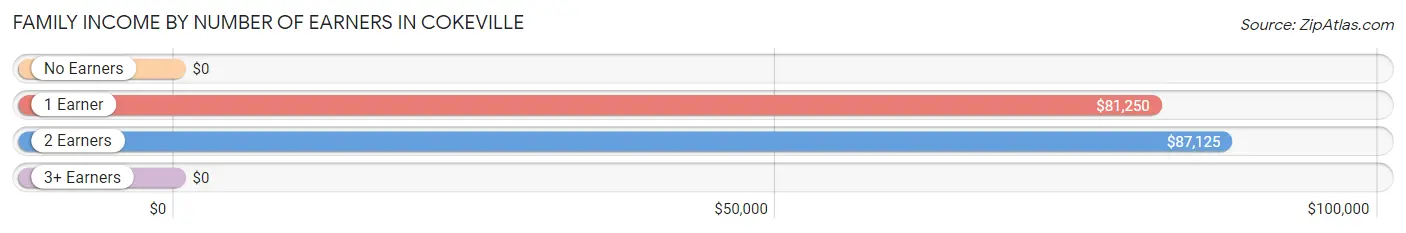
Family Income by Number of Earners in Cokeville
| Number of Earners | # Families | Median Income |
| No Earners | 10 (8.4%) | $0 |
| 1 Earner | 36 (30.2%) | $81,250 |
| 2 Earners | 67 (56.3%) | $87,125 |
| 3+ Earners | 6 (5.0%) | $0 |
| Total | 119 (100.0%) | $86,125 |
Household Income in Cokeville
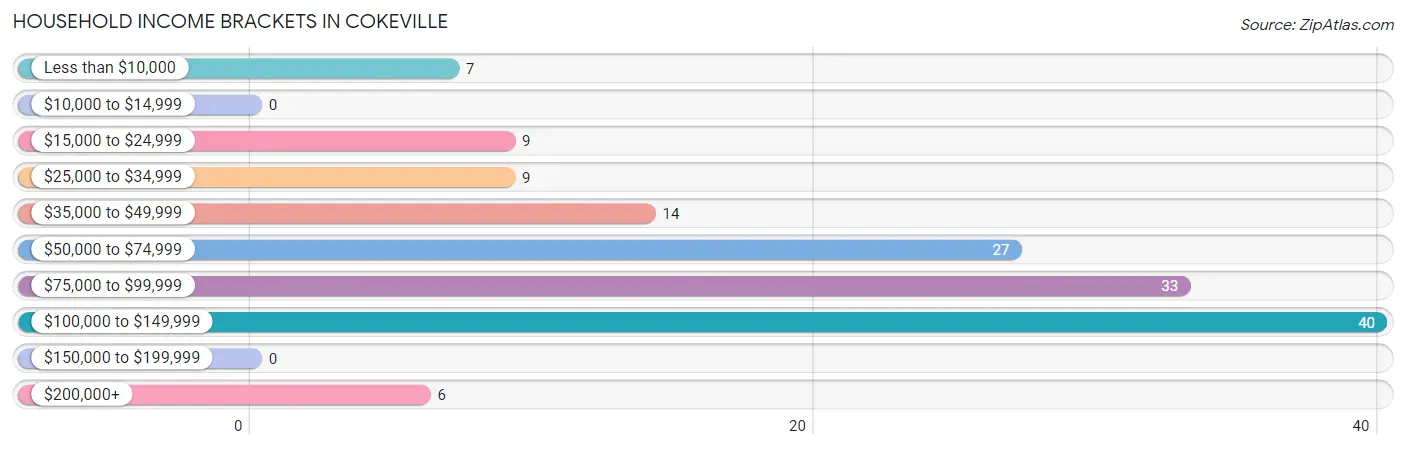
Household Income Brackets in Cokeville
With 40 households falling in the category, the $100,000 to $149,999 income range is the most frequent in Cokeville, accounting for 27.6% of all households.
| Income Bracket | # Households | % Households |
| Less than $10,000 | 7 | 4.8% |
| $10,000 to $14,999 | 0 | 0.0% |
| $15,000 to $24,999 | 9 | 6.2% |
| $25,000 to $34,999 | 9 | 6.2% |
| $35,000 to $49,999 | 14 | 9.7% |
| $50,000 to $74,999 | 27 | 18.6% |
| $75,000 to $99,999 | 33 | 22.8% |
| $100,000 to $149,999 | 40 | 27.6% |
| $150,000 to $199,999 | 0 | 0.0% |
| $200,000+ | 6 | 4.1% |
Household Income by Householder Age in Cokeville
The median household income in Cokeville is $81,563, with the highest median household income of $95,313 found in the 45 to 64 years age bracket for the primary householder. A total of 33 households (22.8%) fall into this category. Meanwhile, the 15 to 24 years age bracket for the primary householder has the lowest median household income of $0, with 11 households (7.6%) in this group.
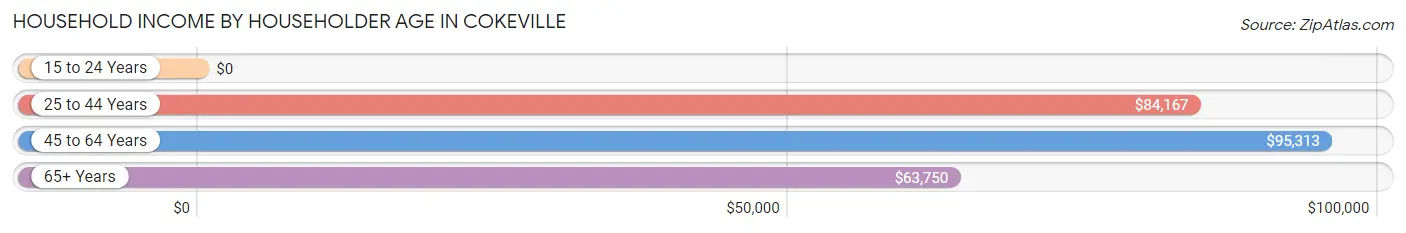
| Income Bracket | # Households | Median Income |
| 15 to 24 Years | 11 (7.6%) | $0 |
| 25 to 44 Years | 48 (33.1%) | $84,167 |
| 45 to 64 Years | 33 (22.8%) | $95,313 |
| 65+ Years | 53 (36.5%) | $63,750 |
| Total | 145 (100.0%) | $81,563 |
Poverty in Cokeville
Income Below Poverty by Sex and Age in Cokeville
With 8.8% poverty level for males and 4.5% for females among the residents of Cokeville, 15 year old males and 65 to 74 year old females are the most vulnerable to poverty, with 7 males (58.3%) and 5 females (55.6%) in their respective age groups living below the poverty level.
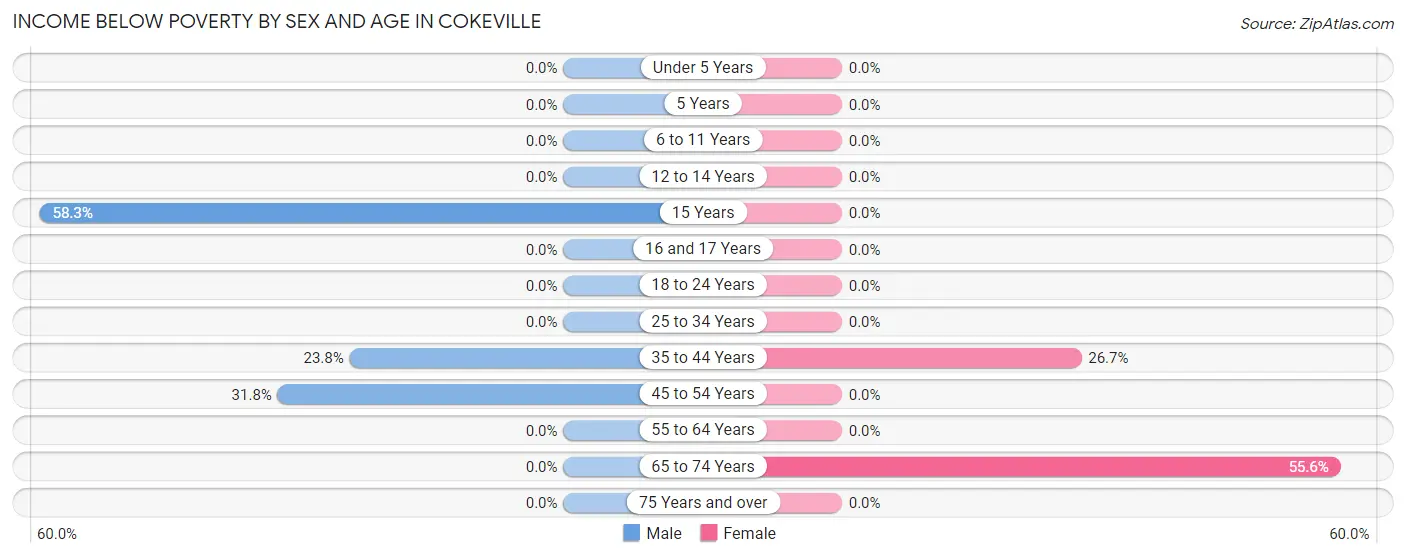
| Age Bracket | Male | Female |
| Under 5 Years | 0 (0.0%) | 0 (0.0%) |
| 5 Years | 0 (0.0%) | 0 (0.0%) |
| 6 to 11 Years | 0 (0.0%) | 0 (0.0%) |
| 12 to 14 Years | 0 (0.0%) | 0 (0.0%) |
| 15 Years | 7 (58.3%) | 0 (0.0%) |
| 16 and 17 Years | 0 (0.0%) | 0 (0.0%) |
| 18 to 24 Years | 0 (0.0%) | 0 (0.0%) |
| 25 to 34 Years | 0 (0.0%) | 0 (0.0%) |
| 35 to 44 Years | 5 (23.8%) | 4 (26.7%) |
| 45 to 54 Years | 7 (31.8%) | 0 (0.0%) |
| 55 to 64 Years | 0 (0.0%) | 0 (0.0%) |
| 65 to 74 Years | 0 (0.0%) | 5 (55.6%) |
| 75 Years and over | 0 (0.0%) | 0 (0.0%) |
| Total | 19 (8.8%) | 9 (4.5%) |
Income Above Poverty by Sex and Age in Cokeville
According to the poverty statistics in Cokeville, males aged under 5 years and females aged under 5 years are the age groups that are most secure financially, with 100.0% of males and 100.0% of females in these age groups living above the poverty line.
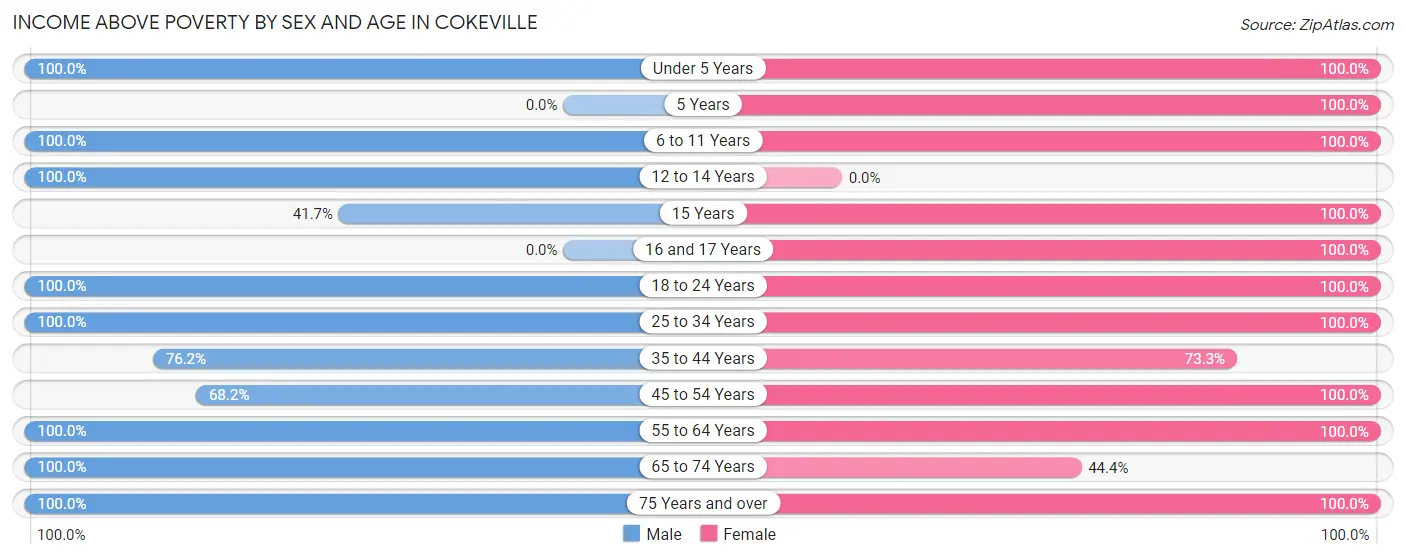
| Age Bracket | Male | Female |
| Under 5 Years | 30 (100.0%) | 25 (100.0%) |
| 5 Years | 0 (0.0%) | 1 (100.0%) |
| 6 to 11 Years | 21 (100.0%) | 10 (100.0%) |
| 12 to 14 Years | 4 (100.0%) | 0 (0.0%) |
| 15 Years | 5 (41.7%) | 4 (100.0%) |
| 16 and 17 Years | 0 (0.0%) | 5 (100.0%) |
| 18 to 24 Years | 33 (100.0%) | 29 (100.0%) |
| 25 to 34 Years | 34 (100.0%) | 29 (100.0%) |
| 35 to 44 Years | 16 (76.2%) | 11 (73.3%) |
| 45 to 54 Years | 15 (68.2%) | 32 (100.0%) |
| 55 to 64 Years | 7 (100.0%) | 20 (100.0%) |
| 65 to 74 Years | 25 (100.0%) | 4 (44.4%) |
| 75 Years and over | 7 (100.0%) | 19 (100.0%) |
| Total | 197 (91.2%) | 189 (95.5%) |
Income Below Poverty Among Married-Couple Families in Cokeville
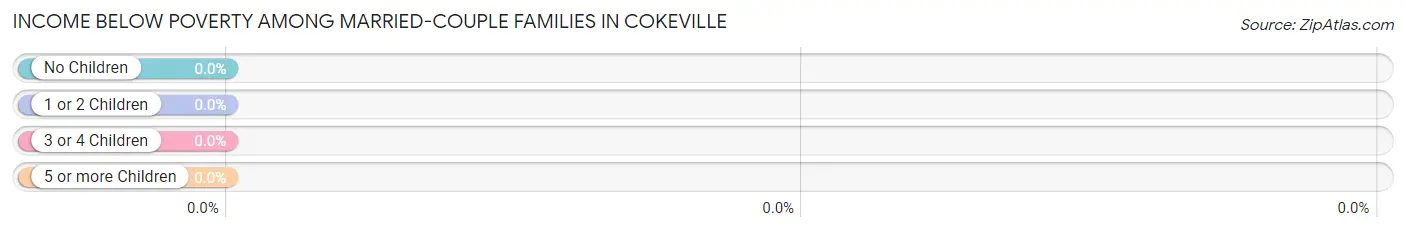
| Children | Above Poverty | Below Poverty |
| No Children | 56 (100.0%) | 0 (0.0%) |
| 1 or 2 Children | 38 (100.0%) | 0 (0.0%) |
| 3 or 4 Children | 15 (100.0%) | 0 (0.0%) |
| 5 or more Children | 0 (0.0%) | 0 (0.0%) |
| Total | 109 (100.0%) | 0 (0.0%) |
Income Below Poverty Among Single-Parent Households in Cokeville
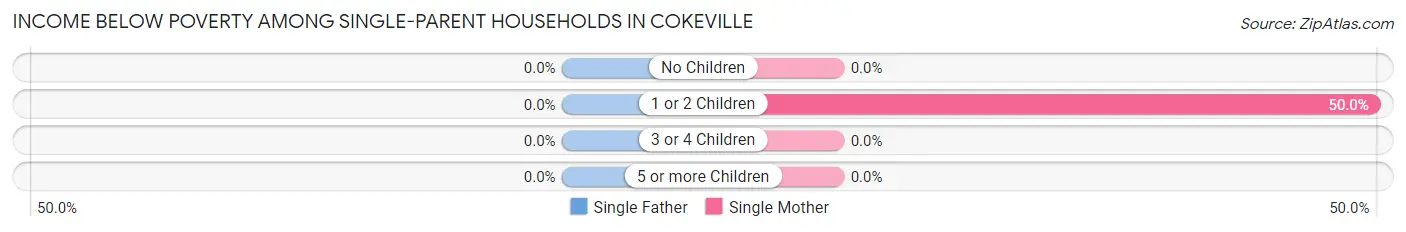
| Children | Single Father | Single Mother |
| No Children | 0 (0.0%) | 0 (0.0%) |
| 1 or 2 Children | 0 (0.0%) | 5 (50.0%) |
| 3 or 4 Children | 0 (0.0%) | 0 (0.0%) |
| 5 or more Children | 0 (0.0%) | 0 (0.0%) |
| Total | 0 (0.0%) | 5 (50.0%) |
Income Below Poverty Among Married-Couple vs Single-Parent Households in Cokeville
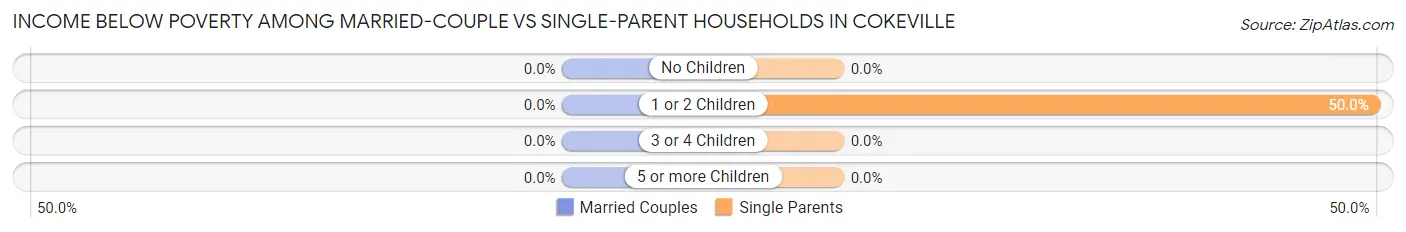
| Children | Married-Couple Families | Single-Parent Households |
| No Children | 0 (0.0%) | 0 (0.0%) |
| 1 or 2 Children | 0 (0.0%) | 5 (50.0%) |
| 3 or 4 Children | 0 (0.0%) | 0 (0.0%) |
| 5 or more Children | 0 (0.0%) | 0 (0.0%) |
| Total | 0 (0.0%) | 5 (50.0%) |
Race in Cokeville
The most populous races in Cokeville are White / Caucasian (418 | 98.8%), Asian (2 | 0.5%), and Native / Alaskan (2 | 0.5%).
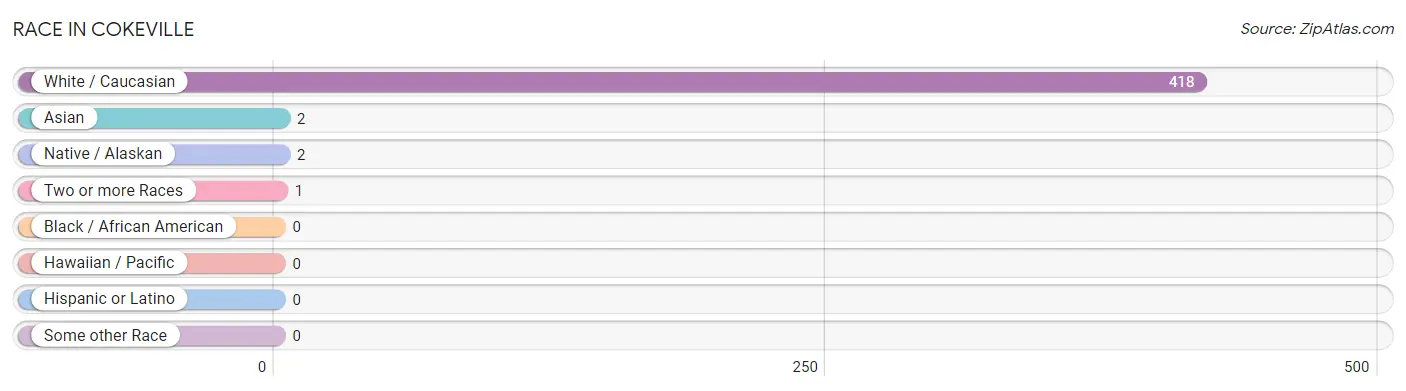
| Race | # Population | % Population |
| Asian | 2 | 0.5% |
| Black / African American | 0 | 0.0% |
| Hawaiian / Pacific | 0 | 0.0% |
| Hispanic or Latino | 0 | 0.0% |
| Native / Alaskan | 2 | 0.5% |
| White / Caucasian | 418 | 98.8% |
| Two or more Races | 1 | 0.2% |
| Some other Race | 0 | 0.0% |
| Total | 423 | 100.0% |
Ancestry in Cokeville
The most populous ancestries reported in Cokeville are English (124 | 29.3%), German (120 | 28.4%), American (52 | 12.3%), Swedish (30 | 7.1%), and Danish (18 | 4.3%), together accounting for 81.3% of all Cokeville residents.
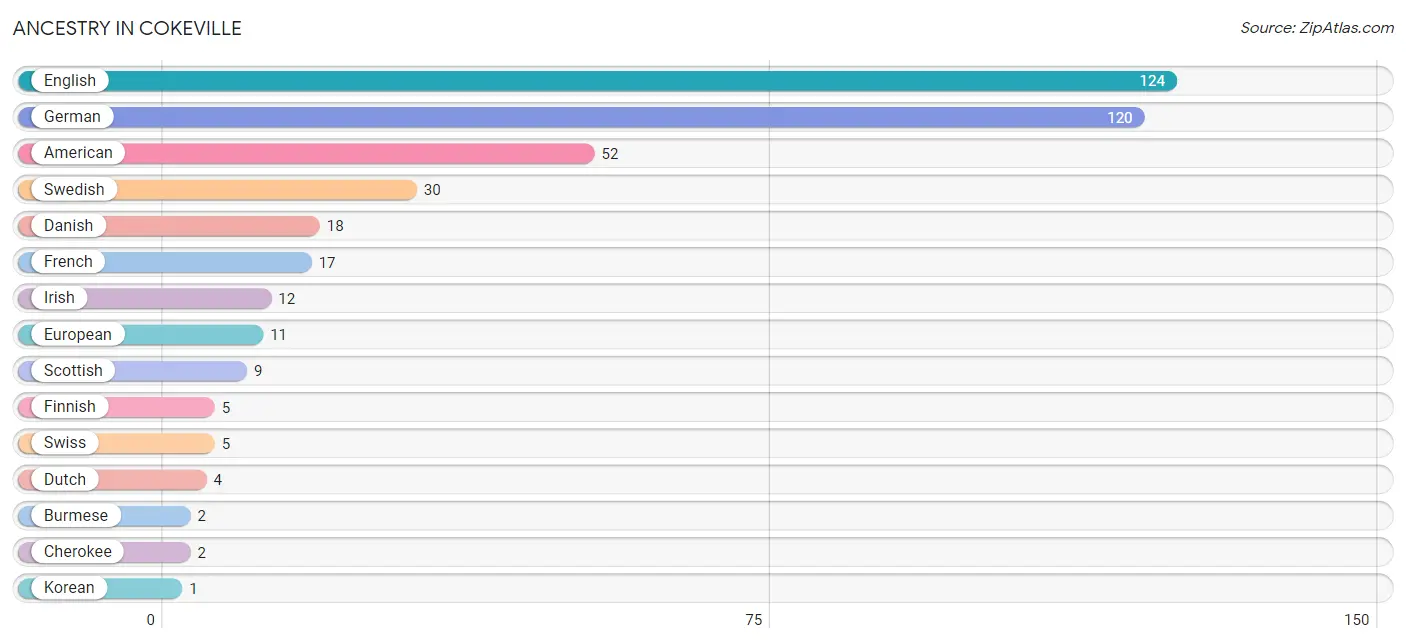
| Ancestry | # Population | % Population |
| American | 52 | 12.3% |
| Burmese | 2 | 0.5% |
| Cherokee | 2 | 0.5% |
| Danish | 18 | 4.3% |
| Dutch | 4 | 0.9% |
| English | 124 | 29.3% |
| European | 11 | 2.6% |
| Finnish | 5 | 1.2% |
| French | 17 | 4.0% |
| German | 120 | 28.4% |
| Irish | 12 | 2.8% |
| Korean | 1 | 0.2% |
| Scottish | 9 | 2.1% |
| Swedish | 30 | 7.1% |
| Swiss | 5 | 1.2% | View All 15 Rows |
Immigrants in Cokeville
The most numerous immigrant groups reported in Cokeville came from Asia (1 | 0.2%), Eastern Asia (1 | 0.2%), and Korea (1 | 0.2%), together accounting for 0.7% of all Cokeville residents.
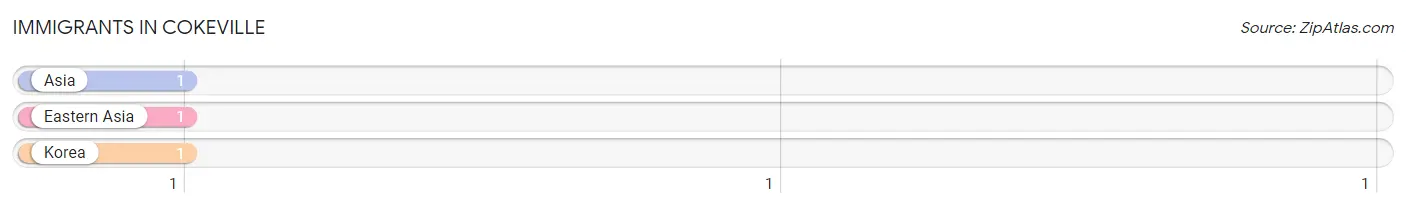
| Immigration Origin | # Population | % Population |
| Asia | 1 | 0.2% |
| Eastern Asia | 1 | 0.2% |
| Korea | 1 | 0.2% | View All 3 Rows |
Sex and Age in Cokeville
Sex and Age in Cokeville
The most populous age groups in Cokeville are Under 5 Years (39 | 17.3%) for men and 45 to 49 Years (28 | 14.1%) for women.
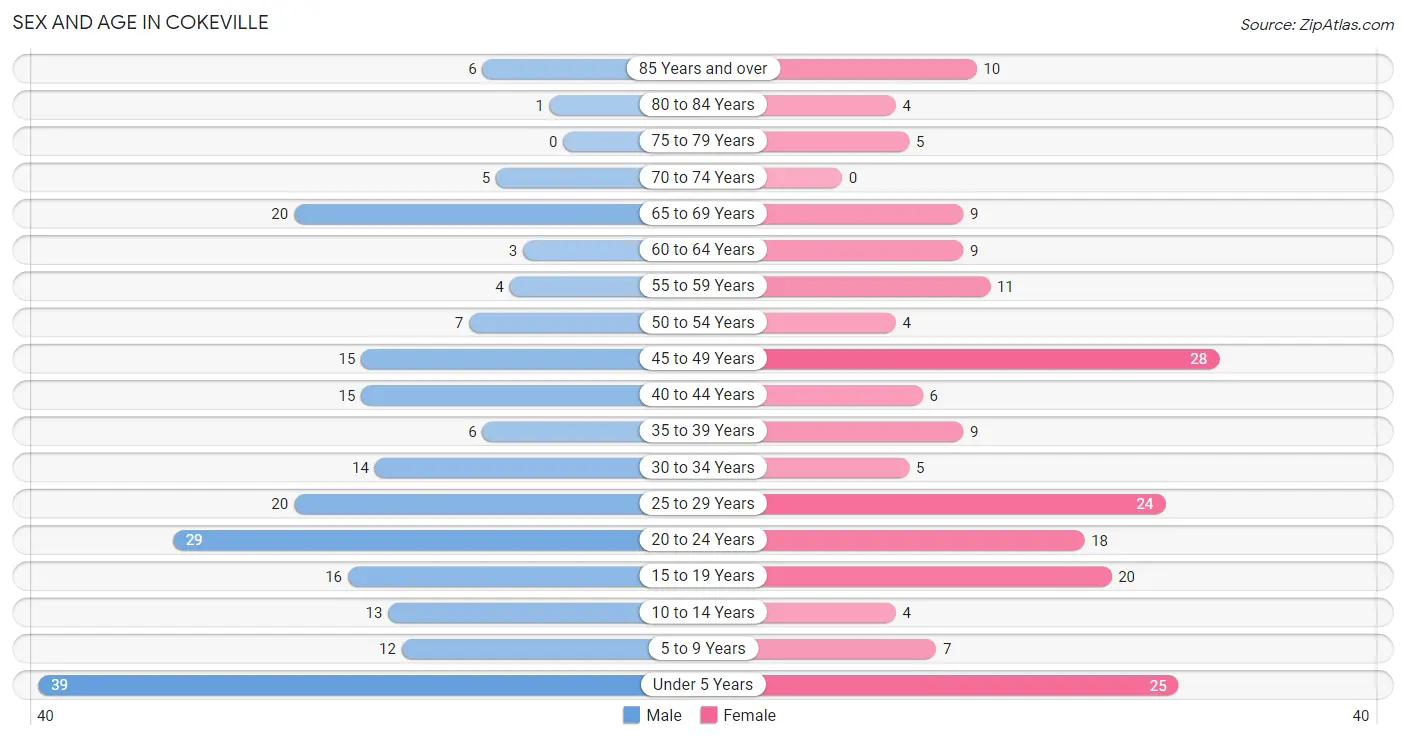
| Age Bracket | Male | Female |
| Under 5 Years | 39 (17.3%) | 25 (12.6%) |
| 5 to 9 Years | 12 (5.3%) | 7 (3.5%) |
| 10 to 14 Years | 13 (5.8%) | 4 (2.0%) |
| 15 to 19 Years | 16 (7.1%) | 20 (10.1%) |
| 20 to 24 Years | 29 (12.9%) | 18 (9.1%) |
| 25 to 29 Years | 20 (8.9%) | 24 (12.1%) |
| 30 to 34 Years | 14 (6.2%) | 5 (2.5%) |
| 35 to 39 Years | 6 (2.7%) | 9 (4.5%) |
| 40 to 44 Years | 15 (6.7%) | 6 (3.0%) |
| 45 to 49 Years | 15 (6.7%) | 28 (14.1%) |
| 50 to 54 Years | 7 (3.1%) | 4 (2.0%) |
| 55 to 59 Years | 4 (1.8%) | 11 (5.6%) |
| 60 to 64 Years | 3 (1.3%) | 9 (4.5%) |
| 65 to 69 Years | 20 (8.9%) | 9 (4.5%) |
| 70 to 74 Years | 5 (2.2%) | 0 (0.0%) |
| 75 to 79 Years | 0 (0.0%) | 5 (2.5%) |
| 80 to 84 Years | 1 (0.4%) | 4 (2.0%) |
| 85 Years and over | 6 (2.7%) | 10 (5.1%) |
| Total | 225 (100.0%) | 198 (100.0%) |
Families and Households in Cokeville
Median Family Size in Cokeville
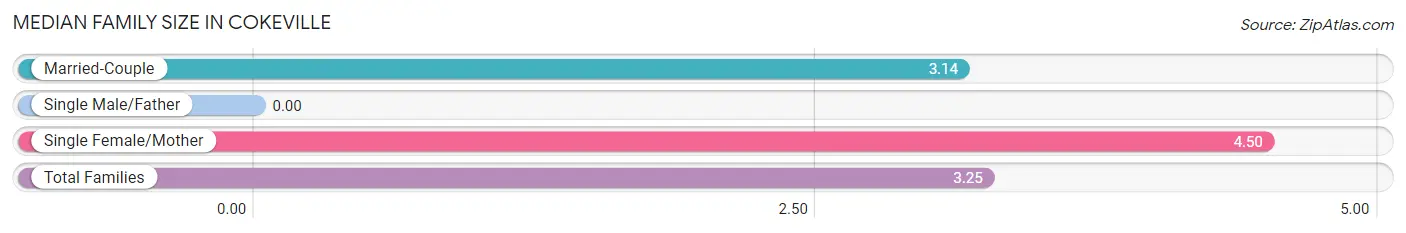
| Family Type | # Families | Family Size |
| Married-Couple | 109 (91.6%) | 3.14 |
| Single Male/Father | 0 (0.0%) | - |
| Single Female/Mother | 10 (8.4%) | 4.50 |
| Total Families | 119 (100.0%) | 3.25 |
Median Household Size in Cokeville
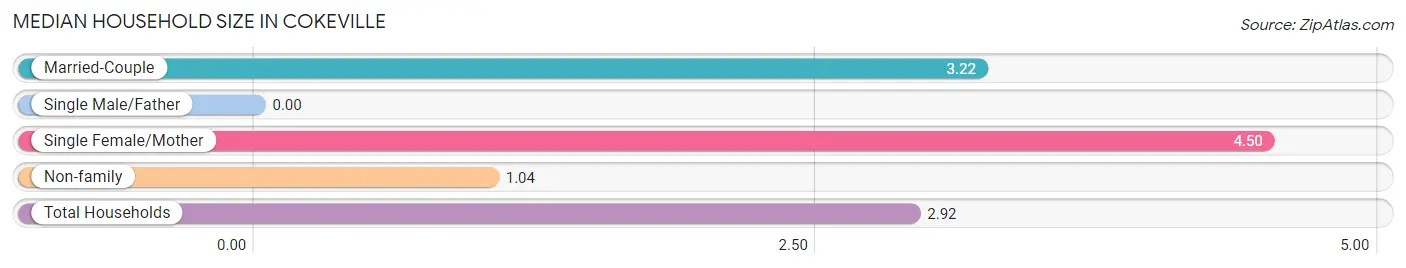
| Household Type | # Households | Household Size |
| Married-Couple | 109 (75.2%) | 3.22 |
| Single Male/Father | 0 (0.0%) | - |
| Single Female/Mother | 10 (6.9%) | 4.50 |
| Non-family | 26 (17.9%) | 1.04 |
| Total Households | 145 (100.0%) | 2.92 |
Household Size by Marriage Status in Cokeville
Out of a total of 145 households in Cokeville, 119 (82.1%) are family households, while 26 (17.9%) are nonfamily households. The most numerous type of family households are 2-person households, comprising 52, and the most common type of nonfamily households are 1-person households, comprising 25.
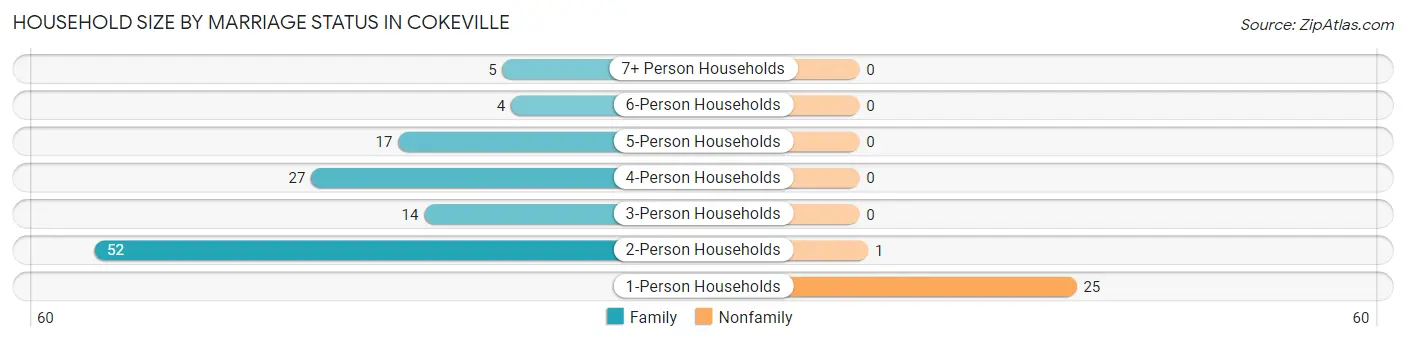
| Household Size | Family Households | Nonfamily Households |
| 1-Person Households | - | 25 (17.2%) |
| 2-Person Households | 52 (35.9%) | 1 (0.7%) |
| 3-Person Households | 14 (9.7%) | 0 (0.0%) |
| 4-Person Households | 27 (18.6%) | 0 (0.0%) |
| 5-Person Households | 17 (11.7%) | 0 (0.0%) |
| 6-Person Households | 4 (2.8%) | 0 (0.0%) |
| 7+ Person Households | 5 (3.5%) | 0 (0.0%) |
| Total | 119 (82.1%) | 26 (17.9%) |
Female Fertility in Cokeville
Fertility by Age in Cokeville
Average fertility rate in Cokeville is 123.0 births per 1,000 women. Women in the age bracket of 20 to 34 years have the highest fertility rate with 298.0 births per 1,000 women. Women in the age bracket of 20 to 34 years acount for 100.0% of all women with births.
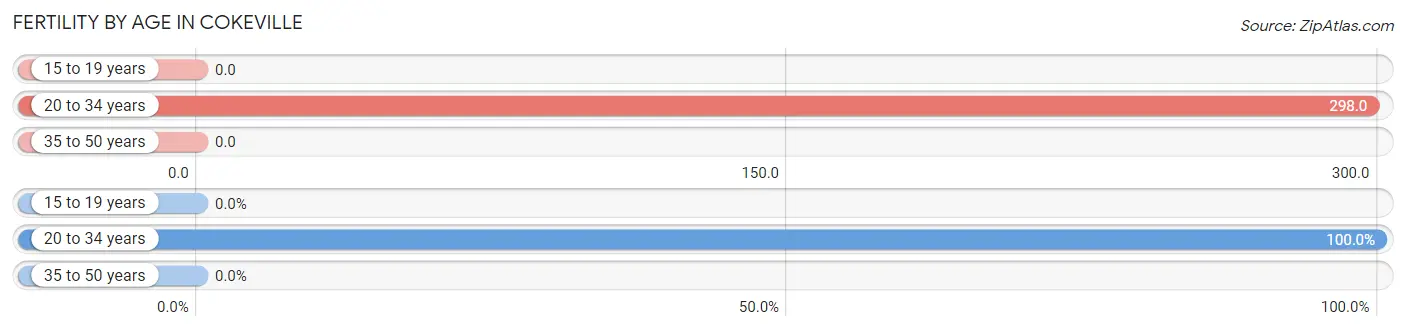
| Age Bracket | Women with Births | Births / 1,000 Women |
| 15 to 19 years | 0 (0.0%) | 0.0 |
| 20 to 34 years | 14 (100.0%) | 298.0 |
| 35 to 50 years | 0 (0.0%) | 0.0 |
| Total | 14 (100.0%) | 123.0 |
Fertility by Age by Marriage Status in Cokeville
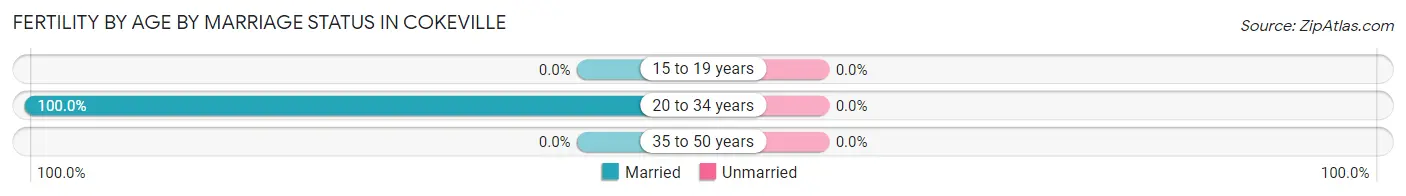
| Age Bracket | Married | Unmarried |
| 15 to 19 years | 0 (0.0%) | 0 (0.0%) |
| 20 to 34 years | 14 (100.0%) | 0 (0.0%) |
| 35 to 50 years | 0 (0.0%) | 0 (0.0%) |
| Total | 14 (100.0%) | 0 (0.0%) |
Fertility by Education in Cokeville
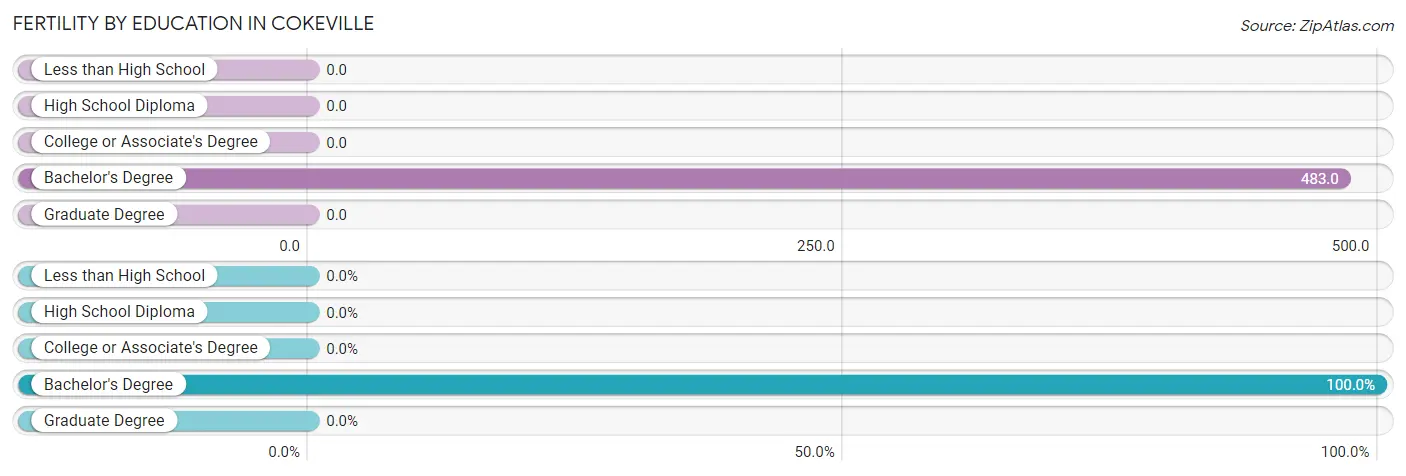
| Educational Attainment | Women with Births | Births / 1,000 Women |
| Less than High School | 0 (0.0%) | 0.0 |
| High School Diploma | 0 (0.0%) | 0.0 |
| College or Associate's Degree | 0 (0.0%) | 0.0 |
| Bachelor's Degree | 14 (100.0%) | 483.0 |
| Graduate Degree | 0 (0.0%) | 0.0 |
| Total | 14 (100.0%) | 123.0 |
Fertility by Education by Marriage Status in Cokeville
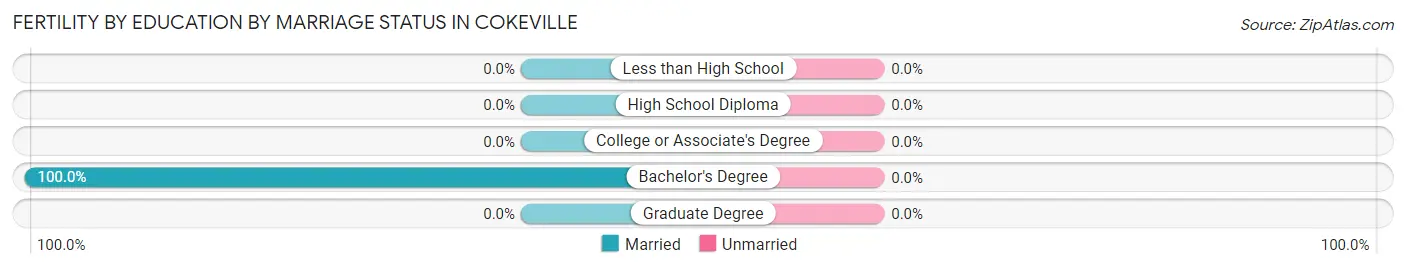
| Educational Attainment | Married | Unmarried |
| Less than High School | 0 (0.0%) | 0 (0.0%) |
| High School Diploma | 0 (0.0%) | 0 (0.0%) |
| College or Associate's Degree | 0 (0.0%) | 0 (0.0%) |
| Bachelor's Degree | 14 (100.0%) | 0 (0.0%) |
| Graduate Degree | 0 (0.0%) | 0 (0.0%) |
| Total | 14 (100.0%) | 0 (0.0%) |
Employment Characteristics in Cokeville
Employment by Class of Employer in Cokeville
Among the 173 employed individuals in Cokeville, private company employees (96 | 55.5%), local government employees (30 | 17.3%), and state government employees (22 | 12.7%) make up the most common classes of employment.
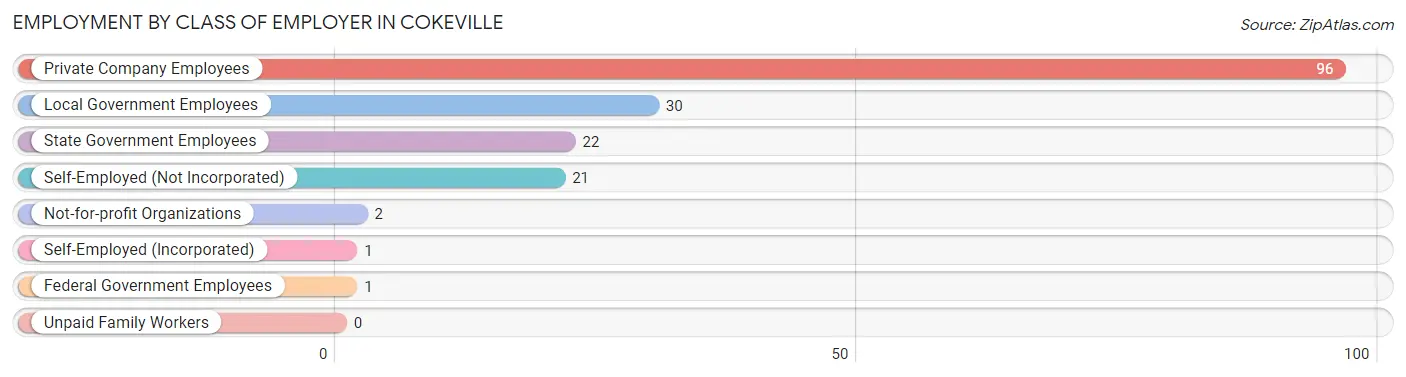
| Employer Class | # Employees | % Employees |
| Private Company Employees | 96 | 55.5% |
| Self-Employed (Incorporated) | 1 | 0.6% |
| Self-Employed (Not Incorporated) | 21 | 12.1% |
| Not-for-profit Organizations | 2 | 1.2% |
| Local Government Employees | 30 | 17.3% |
| State Government Employees | 22 | 12.7% |
| Federal Government Employees | 1 | 0.6% |
| Unpaid Family Workers | 0 | 0.0% |
| Total | 173 | 100.0% |
Employment Status by Age in Cokeville
According to the labor force statistics for Cokeville, out of the total population over 16 years of age (307), 62.2% or 191 individuals are in the labor force, with 6.8% or 13 of them unemployed. The age group with the highest labor force participation rate is 30 to 34 years, with 100.0% or 19 individuals in the labor force. Within the labor force, the 55 to 59 years age range has the highest percentage of unemployed individuals, with 81.8% or 9 of them being unemployed.
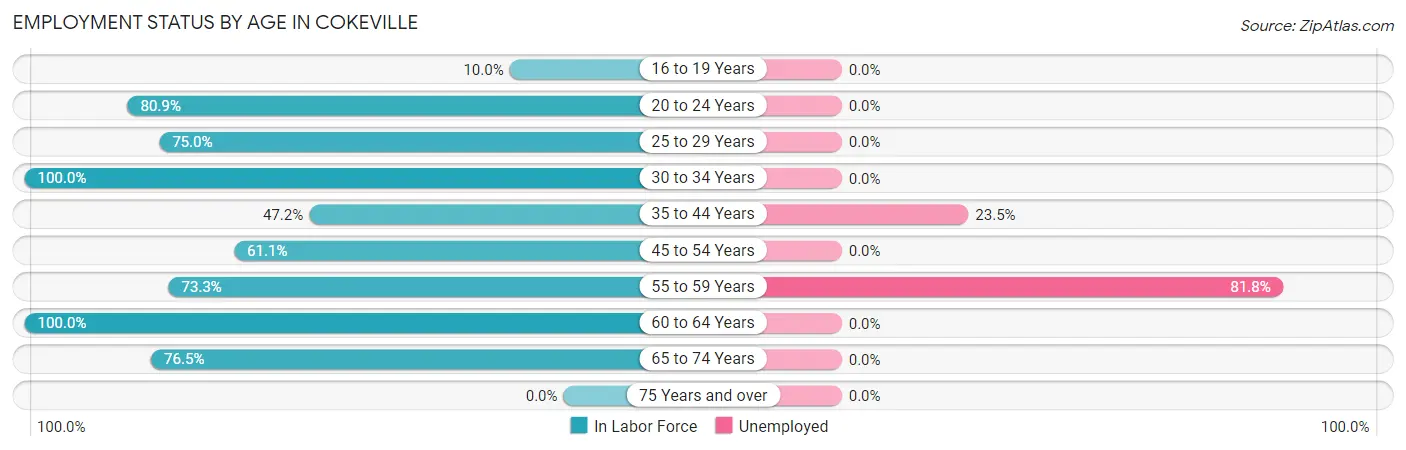
| Age Bracket | In Labor Force | Unemployed |
| 16 to 19 Years | 2 (10.0%) | 0 (0.0%) |
| 20 to 24 Years | 38 (80.9%) | 0 (0.0%) |
| 25 to 29 Years | 33 (75.0%) | 0 (0.0%) |
| 30 to 34 Years | 19 (100.0%) | 0 (0.0%) |
| 35 to 44 Years | 17 (47.2%) | 4 (23.5%) |
| 45 to 54 Years | 33 (61.1%) | 0 (0.0%) |
| 55 to 59 Years | 11 (73.3%) | 9 (81.8%) |
| 60 to 64 Years | 12 (100.0%) | 0 (0.0%) |
| 65 to 74 Years | 26 (76.5%) | 0 (0.0%) |
| 75 Years and over | 0 (0.0%) | 0 (0.0%) |
| Total | 191 (62.2%) | 13 (6.8%) |
Employment Status by Educational Attainment in Cokeville
According to labor force statistics for Cokeville, 69.4% of individuals (125) out of the total population between 25 and 64 years of age (180) are in the labor force, with 10.4% or 13 of them being unemployed. The group with the highest labor force participation rate are those with the educational attainment of less than high school, with 100.0% or 4 individuals in the labor force. Within the labor force, individuals with less than high school education have the highest percentage of unemployment, with 100.0% or 4 of them being unemployed.
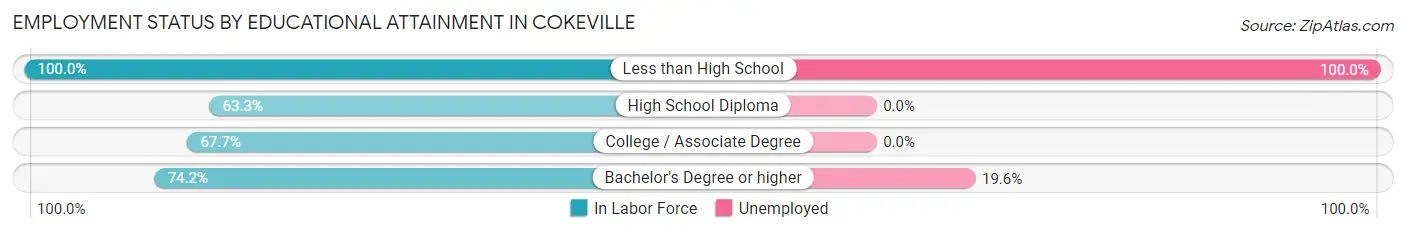
| Educational Attainment | In Labor Force | Unemployed |
| Less than High School | 4 (100.0%) | 4 (100.0%) |
| High School Diploma | 31 (63.3%) | 0 (0.0%) |
| College / Associate Degree | 44 (67.7%) | 0 (0.0%) |
| Bachelor's Degree or higher | 46 (74.2%) | 12 (19.6%) |
| Total | 125 (69.4%) | 19 (10.4%) |
Employment Occupations by Sex in Cokeville
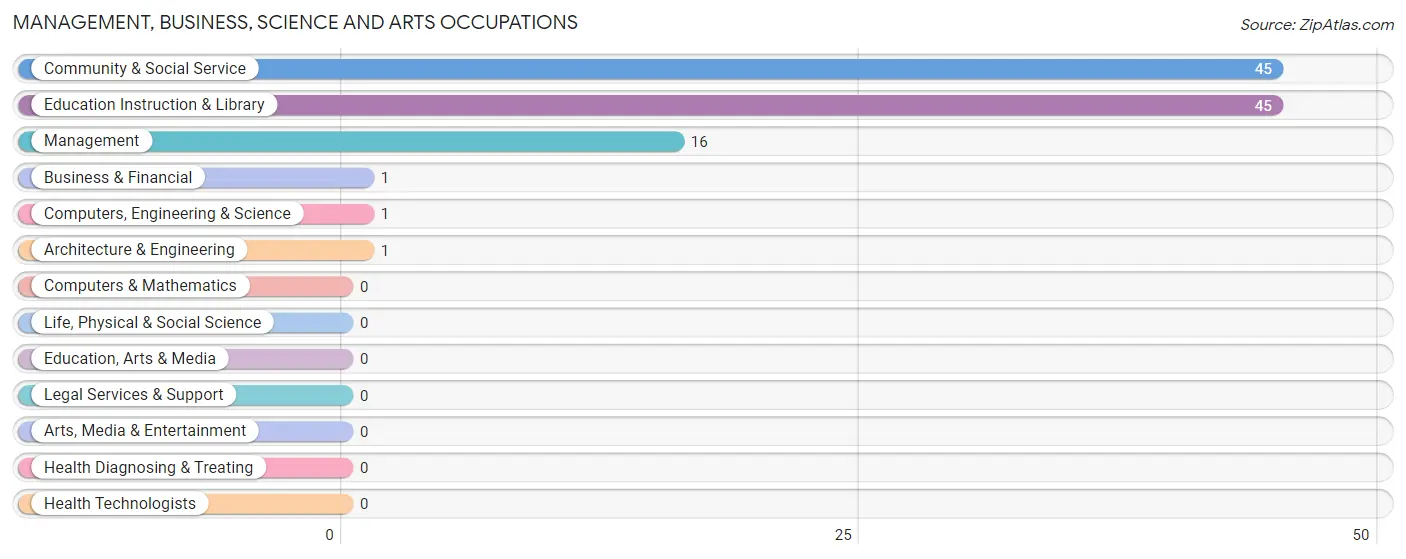
Management, Business, Science and Arts Occupations
The most common Management, Business, Science and Arts occupations in Cokeville are Community & Social Service (45 | 25.3%), Education Instruction & Library (45 | 25.3%), Management (16 | 9.0%), Business & Financial (1 | 0.6%), and Computers, Engineering & Science (1 | 0.6%).
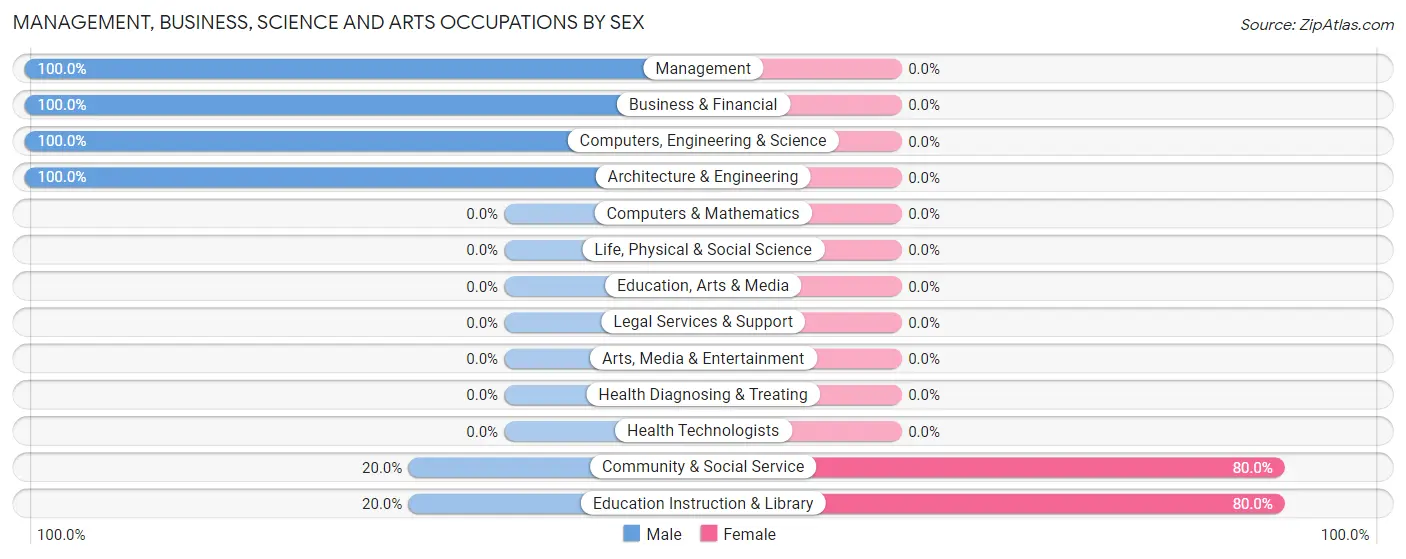
Management, Business, Science and Arts Occupations by Sex
Within the Management, Business, Science and Arts occupations in Cokeville, the most male-oriented occupations are Management (100.0%), Business & Financial (100.0%), and Computers, Engineering & Science (100.0%), while the most female-oriented occupations are Community & Social Service (80.0%), and Education Instruction & Library (80.0%).
| Occupation | Male | Female |
| Management | 16 (100.0%) | 0 (0.0%) |
| Business & Financial | 1 (100.0%) | 0 (0.0%) |
| Computers, Engineering & Science | 1 (100.0%) | 0 (0.0%) |
| Computers & Mathematics | 0 (0.0%) | 0 (0.0%) |
| Architecture & Engineering | 1 (100.0%) | 0 (0.0%) |
| Life, Physical & Social Science | 0 (0.0%) | 0 (0.0%) |
| Community & Social Service | 9 (20.0%) | 36 (80.0%) |
| Education, Arts & Media | 0 (0.0%) | 0 (0.0%) |
| Legal Services & Support | 0 (0.0%) | 0 (0.0%) |
| Education Instruction & Library | 9 (20.0%) | 36 (80.0%) |
| Arts, Media & Entertainment | 0 (0.0%) | 0 (0.0%) |
| Health Diagnosing & Treating | 0 (0.0%) | 0 (0.0%) |
| Health Technologists | 0 (0.0%) | 0 (0.0%) |
| Total (Category) | 27 (42.9%) | 36 (57.1%) |
| Total (Overall) | 115 (64.6%) | 63 (35.4%) |
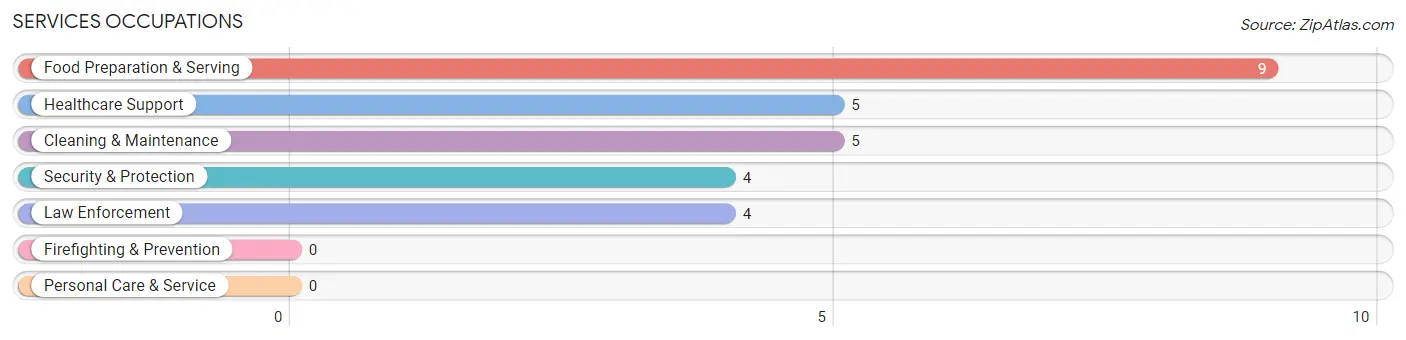
Services Occupations
The most common Services occupations in Cokeville are Food Preparation & Serving (9 | 5.1%), Healthcare Support (5 | 2.8%), Cleaning & Maintenance (5 | 2.8%), Security & Protection (4 | 2.2%), and Law Enforcement (4 | 2.2%).
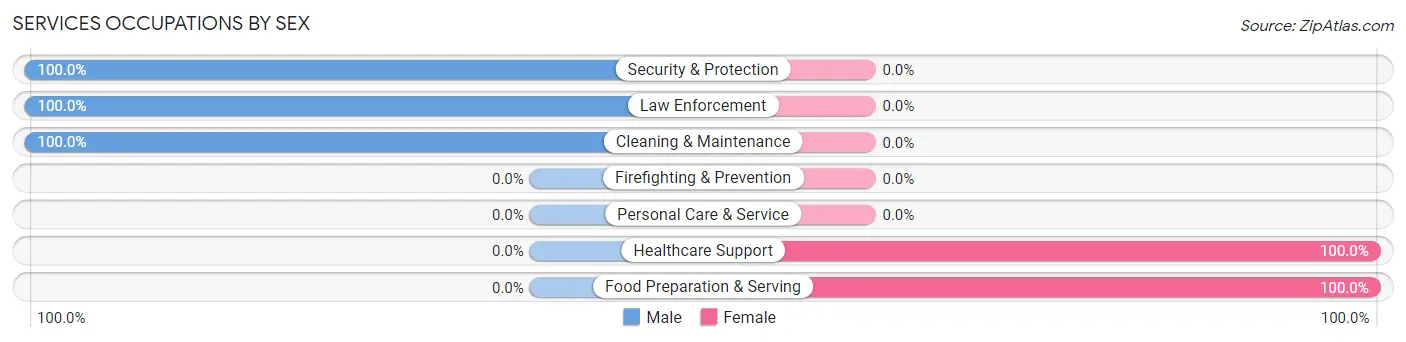
Services Occupations by Sex
Within the Services occupations in Cokeville, the most male-oriented occupations are Security & Protection (100.0%), Law Enforcement (100.0%), and Cleaning & Maintenance (100.0%), while the most female-oriented occupations are Healthcare Support (100.0%), and Food Preparation & Serving (100.0%).
| Occupation | Male | Female |
| Healthcare Support | 0 (0.0%) | 5 (100.0%) |
| Security & Protection | 4 (100.0%) | 0 (0.0%) |
| Firefighting & Prevention | 0 (0.0%) | 0 (0.0%) |
| Law Enforcement | 4 (100.0%) | 0 (0.0%) |
| Food Preparation & Serving | 0 (0.0%) | 9 (100.0%) |
| Cleaning & Maintenance | 5 (100.0%) | 0 (0.0%) |
| Personal Care & Service | 0 (0.0%) | 0 (0.0%) |
| Total (Category) | 9 (39.1%) | 14 (60.9%) |
| Total (Overall) | 115 (64.6%) | 63 (35.4%) |
Sales and Office Occupations
The most common Sales and Office occupations in Cokeville are Office & Administration (10 | 5.6%), and Sales & Related (5 | 2.8%).
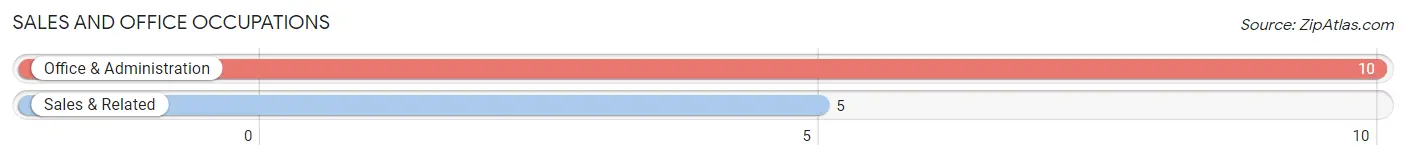
Sales and Office Occupations by Sex
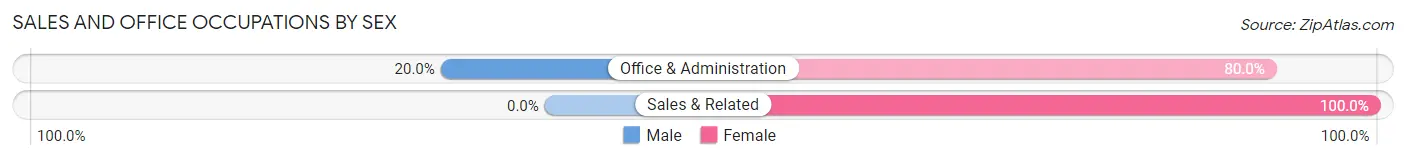
| Occupation | Male | Female |
| Sales & Related | 0 (0.0%) | 5 (100.0%) |
| Office & Administration | 2 (20.0%) | 8 (80.0%) |
| Total (Category) | 2 (13.3%) | 13 (86.7%) |
| Total (Overall) | 115 (64.6%) | 63 (35.4%) |
Natural Resources, Construction and Maintenance Occupations
The most common Natural Resources, Construction and Maintenance occupations in Cokeville are Construction & Extraction (32 | 18.0%), Installation, Maintenance & Repair (20 | 11.2%), and Farming, Fishing & Forestry (2 | 1.1%).
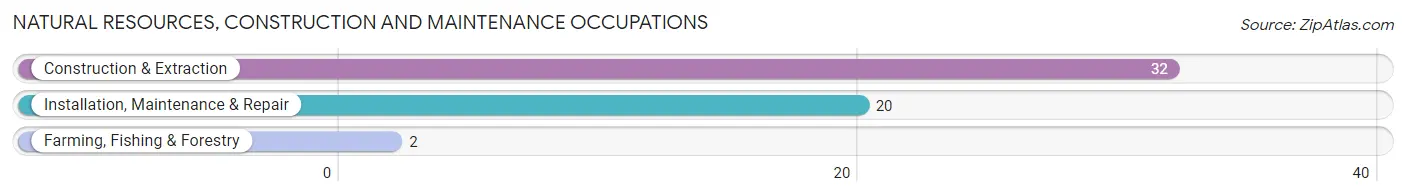
Natural Resources, Construction and Maintenance Occupations by Sex
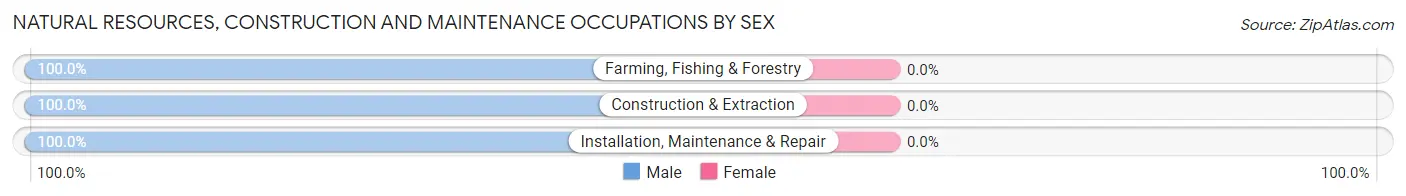
| Occupation | Male | Female |
| Farming, Fishing & Forestry | 2 (100.0%) | 0 (0.0%) |
| Construction & Extraction | 32 (100.0%) | 0 (0.0%) |
| Installation, Maintenance & Repair | 20 (100.0%) | 0 (0.0%) |
| Total (Category) | 54 (100.0%) | 0 (0.0%) |
| Total (Overall) | 115 (64.6%) | 63 (35.4%) |
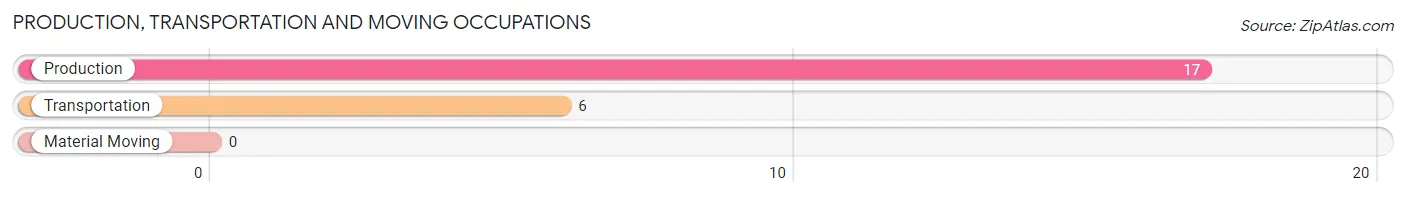
Production, Transportation and Moving Occupations
The most common Production, Transportation and Moving occupations in Cokeville are Production (17 | 9.6%), and Transportation (6 | 3.4%).
Production, Transportation and Moving Occupations by Sex
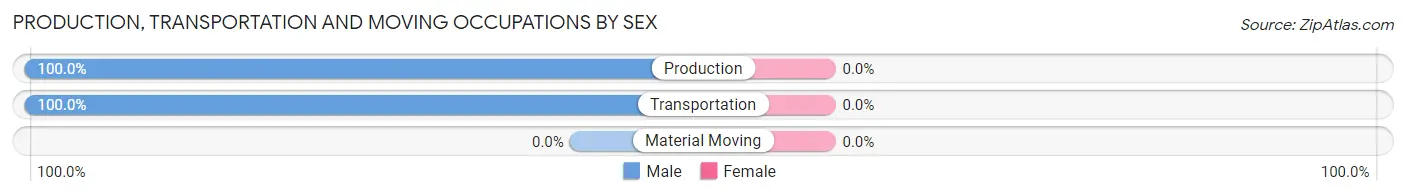
| Occupation | Male | Female |
| Production | 17 (100.0%) | 0 (0.0%) |
| Transportation | 6 (100.0%) | 0 (0.0%) |
| Material Moving | 0 (0.0%) | 0 (0.0%) |
| Total (Category) | 23 (100.0%) | 0 (0.0%) |
| Total (Overall) | 115 (64.6%) | 63 (35.4%) |
Employment Industries by Sex in Cokeville
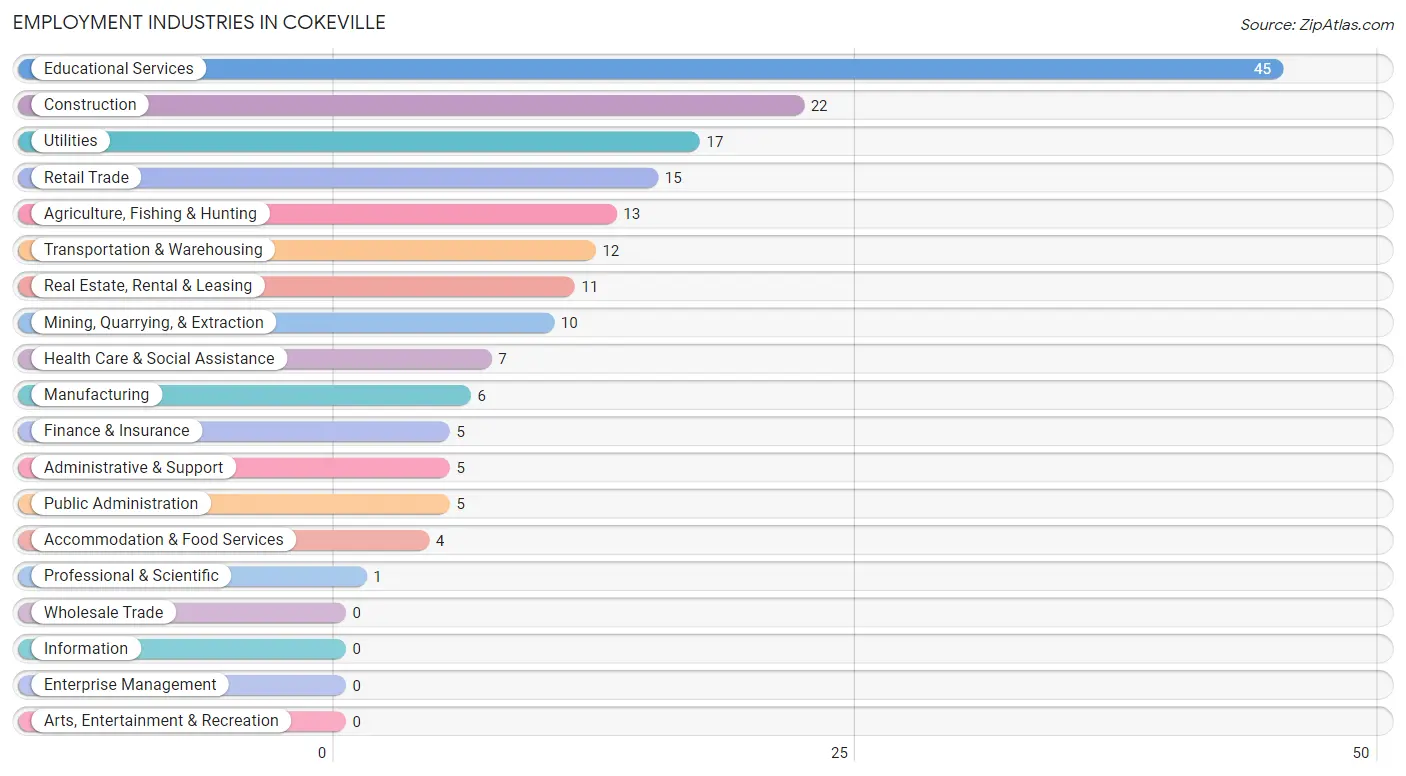
Employment Industries in Cokeville
The major employment industries in Cokeville include Educational Services (45 | 25.3%), Construction (22 | 12.4%), Utilities (17 | 9.6%), Retail Trade (15 | 8.4%), and Agriculture, Fishing & Hunting (13 | 7.3%).
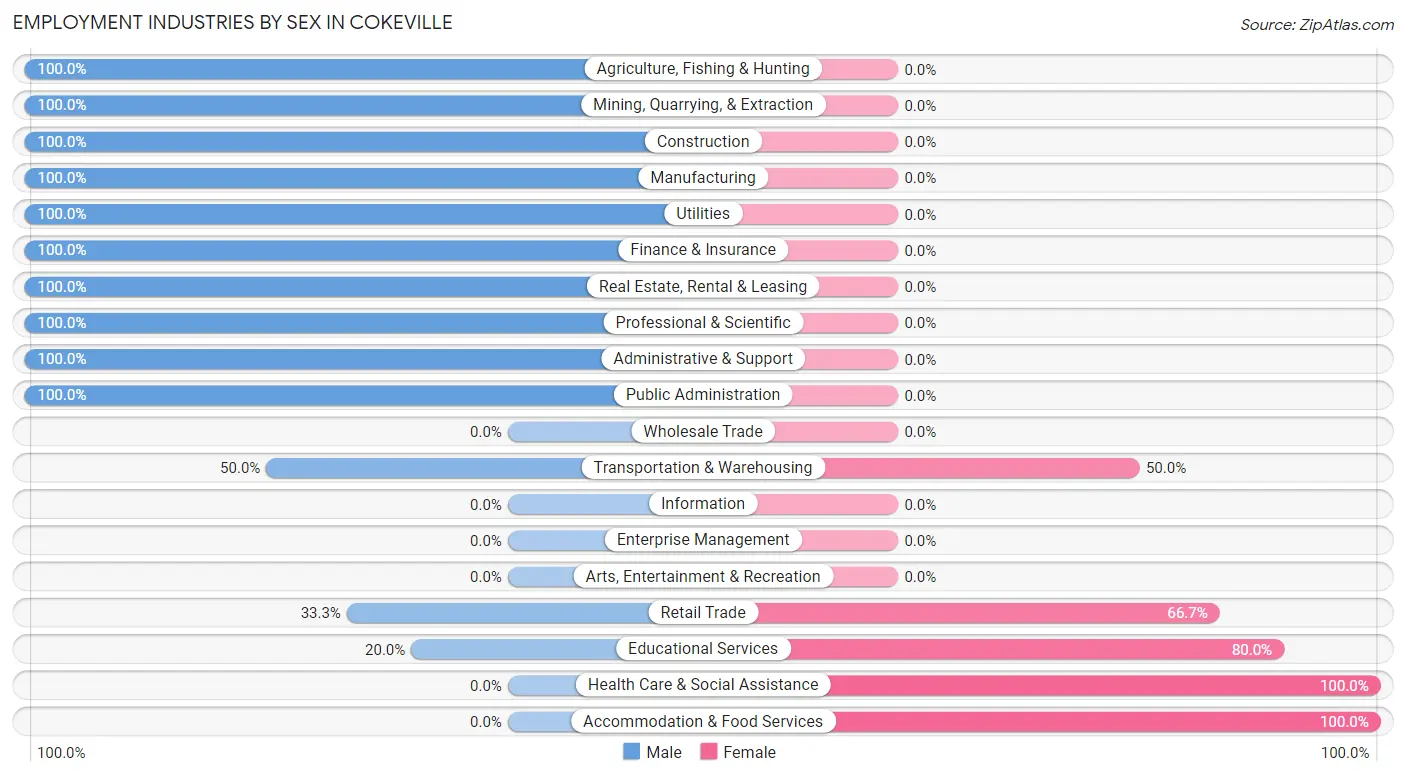
Employment Industries by Sex in Cokeville
The Cokeville industries that see more men than women are Agriculture, Fishing & Hunting (100.0%), Mining, Quarrying, & Extraction (100.0%), and Construction (100.0%), whereas the industries that tend to have a higher number of women are Health Care & Social Assistance (100.0%), Accommodation & Food Services (100.0%), and Educational Services (80.0%).
| Industry | Male | Female |
| Agriculture, Fishing & Hunting | 13 (100.0%) | 0 (0.0%) |
| Mining, Quarrying, & Extraction | 10 (100.0%) | 0 (0.0%) |
| Construction | 22 (100.0%) | 0 (0.0%) |
| Manufacturing | 6 (100.0%) | 0 (0.0%) |
| Wholesale Trade | 0 (0.0%) | 0 (0.0%) |
| Retail Trade | 5 (33.3%) | 10 (66.7%) |
| Transportation & Warehousing | 6 (50.0%) | 6 (50.0%) |
| Utilities | 17 (100.0%) | 0 (0.0%) |
| Information | 0 (0.0%) | 0 (0.0%) |
| Finance & Insurance | 5 (100.0%) | 0 (0.0%) |
| Real Estate, Rental & Leasing | 11 (100.0%) | 0 (0.0%) |
| Professional & Scientific | 1 (100.0%) | 0 (0.0%) |
| Enterprise Management | 0 (0.0%) | 0 (0.0%) |
| Administrative & Support | 5 (100.0%) | 0 (0.0%) |
| Educational Services | 9 (20.0%) | 36 (80.0%) |
| Health Care & Social Assistance | 0 (0.0%) | 7 (100.0%) |
| Arts, Entertainment & Recreation | 0 (0.0%) | 0 (0.0%) |
| Accommodation & Food Services | 0 (0.0%) | 4 (100.0%) |
| Public Administration | 5 (100.0%) | 0 (0.0%) |
| Total | 115 (64.6%) | 63 (35.4%) |
Education in Cokeville
School Enrollment in Cokeville
The most common levels of schooling among the 96 students in Cokeville are high school (36 | 37.5%), elementary school (18 | 18.8%), and graduate / professional (18 | 18.8%).
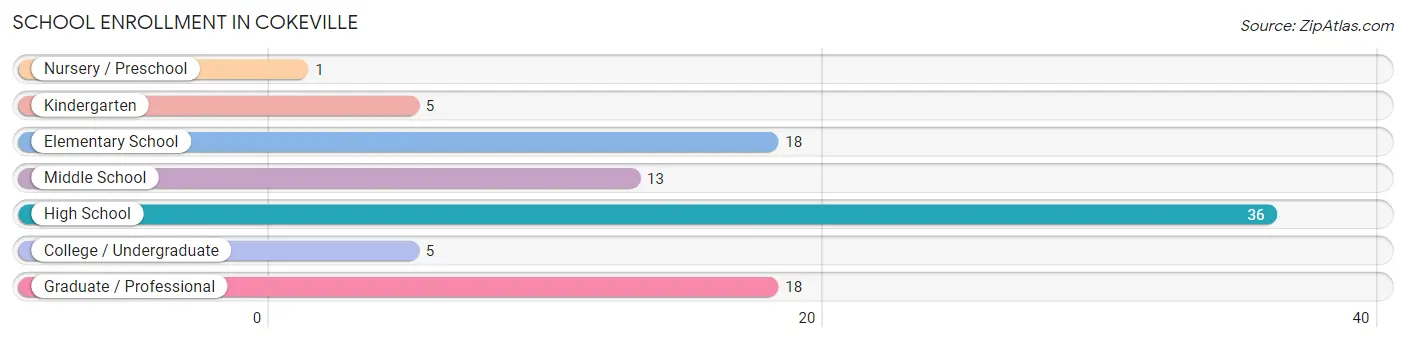
| School Level | # Students | % Students |
| Nursery / Preschool | 1 | 1.0% |
| Kindergarten | 5 | 5.2% |
| Elementary School | 18 | 18.8% |
| Middle School | 13 | 13.5% |
| High School | 36 | 37.5% |
| College / Undergraduate | 5 | 5.2% |
| Graduate / Professional | 18 | 18.8% |
| Total | 96 | 100.0% |
School Enrollment by Age by Funding Source in Cokeville
Out of a total of 96 students who are enrolled in schools in Cokeville, 1 (1.0%) attend a private institution, while the remaining 95 (99.0%) are enrolled in public schools. The age group of 3 to 4 year olds has the highest likelihood of being enrolled in private schools, with 1 (100.0% in the age bracket) enrolled. Conversely, the age group of 5 to 9 year old has the lowest likelihood of being enrolled in a private school, with 19 (100.0% in the age bracket) attending a public institution.
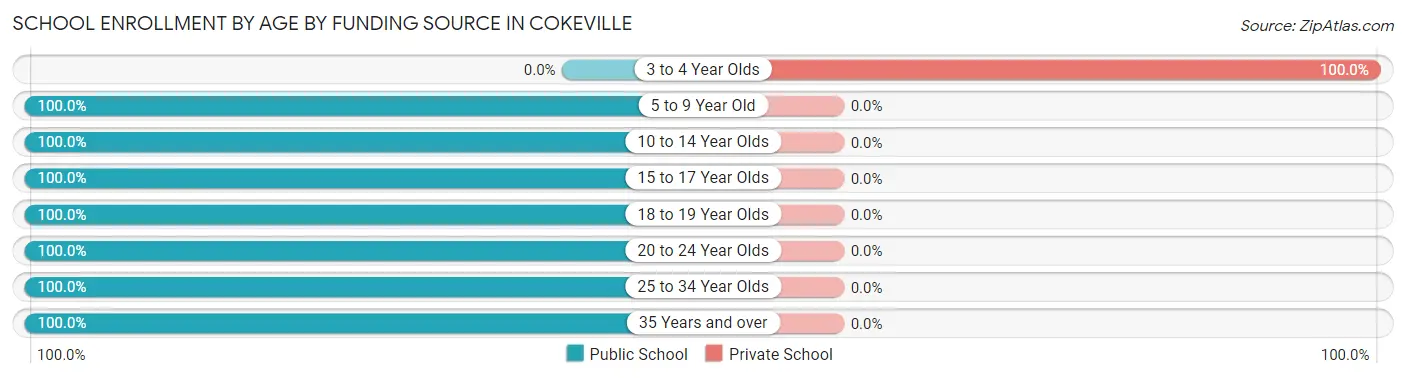
| Age Bracket | Public School | Private School |
| 3 to 4 Year Olds | 0 (0.0%) | 1 (100.0%) |
| 5 to 9 Year Old | 19 (100.0%) | 0 (0.0%) |
| 10 to 14 Year Olds | 17 (100.0%) | 0 (0.0%) |
| 15 to 17 Year Olds | 21 (100.0%) | 0 (0.0%) |
| 18 to 19 Year Olds | 11 (100.0%) | 0 (0.0%) |
| 20 to 24 Year Olds | 14 (100.0%) | 0 (0.0%) |
| 25 to 34 Year Olds | 4 (100.0%) | 0 (0.0%) |
| 35 Years and over | 9 (100.0%) | 0 (0.0%) |
| Total | 95 (99.0%) | 1 (1.0%) |
Educational Attainment by Field of Study in Cokeville
Education (26 | 31.7%), bio, nature & agricultural (22 | 26.8%), science & technology (17 | 20.7%), social sciences (5 | 6.1%), and business (5 | 6.1%) are the most common fields of study among 82 individuals in Cokeville who have obtained a bachelor's degree or higher.
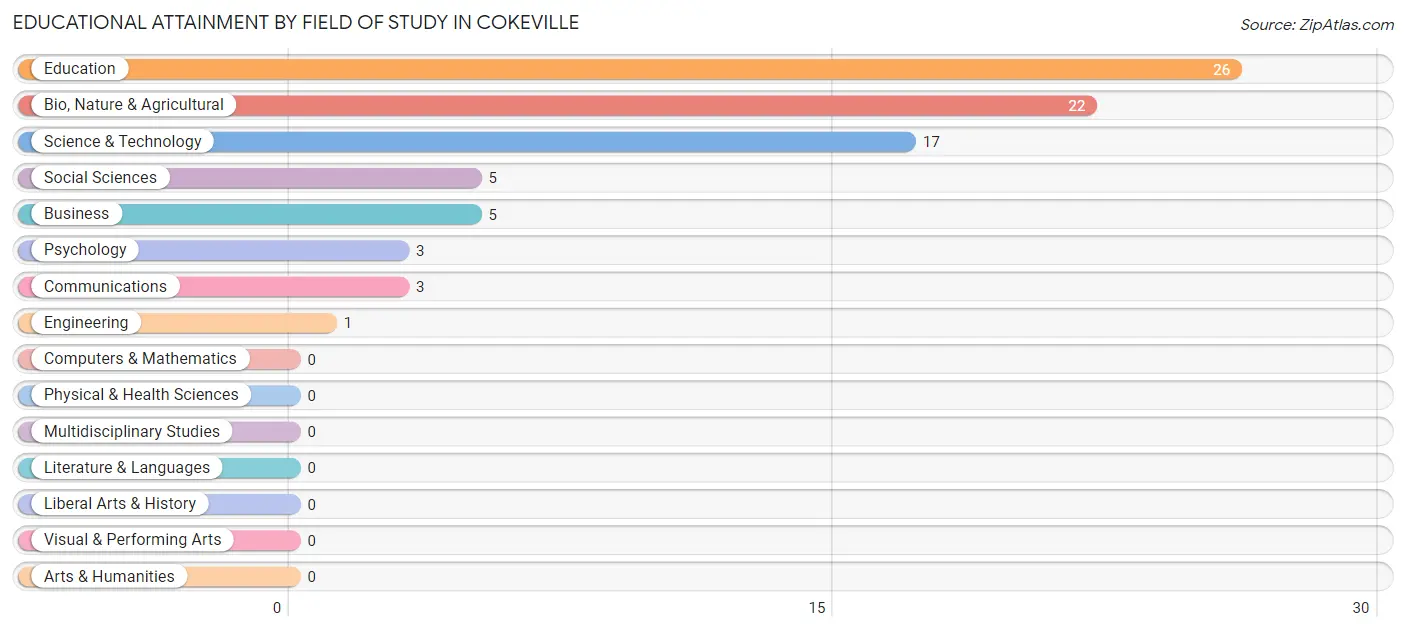
| Field of Study | # Graduates | % Graduates |
| Computers & Mathematics | 0 | 0.0% |
| Bio, Nature & Agricultural | 22 | 26.8% |
| Physical & Health Sciences | 0 | 0.0% |
| Psychology | 3 | 3.7% |
| Social Sciences | 5 | 6.1% |
| Engineering | 1 | 1.2% |
| Multidisciplinary Studies | 0 | 0.0% |
| Science & Technology | 17 | 20.7% |
| Business | 5 | 6.1% |
| Education | 26 | 31.7% |
| Literature & Languages | 0 | 0.0% |
| Liberal Arts & History | 0 | 0.0% |
| Visual & Performing Arts | 0 | 0.0% |
| Communications | 3 | 3.7% |
| Arts & Humanities | 0 | 0.0% |
| Total | 82 | 100.0% |
Transportation & Commute in Cokeville
Vehicle Availability by Sex in Cokeville
The most prevalent vehicle ownership categories in Cokeville are males with 2 vehicles (57, accounting for 51.8%) and females with 2 vehicles (22, making up 90.5%).
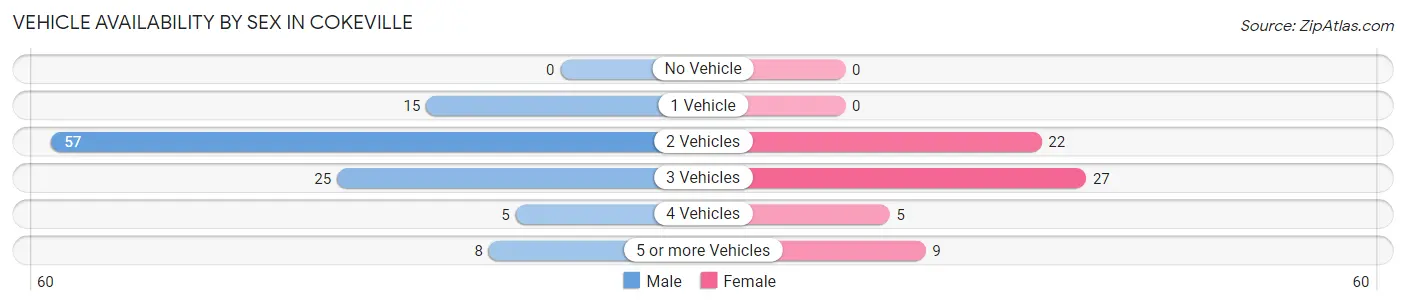
| Vehicles Available | Male | Female |
| No Vehicle | 0 (0.0%) | 0 (0.0%) |
| 1 Vehicle | 15 (13.6%) | 0 (0.0%) |
| 2 Vehicles | 57 (51.8%) | 22 (34.9%) |
| 3 Vehicles | 25 (22.7%) | 27 (42.9%) |
| 4 Vehicles | 5 (4.5%) | 5 (7.9%) |
| 5 or more Vehicles | 8 (7.3%) | 9 (14.3%) |
| Total | 110 (100.0%) | 63 (100.0%) |
Commute Time in Cokeville
The most frequently occuring commute durations in Cokeville are less than 5 minutes (57 commuters, 33.5%), 90 or more minutes (34 commuters, 20.0%), and 5 to 9 minutes (24 commuters, 14.1%).
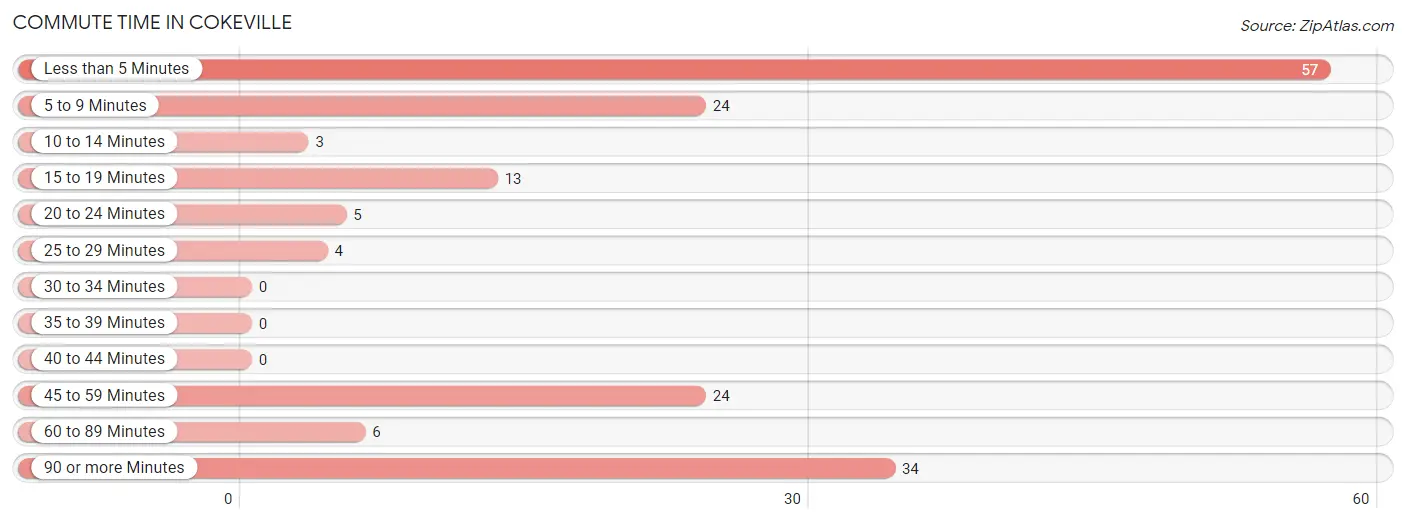
| Commute Time | # Commuters | % Commuters |
| Less than 5 Minutes | 57 | 33.5% |
| 5 to 9 Minutes | 24 | 14.1% |
| 10 to 14 Minutes | 3 | 1.8% |
| 15 to 19 Minutes | 13 | 7.6% |
| 20 to 24 Minutes | 5 | 2.9% |
| 25 to 29 Minutes | 4 | 2.4% |
| 30 to 34 Minutes | 0 | 0.0% |
| 35 to 39 Minutes | 0 | 0.0% |
| 40 to 44 Minutes | 0 | 0.0% |
| 45 to 59 Minutes | 24 | 14.1% |
| 60 to 89 Minutes | 6 | 3.5% |
| 90 or more Minutes | 34 | 20.0% |
Commute Time by Sex in Cokeville
The most common commute times in Cokeville are 90 or more minutes (34 commuters, 31.8%) for males and less than 5 minutes (30 commuters, 47.6%) for females.
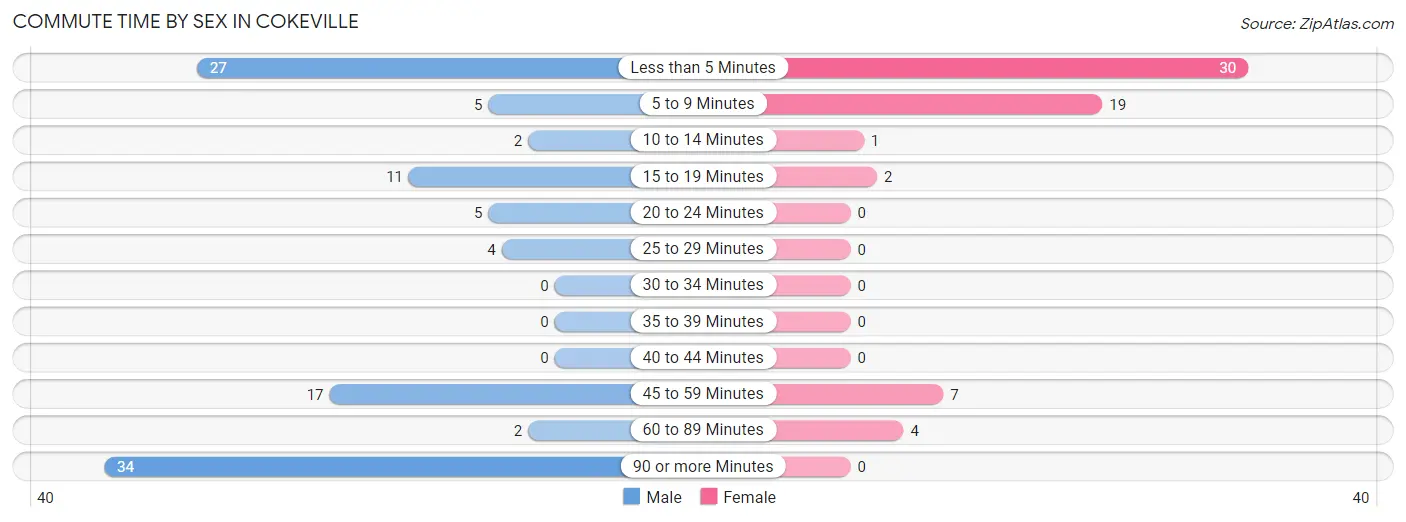
| Commute Time | Male | Female |
| Less than 5 Minutes | 27 (25.2%) | 30 (47.6%) |
| 5 to 9 Minutes | 5 (4.7%) | 19 (30.2%) |
| 10 to 14 Minutes | 2 (1.9%) | 1 (1.6%) |
| 15 to 19 Minutes | 11 (10.3%) | 2 (3.2%) |
| 20 to 24 Minutes | 5 (4.7%) | 0 (0.0%) |
| 25 to 29 Minutes | 4 (3.7%) | 0 (0.0%) |
| 30 to 34 Minutes | 0 (0.0%) | 0 (0.0%) |
| 35 to 39 Minutes | 0 (0.0%) | 0 (0.0%) |
| 40 to 44 Minutes | 0 (0.0%) | 0 (0.0%) |
| 45 to 59 Minutes | 17 (15.9%) | 7 (11.1%) |
| 60 to 89 Minutes | 2 (1.9%) | 4 (6.4%) |
| 90 or more Minutes | 34 (31.8%) | 0 (0.0%) |
Time of Departure to Work by Sex in Cokeville
The most frequent times of departure to work in Cokeville are 12:00 AM to 4:59 AM (44, 41.1%) for males and 7:00 AM to 7:29 AM (11, 17.5%) for females.
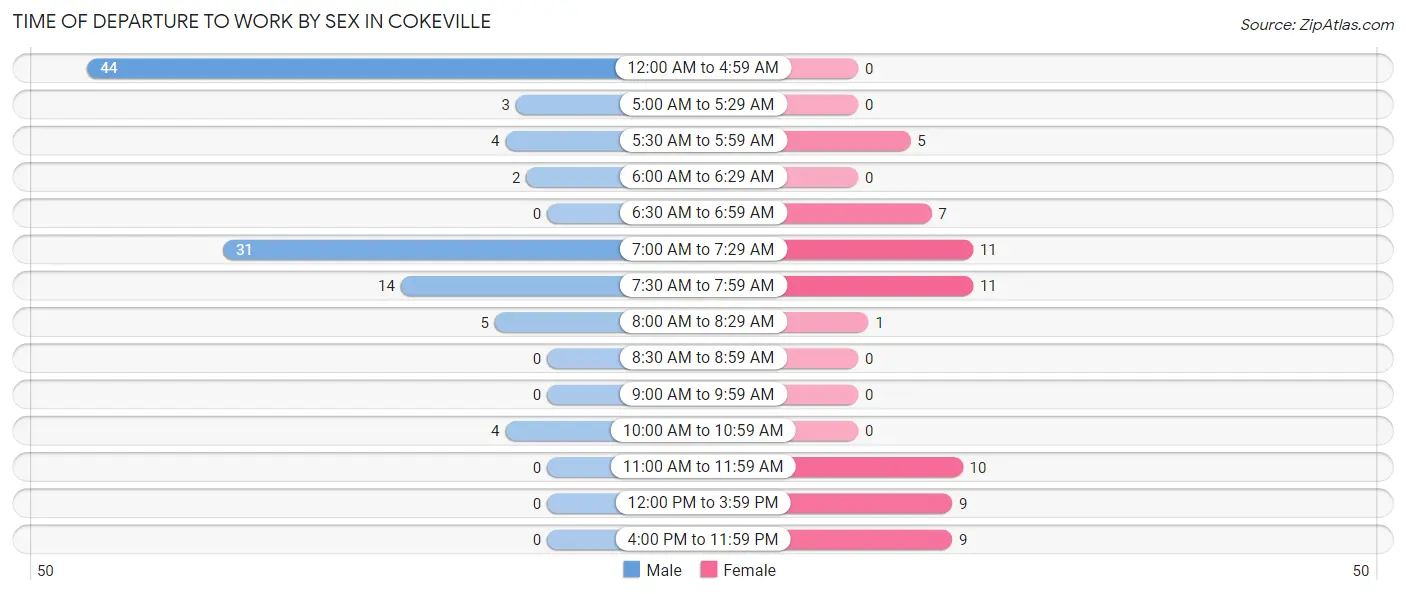
| Time of Departure | Male | Female |
| 12:00 AM to 4:59 AM | 44 (41.1%) | 0 (0.0%) |
| 5:00 AM to 5:29 AM | 3 (2.8%) | 0 (0.0%) |
| 5:30 AM to 5:59 AM | 4 (3.7%) | 5 (7.9%) |
| 6:00 AM to 6:29 AM | 2 (1.9%) | 0 (0.0%) |
| 6:30 AM to 6:59 AM | 0 (0.0%) | 7 (11.1%) |
| 7:00 AM to 7:29 AM | 31 (29.0%) | 11 (17.5%) |
| 7:30 AM to 7:59 AM | 14 (13.1%) | 11 (17.5%) |
| 8:00 AM to 8:29 AM | 5 (4.7%) | 1 (1.6%) |
| 8:30 AM to 8:59 AM | 0 (0.0%) | 0 (0.0%) |
| 9:00 AM to 9:59 AM | 0 (0.0%) | 0 (0.0%) |
| 10:00 AM to 10:59 AM | 4 (3.7%) | 0 (0.0%) |
| 11:00 AM to 11:59 AM | 0 (0.0%) | 10 (15.9%) |
| 12:00 PM to 3:59 PM | 0 (0.0%) | 9 (14.3%) |
| 4:00 PM to 11:59 PM | 0 (0.0%) | 9 (14.3%) |
| Total | 107 (100.0%) | 63 (100.0%) |
Housing Occupancy in Cokeville
Occupancy by Ownership in Cokeville
Of the total 145 dwellings in Cokeville, owner-occupied units account for 105 (72.4%), while renter-occupied units make up 40 (27.6%).
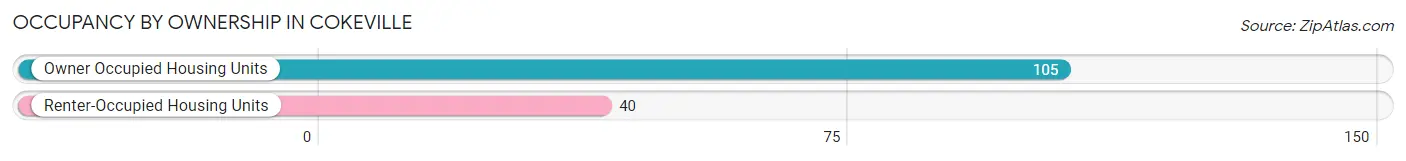
| Occupancy | # Housing Units | % Housing Units |
| Owner Occupied Housing Units | 105 | 72.4% |
| Renter-Occupied Housing Units | 40 | 27.6% |
| Total Occupied Housing Units | 145 | 100.0% |
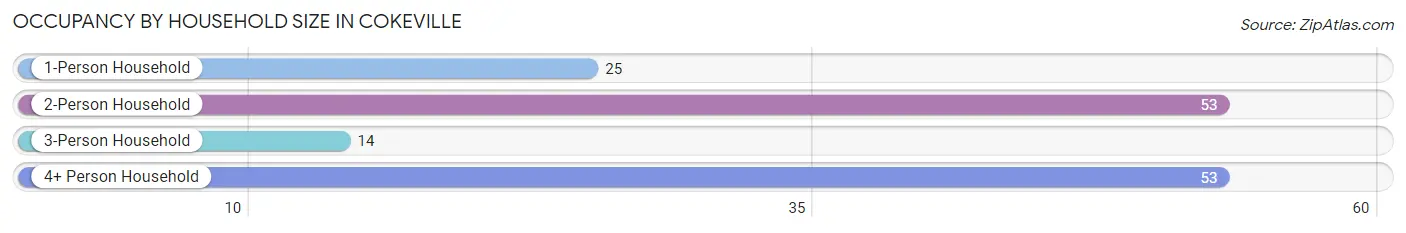
Occupancy by Household Size in Cokeville
| Household Size | # Housing Units | % Housing Units |
| 1-Person Household | 25 | 17.2% |
| 2-Person Household | 53 | 36.5% |
| 3-Person Household | 14 | 9.7% |
| 4+ Person Household | 53 | 36.5% |
| Total Housing Units | 145 | 100.0% |
Occupancy by Ownership by Household Size in Cokeville
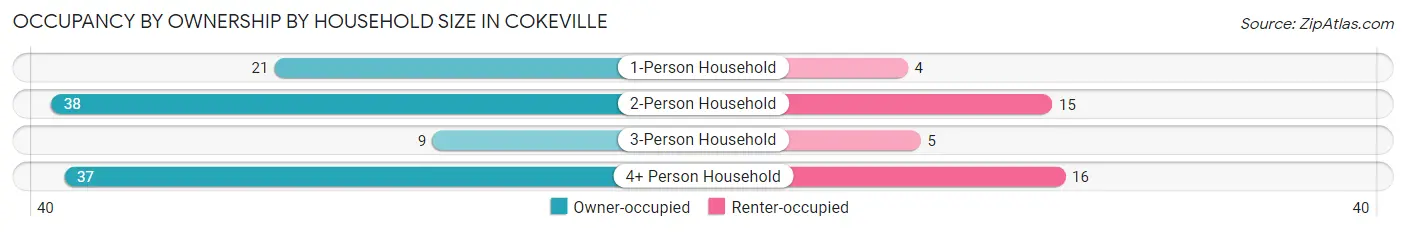
| Household Size | Owner-occupied | Renter-occupied |
| 1-Person Household | 21 (84.0%) | 4 (16.0%) |
| 2-Person Household | 38 (71.7%) | 15 (28.3%) |
| 3-Person Household | 9 (64.3%) | 5 (35.7%) |
| 4+ Person Household | 37 (69.8%) | 16 (30.2%) |
| Total Housing Units | 105 (72.4%) | 40 (27.6%) |
Occupancy by Educational Attainment in Cokeville
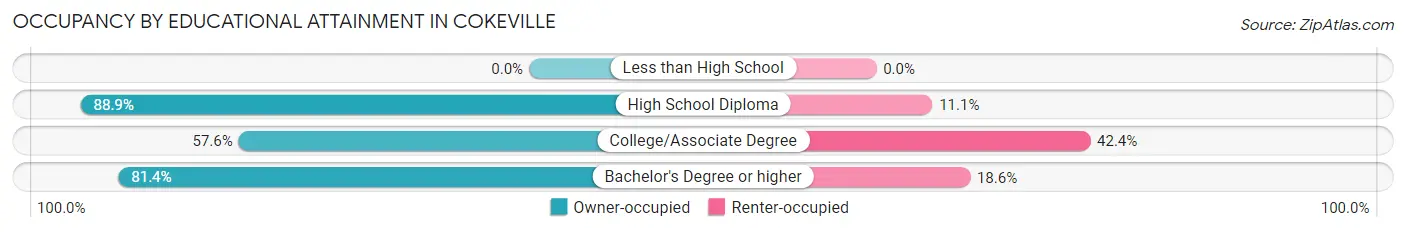
| Household Size | Owner-occupied | Renter-occupied |
| Less than High School | 0 (0.0%) | 0 (0.0%) |
| High School Diploma | 32 (88.9%) | 4 (11.1%) |
| College/Associate Degree | 38 (57.6%) | 28 (42.4%) |
| Bachelor's Degree or higher | 35 (81.4%) | 8 (18.6%) |
Occupancy by Age of Householder in Cokeville
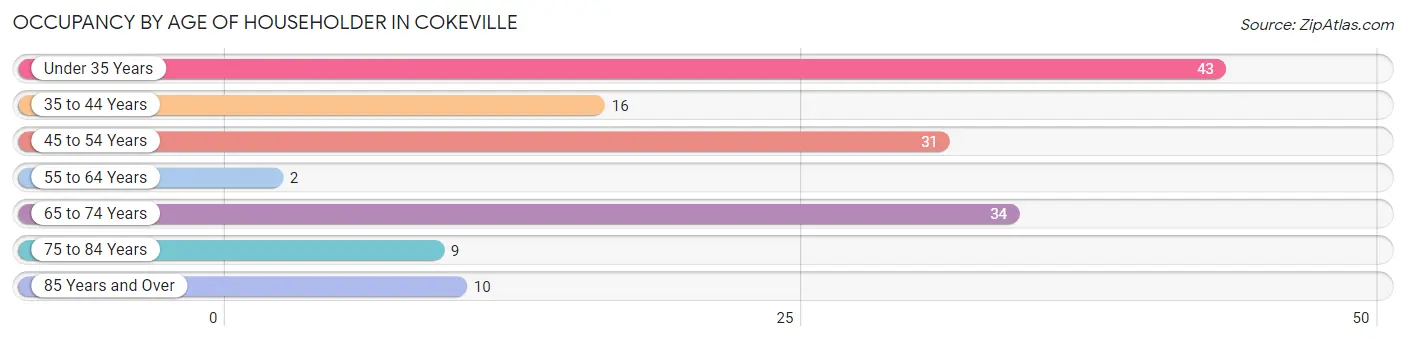
| Age Bracket | # Households | % Households |
| Under 35 Years | 43 | 29.7% |
| 35 to 44 Years | 16 | 11.0% |
| 45 to 54 Years | 31 | 21.4% |
| 55 to 64 Years | 2 | 1.4% |
| 65 to 74 Years | 34 | 23.4% |
| 75 to 84 Years | 9 | 6.2% |
| 85 Years and Over | 10 | 6.9% |
| Total | 145 | 100.0% |
Housing Finances in Cokeville
Median Income by Occupancy in Cokeville
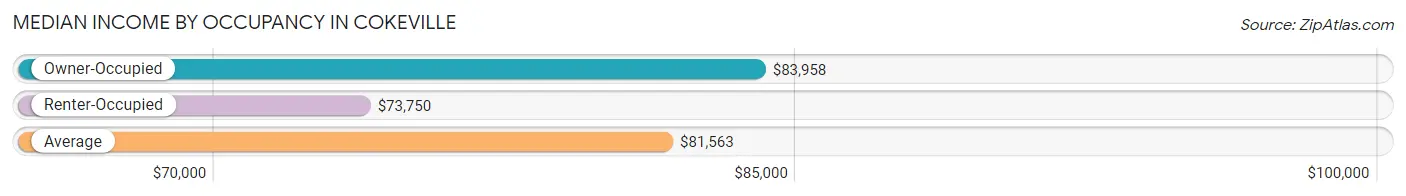
| Occupancy Type | # Households | Median Income |
| Owner-Occupied | 105 (72.4%) | $83,958 |
| Renter-Occupied | 40 (27.6%) | $73,750 |
| Average | 145 (100.0%) | $81,563 |
Occupancy by Householder Income Bracket in Cokeville
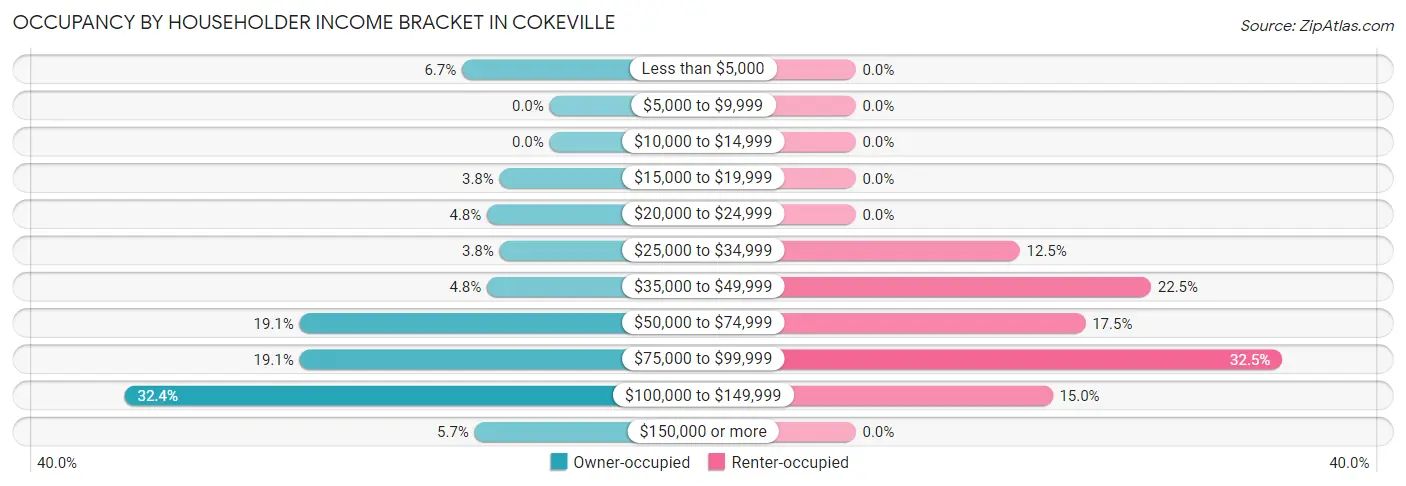
| Income Bracket | Owner-occupied | Renter-occupied |
| Less than $5,000 | 7 (6.7%) | 0 (0.0%) |
| $5,000 to $9,999 | 0 (0.0%) | 0 (0.0%) |
| $10,000 to $14,999 | 0 (0.0%) | 0 (0.0%) |
| $15,000 to $19,999 | 4 (3.8%) | 0 (0.0%) |
| $20,000 to $24,999 | 5 (4.8%) | 0 (0.0%) |
| $25,000 to $34,999 | 4 (3.8%) | 5 (12.5%) |
| $35,000 to $49,999 | 5 (4.8%) | 9 (22.5%) |
| $50,000 to $74,999 | 20 (19.1%) | 7 (17.5%) |
| $75,000 to $99,999 | 20 (19.1%) | 13 (32.5%) |
| $100,000 to $149,999 | 34 (32.4%) | 6 (15.0%) |
| $150,000 or more | 6 (5.7%) | 0 (0.0%) |
| Total | 105 (100.0%) | 40 (100.0%) |
Monthly Housing Cost Tiers in Cokeville
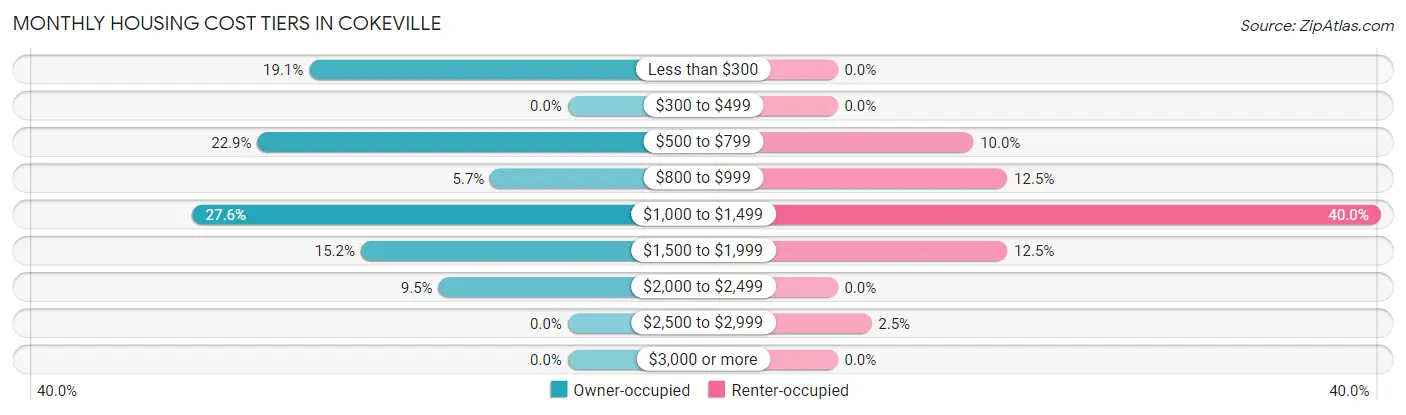
| Monthly Cost | Owner-occupied | Renter-occupied |
| Less than $300 | 20 (19.1%) | 0 (0.0%) |
| $300 to $499 | 0 (0.0%) | 0 (0.0%) |
| $500 to $799 | 24 (22.9%) | 4 (10.0%) |
| $800 to $999 | 6 (5.7%) | 5 (12.5%) |
| $1,000 to $1,499 | 29 (27.6%) | 16 (40.0%) |
| $1,500 to $1,999 | 16 (15.2%) | 5 (12.5%) |
| $2,000 to $2,499 | 10 (9.5%) | 0 (0.0%) |
| $2,500 to $2,999 | 0 (0.0%) | 1 (2.5%) |
| $3,000 or more | 0 (0.0%) | 0 (0.0%) |
| Total | 105 (100.0%) | 40 (100.0%) |
Physical Housing Characteristics in Cokeville
Housing Structures in Cokeville
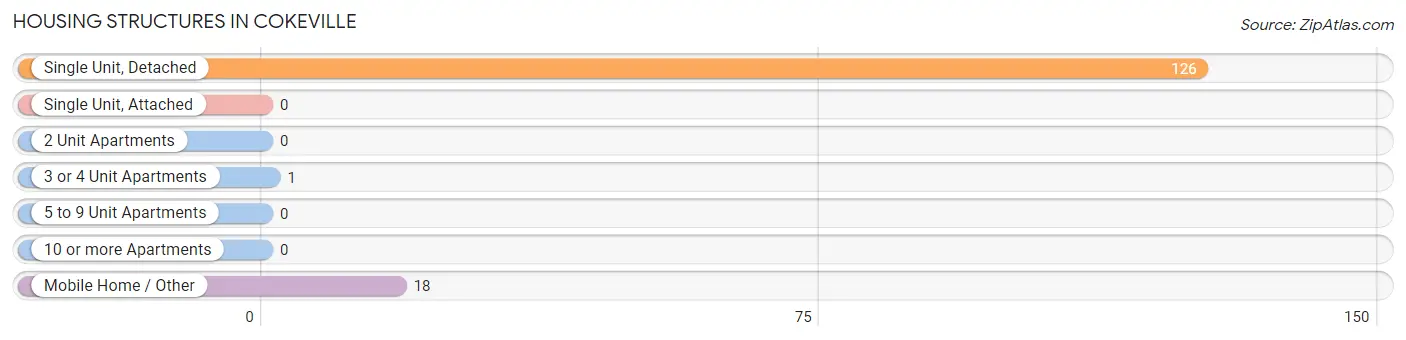
| Structure Type | # Housing Units | % Housing Units |
| Single Unit, Detached | 126 | 86.9% |
| Single Unit, Attached | 0 | 0.0% |
| 2 Unit Apartments | 0 | 0.0% |
| 3 or 4 Unit Apartments | 1 | 0.7% |
| 5 to 9 Unit Apartments | 0 | 0.0% |
| 10 or more Apartments | 0 | 0.0% |
| Mobile Home / Other | 18 | 12.4% |
| Total | 145 | 100.0% |
Housing Structures by Occupancy in Cokeville
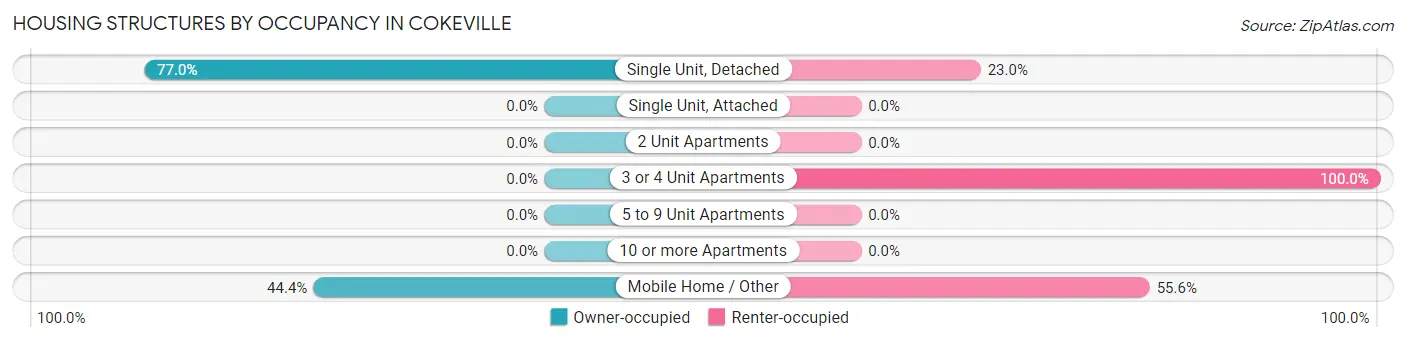
| Structure Type | Owner-occupied | Renter-occupied |
| Single Unit, Detached | 97 (77.0%) | 29 (23.0%) |
| Single Unit, Attached | 0 (0.0%) | 0 (0.0%) |
| 2 Unit Apartments | 0 (0.0%) | 0 (0.0%) |
| 3 or 4 Unit Apartments | 0 (0.0%) | 1 (100.0%) |
| 5 to 9 Unit Apartments | 0 (0.0%) | 0 (0.0%) |
| 10 or more Apartments | 0 (0.0%) | 0 (0.0%) |
| Mobile Home / Other | 8 (44.4%) | 10 (55.6%) |
| Total | 105 (72.4%) | 40 (27.6%) |
Housing Structures by Number of Rooms in Cokeville
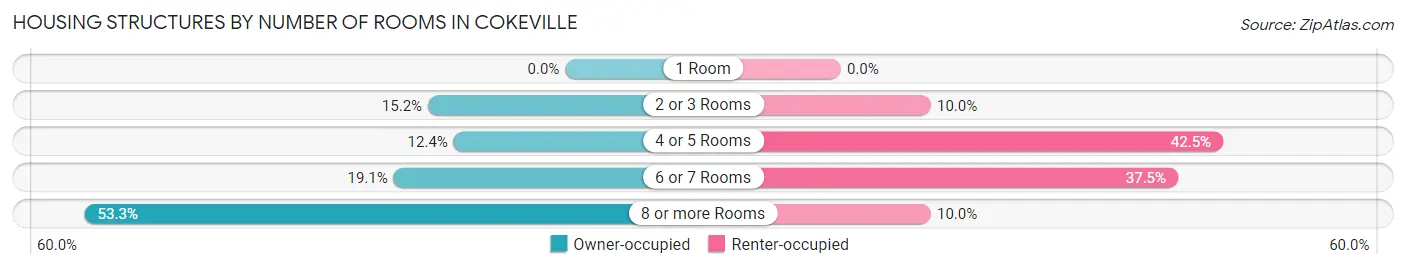
| Number of Rooms | Owner-occupied | Renter-occupied |
| 1 Room | 0 (0.0%) | 0 (0.0%) |
| 2 or 3 Rooms | 16 (15.2%) | 4 (10.0%) |
| 4 or 5 Rooms | 13 (12.4%) | 17 (42.5%) |
| 6 or 7 Rooms | 20 (19.1%) | 15 (37.5%) |
| 8 or more Rooms | 56 (53.3%) | 4 (10.0%) |
| Total | 105 (100.0%) | 40 (100.0%) |
Housing Structure by Heating Type in Cokeville
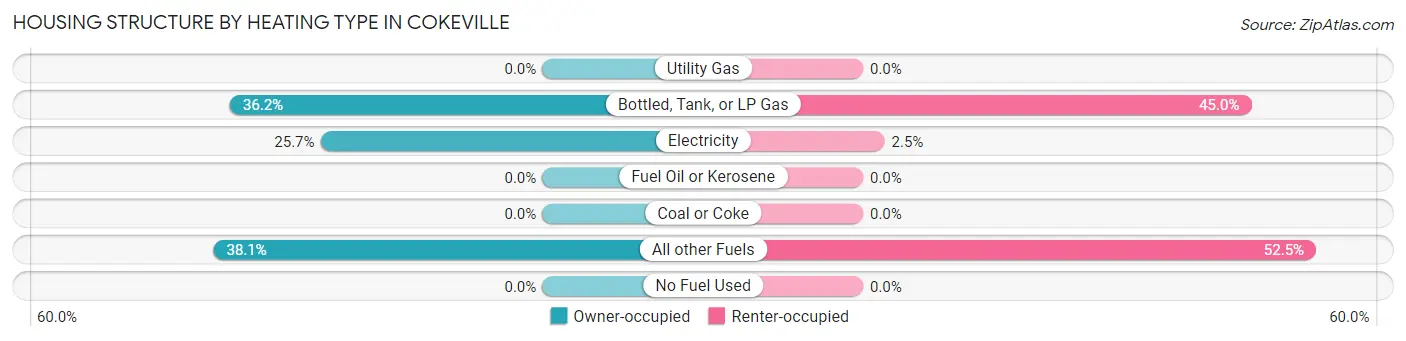
| Heating Type | Owner-occupied | Renter-occupied |
| Utility Gas | 0 (0.0%) | 0 (0.0%) |
| Bottled, Tank, or LP Gas | 38 (36.2%) | 18 (45.0%) |
| Electricity | 27 (25.7%) | 1 (2.5%) |
| Fuel Oil or Kerosene | 0 (0.0%) | 0 (0.0%) |
| Coal or Coke | 0 (0.0%) | 0 (0.0%) |
| All other Fuels | 40 (38.1%) | 21 (52.5%) |
| No Fuel Used | 0 (0.0%) | 0 (0.0%) |
| Total | 105 (100.0%) | 40 (100.0%) |
Household Vehicle Usage in Cokeville
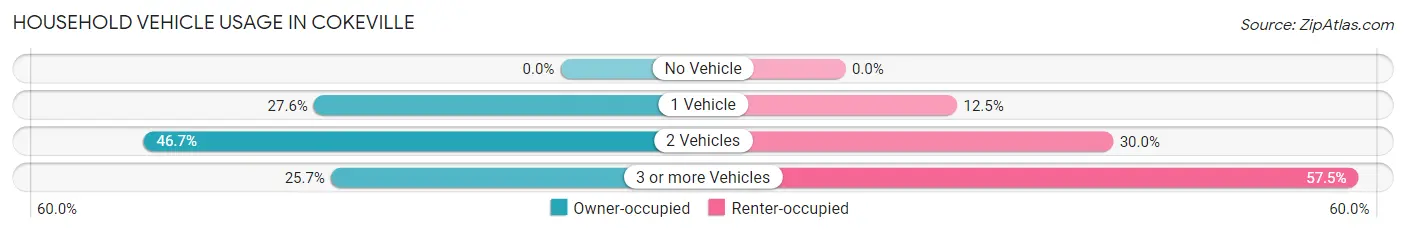
| Vehicles per Household | Owner-occupied | Renter-occupied |
| No Vehicle | 0 (0.0%) | 0 (0.0%) |
| 1 Vehicle | 29 (27.6%) | 5 (12.5%) |
| 2 Vehicles | 49 (46.7%) | 12 (30.0%) |
| 3 or more Vehicles | 27 (25.7%) | 23 (57.5%) |
| Total | 105 (100.0%) | 40 (100.0%) |
Real Estate & Mortgages in Cokeville
Real Estate and Mortgage Overview in Cokeville
| Characteristic | Without Mortgage | With Mortgage |
| Housing Units | 39 | 66 |
| Median Property Value | - | - |
| Median Household Income | - | - |
| Monthly Housing Costs | - | - |
| Real Estate Taxes | - | - |
Property Value by Mortgage Status in Cokeville
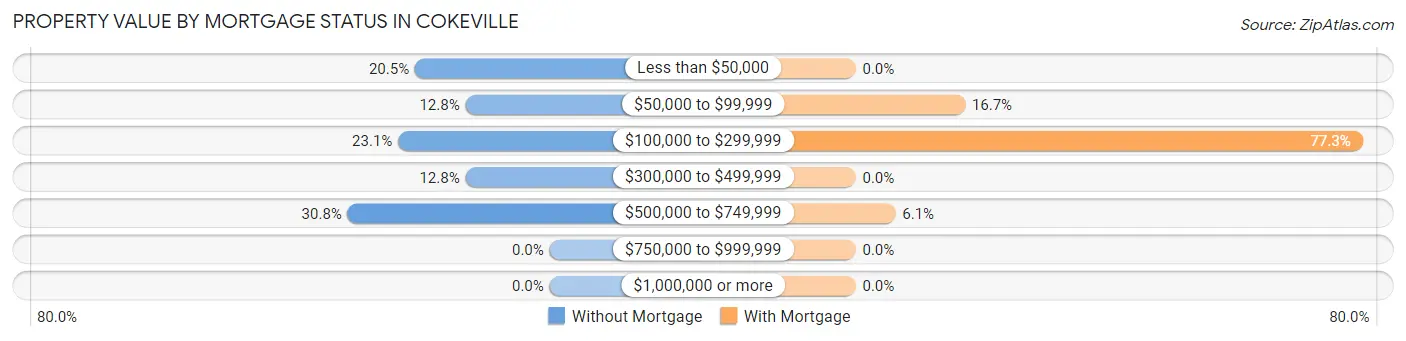
| Property Value | Without Mortgage | With Mortgage |
| Less than $50,000 | 8 (20.5%) | 0 (0.0%) |
| $50,000 to $99,999 | 5 (12.8%) | 11 (16.7%) |
| $100,000 to $299,999 | 9 (23.1%) | 51 (77.3%) |
| $300,000 to $499,999 | 5 (12.8%) | 0 (0.0%) |
| $500,000 to $749,999 | 12 (30.8%) | 4 (6.1%) |
| $750,000 to $999,999 | 0 (0.0%) | 0 (0.0%) |
| $1,000,000 or more | 0 (0.0%) | 0 (0.0%) |
| Total | 39 (100.0%) | 66 (100.0%) |
Household Income by Mortgage Status in Cokeville
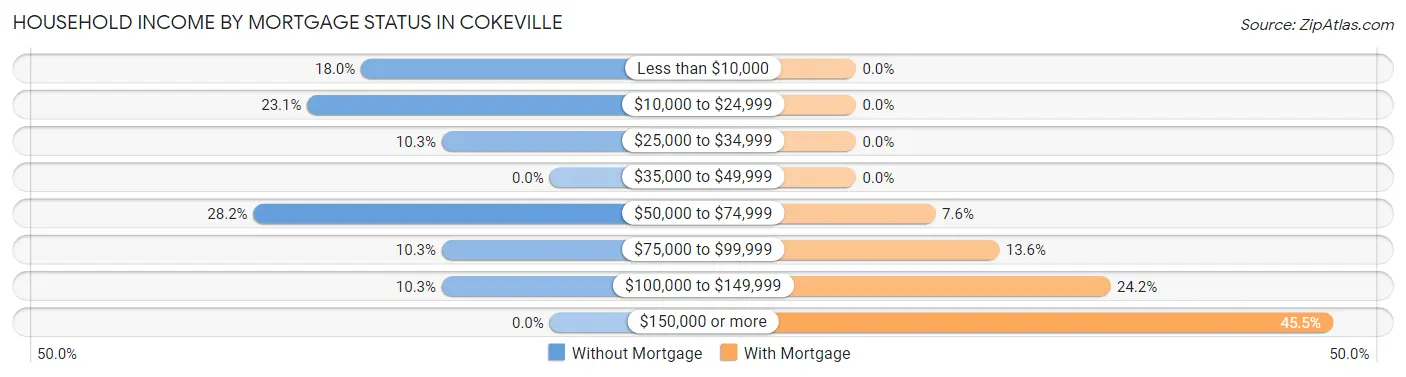
| Household Income | Without Mortgage | With Mortgage |
| Less than $10,000 | 7 (17.9%) | 0 (0.0%) |
| $10,000 to $24,999 | 9 (23.1%) | 0 (0.0%) |
| $25,000 to $34,999 | 4 (10.3%) | 0 (0.0%) |
| $35,000 to $49,999 | 0 (0.0%) | 0 (0.0%) |
| $50,000 to $74,999 | 11 (28.2%) | 5 (7.6%) |
| $75,000 to $99,999 | 4 (10.3%) | 9 (13.6%) |
| $100,000 to $149,999 | 4 (10.3%) | 16 (24.2%) |
| $150,000 or more | 0 (0.0%) | 30 (45.5%) |
| Total | 39 (100.0%) | 66 (100.0%) |
Property Value to Household Income Ratio in Cokeville
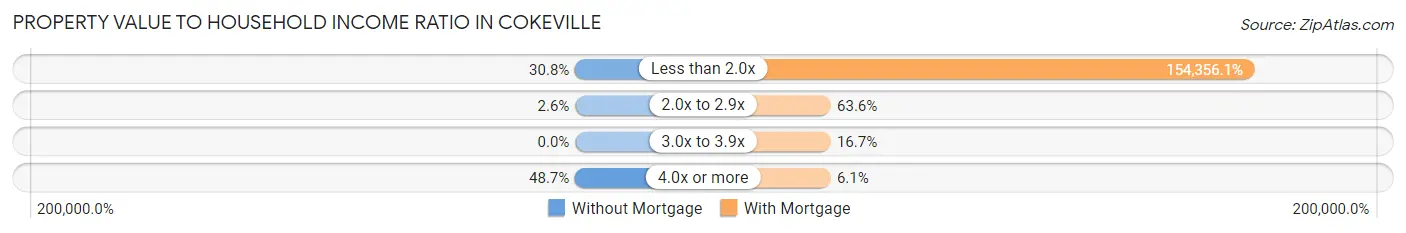
| Value-to-Income Ratio | Without Mortgage | With Mortgage |
| Less than 2.0x | 12 (30.8%) | 101,875 (154,356.1%) |
| 2.0x to 2.9x | 1 (2.6%) | 42 (63.6%) |
| 3.0x to 3.9x | 0 (0.0%) | 11 (16.7%) |
| 4.0x or more | 19 (48.7%) | 4 (6.1%) |
| Total | 39 (100.0%) | 66 (100.0%) |
Real Estate Taxes by Mortgage Status in Cokeville
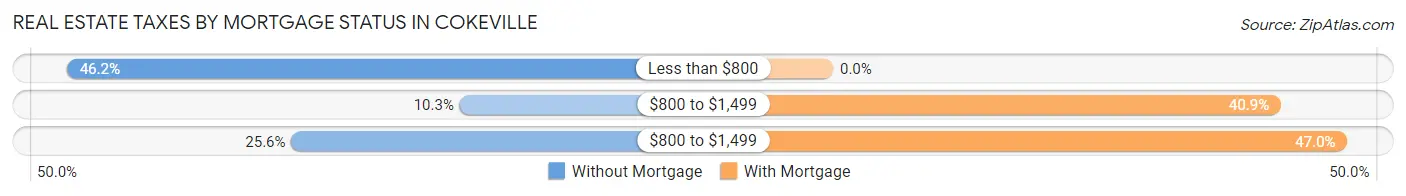
| Property Taxes | Without Mortgage | With Mortgage |
| Less than $800 | 18 (46.2%) | 0 (0.0%) |
| $800 to $1,499 | 4 (10.3%) | 27 (40.9%) |
| $800 to $1,499 | 10 (25.6%) | 31 (47.0%) |
| Total | 39 (100.0%) | 66 (100.0%) |
Health & Disability in Cokeville
Health Insurance Coverage by Age in Cokeville
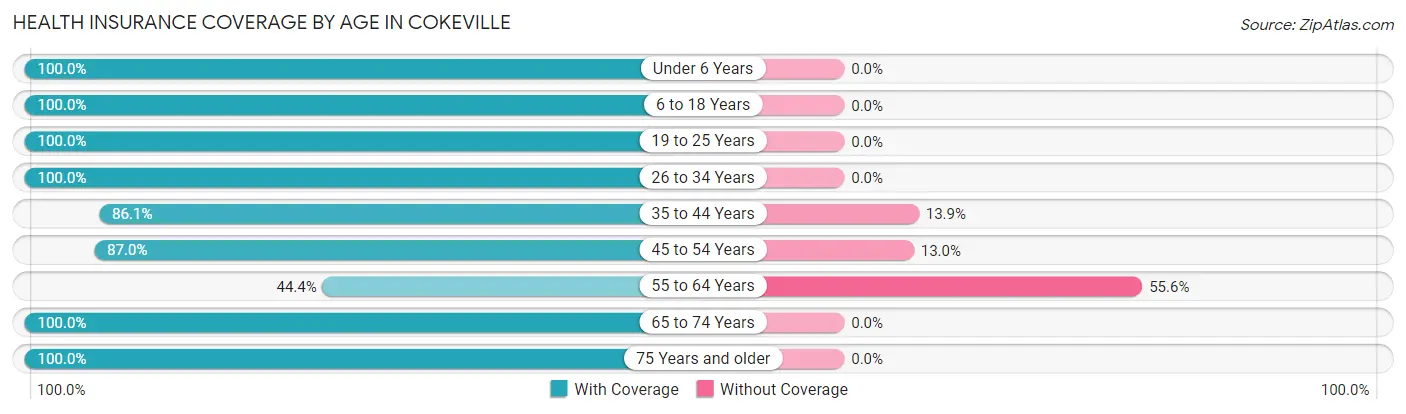
| Age Bracket | With Coverage | Without Coverage |
| Under 6 Years | 65 (100.0%) | 0 (0.0%) |
| 6 to 18 Years | 69 (100.0%) | 0 (0.0%) |
| 19 to 25 Years | 55 (100.0%) | 0 (0.0%) |
| 26 to 34 Years | 57 (100.0%) | 0 (0.0%) |
| 35 to 44 Years | 31 (86.1%) | 5 (13.9%) |
| 45 to 54 Years | 47 (87.0%) | 7 (13.0%) |
| 55 to 64 Years | 12 (44.4%) | 15 (55.6%) |
| 65 to 74 Years | 34 (100.0%) | 0 (0.0%) |
| 75 Years and older | 26 (100.0%) | 0 (0.0%) |
| Total | 396 (93.6%) | 27 (6.4%) |
Health Insurance Coverage by Citizenship Status in Cokeville
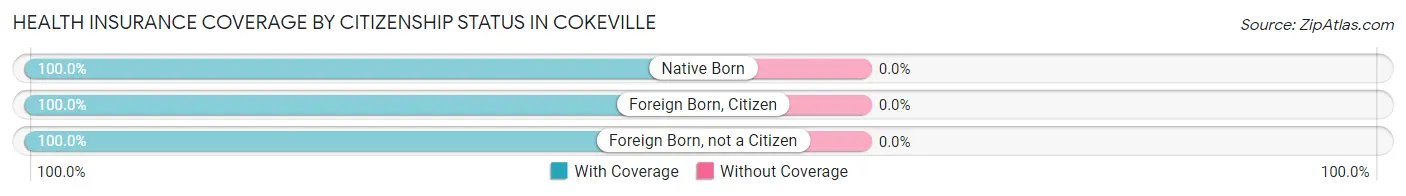
| Citizenship Status | With Coverage | Without Coverage |
| Native Born | 65 (100.0%) | 0 (0.0%) |
| Foreign Born, Citizen | 69 (100.0%) | 0 (0.0%) |
| Foreign Born, not a Citizen | 55 (100.0%) | 0 (0.0%) |
Health Insurance Coverage by Household Income in Cokeville
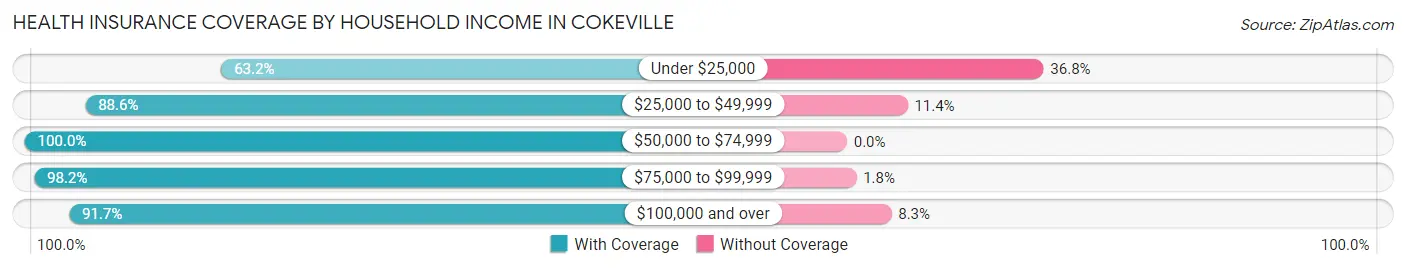
| Household Income | With Coverage | Without Coverage |
| Under $25,000 | 12 (63.2%) | 7 (36.8%) |
| $25,000 to $49,999 | 39 (88.6%) | 5 (11.4%) |
| $50,000 to $74,999 | 91 (100.0%) | 0 (0.0%) |
| $75,000 to $99,999 | 111 (98.2%) | 2 (1.8%) |
| $100,000 and over | 143 (91.7%) | 13 (8.3%) |
Public vs Private Health Insurance Coverage by Age in Cokeville
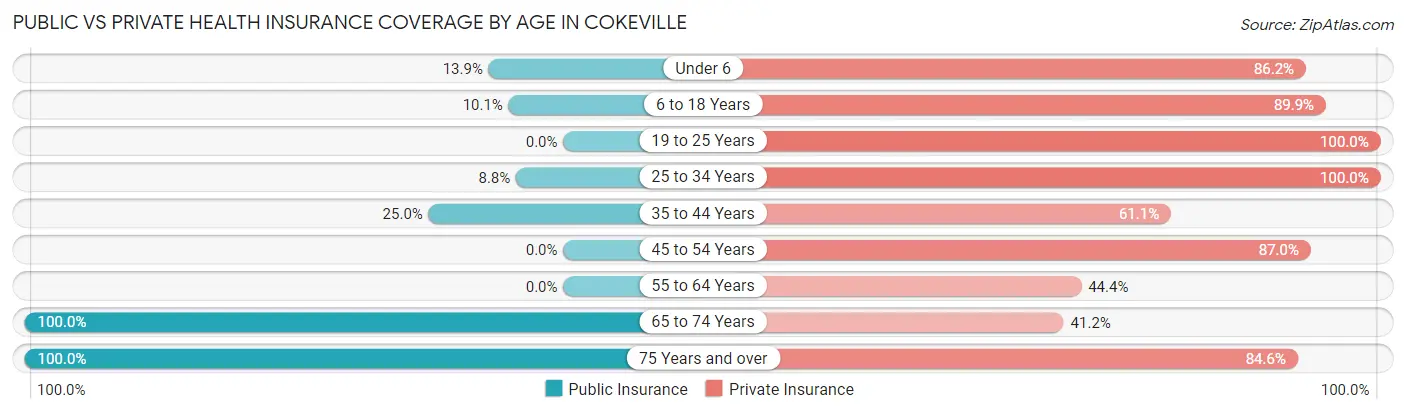
| Age Bracket | Public Insurance | Private Insurance |
| Under 6 | 9 (13.9%) | 56 (86.2%) |
| 6 to 18 Years | 7 (10.1%) | 62 (89.9%) |
| 19 to 25 Years | 0 (0.0%) | 55 (100.0%) |
| 25 to 34 Years | 5 (8.8%) | 57 (100.0%) |
| 35 to 44 Years | 9 (25.0%) | 22 (61.1%) |
| 45 to 54 Years | 0 (0.0%) | 47 (87.0%) |
| 55 to 64 Years | 0 (0.0%) | 12 (44.4%) |
| 65 to 74 Years | 34 (100.0%) | 14 (41.2%) |
| 75 Years and over | 26 (100.0%) | 22 (84.6%) |
| Total | 90 (21.3%) | 347 (82.0%) |
Disability Status by Sex by Age in Cokeville
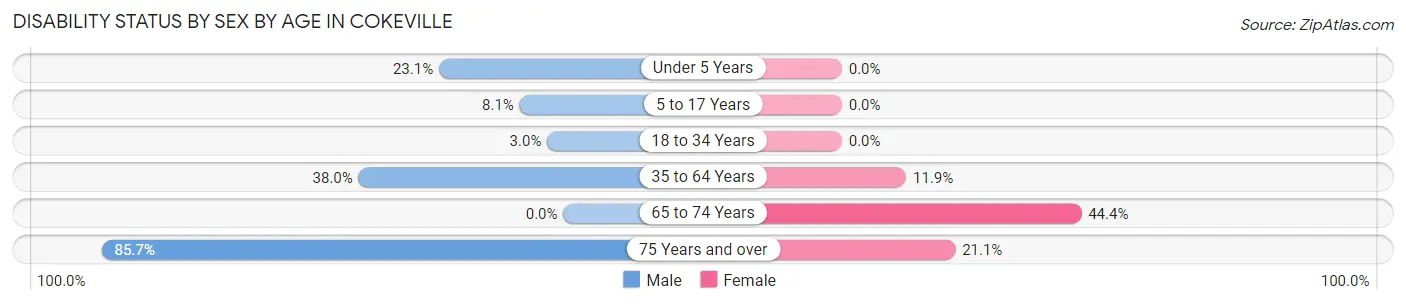
| Age Bracket | Male | Female |
| Under 5 Years | 9 (23.1%) | 0 (0.0%) |
| 5 to 17 Years | 3 (8.1%) | 0 (0.0%) |
| 18 to 34 Years | 2 (3.0%) | 0 (0.0%) |
| 35 to 64 Years | 19 (38.0%) | 8 (11.9%) |
| 65 to 74 Years | 0 (0.0%) | 4 (44.4%) |
| 75 Years and over | 6 (85.7%) | 4 (21.0%) |
Disability Class by Sex by Age in Cokeville
Disability Class: Hearing Difficulty
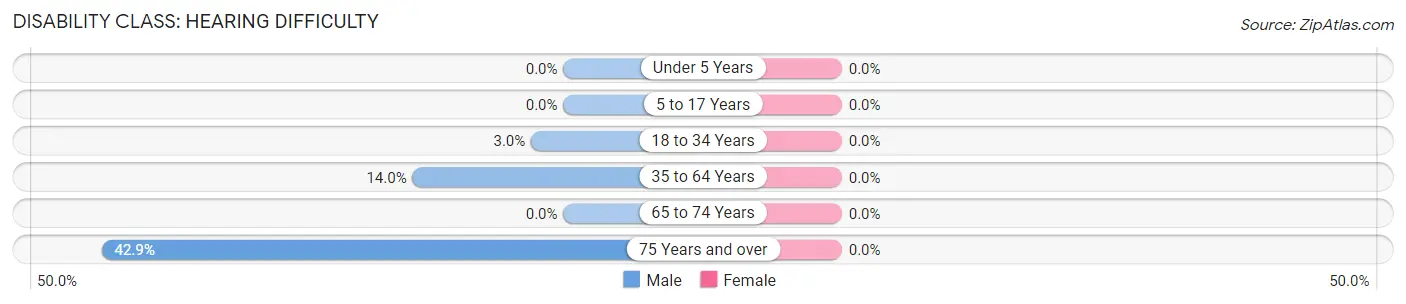
| Age Bracket | Male | Female |
| Under 5 Years | 0 (0.0%) | 0 (0.0%) |
| 5 to 17 Years | 0 (0.0%) | 0 (0.0%) |
| 18 to 34 Years | 2 (3.0%) | 0 (0.0%) |
| 35 to 64 Years | 7 (14.0%) | 0 (0.0%) |
| 65 to 74 Years | 0 (0.0%) | 0 (0.0%) |
| 75 Years and over | 3 (42.9%) | 0 (0.0%) |
Disability Class: Vision Difficulty
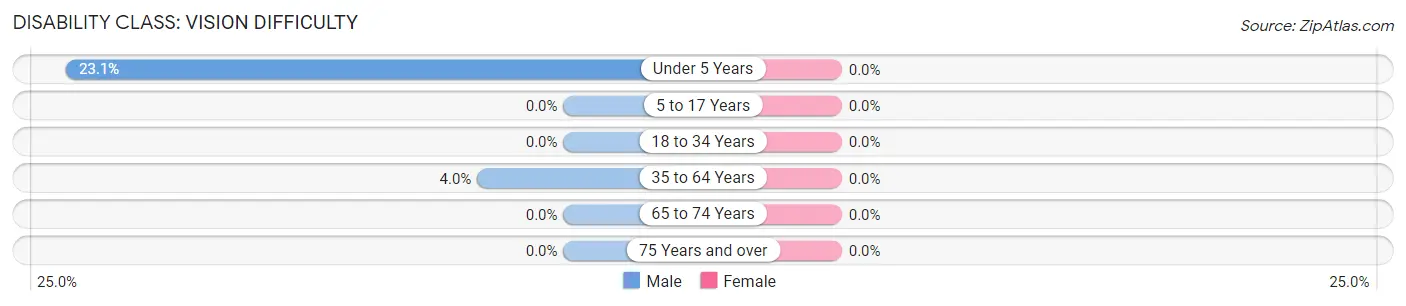
| Age Bracket | Male | Female |
| Under 5 Years | 9 (23.1%) | 0 (0.0%) |
| 5 to 17 Years | 0 (0.0%) | 0 (0.0%) |
| 18 to 34 Years | 0 (0.0%) | 0 (0.0%) |
| 35 to 64 Years | 2 (4.0%) | 0 (0.0%) |
| 65 to 74 Years | 0 (0.0%) | 0 (0.0%) |
| 75 Years and over | 0 (0.0%) | 0 (0.0%) |
Disability Class: Cognitive Difficulty
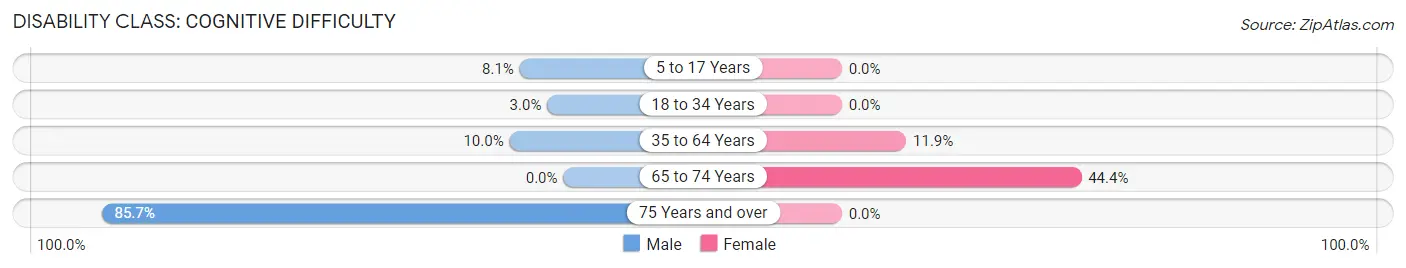
| Age Bracket | Male | Female |
| 5 to 17 Years | 3 (8.1%) | 0 (0.0%) |
| 18 to 34 Years | 2 (3.0%) | 0 (0.0%) |
| 35 to 64 Years | 5 (10.0%) | 8 (11.9%) |
| 65 to 74 Years | 0 (0.0%) | 4 (44.4%) |
| 75 Years and over | 6 (85.7%) | 0 (0.0%) |
Disability Class: Ambulatory Difficulty
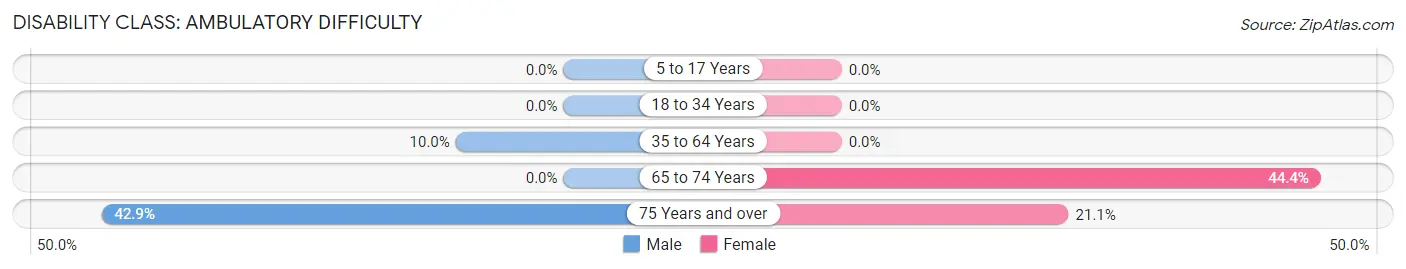
| Age Bracket | Male | Female |
| 5 to 17 Years | 0 (0.0%) | 0 (0.0%) |
| 18 to 34 Years | 0 (0.0%) | 0 (0.0%) |
| 35 to 64 Years | 5 (10.0%) | 0 (0.0%) |
| 65 to 74 Years | 0 (0.0%) | 4 (44.4%) |
| 75 Years and over | 3 (42.9%) | 4 (21.0%) |
Disability Class: Self-Care Difficulty
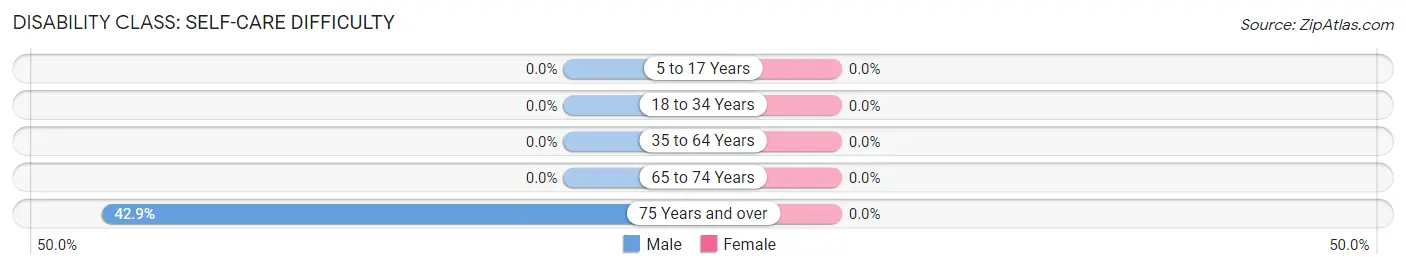
| Age Bracket | Male | Female |
| 5 to 17 Years | 0 (0.0%) | 0 (0.0%) |
| 18 to 34 Years | 0 (0.0%) | 0 (0.0%) |
| 35 to 64 Years | 0 (0.0%) | 0 (0.0%) |
| 65 to 74 Years | 0 (0.0%) | 0 (0.0%) |
| 75 Years and over | 3 (42.9%) | 0 (0.0%) |
Technology Access in Cokeville
Computing Device Access in Cokeville
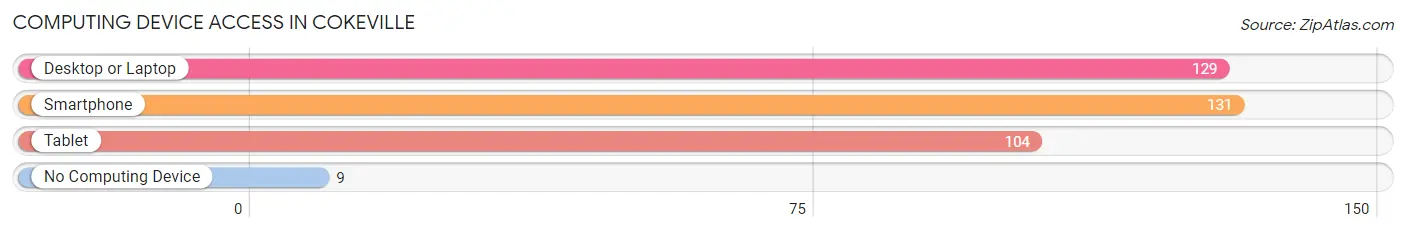
| Device Type | # Households | % Households |
| Desktop or Laptop | 129 | 89.0% |
| Smartphone | 131 | 90.3% |
| Tablet | 104 | 71.7% |
| No Computing Device | 9 | 6.2% |
| Total | 145 | 100.0% |
Internet Access in Cokeville
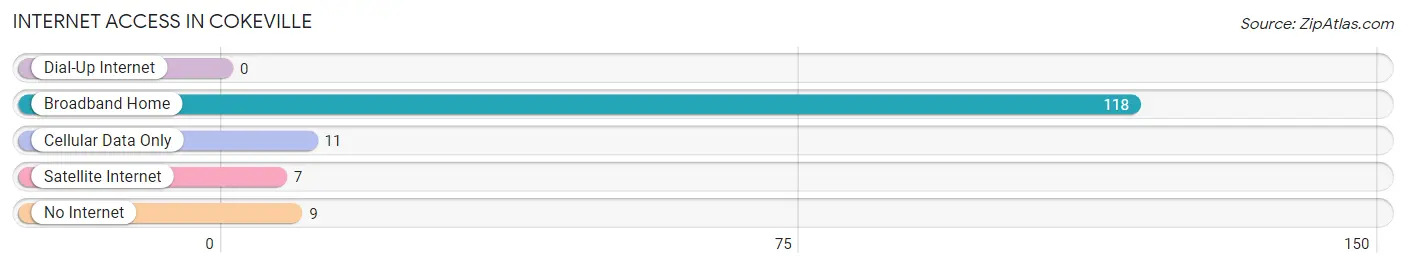
| Internet Type | # Households | % Households |
| Dial-Up Internet | 0 | 0.0% |
| Broadband Home | 118 | 81.4% |
| Cellular Data Only | 11 | 7.6% |
| Satellite Internet | 7 | 4.8% |
| No Internet | 9 | 6.2% |
| Total | 145 | 100.0% |
Cokeville Summary
Cokeville, Wyoming is a small town located in Lincoln County, Wyoming. It is situated in the southwestern part of the state, approximately 30 miles east of the Idaho border. The town was founded in 1882 and is named after the nearby Cokeville Meadows, which were named after a local rancher, William Coke. The town has a population of approximately 500 people and is the county seat of Lincoln County.
Geography
Cokeville is located in the southwestern part of Wyoming, approximately 30 miles east of the Idaho border. The town is situated in the foothills of the Rocky Mountains, at an elevation of 6,000 feet. The town is surrounded by rolling hills and grasslands, with the Snake River running through the area. The climate in Cokeville is semi-arid, with hot summers and cold winters.
Economy
The economy of Cokeville is largely based on agriculture and ranching. The town is home to several large ranches, which produce beef, sheep, and hay. The town also has a small manufacturing sector, which produces a variety of products, including furniture, clothing, and food products. The town also has a small tourism industry, with visitors coming to the area to enjoy the scenery and outdoor activities.
Demographics
As of the 2010 census, the population of Cokeville was 498 people. The racial makeup of the town was 97.2% White, 0.2% African American, 0.2% Native American, 0.2% Asian, 0.2% Pacific Islander, 0.4% from other races, and 1.8% from two or more races. Hispanic or Latino of any race were 1.2% of the population.
The median income for a household in Cokeville was $37,500, and the median income for a family was $41,250. The per capita income for the town was $17,845. About 11.2% of families and 13.2% of the population were below the poverty line, including 16.7% of those under age 18 and 8.3% of those age 65 or over.
History
Cokeville was founded in 1882 and was named after the nearby Cokeville Meadows, which were named after a local rancher, William Coke. The town was originally a small farming and ranching community, but it soon grew to become the county seat of Lincoln County. The town was incorporated in 1887 and has remained a small, rural community ever since.
In the early 1900s, the town was home to several businesses, including a hotel, a bank, a general store, and a post office. The town also had a school, which was built in 1910. The school was later expanded to include a high school, and it is still in operation today.
In the late 20th century, the town experienced a period of growth, as new businesses and industries moved into the area. The town is now home to several businesses, including a grocery store, a hardware store, and a restaurant. The town also has a library, a museum, and a community center.
Cokeville is a small, rural town with a rich history and a bright future. The town is home to a diverse population and a strong economy, and it is a great place to live and work.
Common Questions
What is Per Capita Income in Cokeville?
Per Capita income in Cokeville is $30,193.
What is the Median Family Income in Cokeville?
Median Family Income in Cokeville is $86,125.
What is the Median Household income in Cokeville?
Median Household Income in Cokeville is $81,563.
What is Inequality or Gini Index in Cokeville?
Inequality or Gini Index in Cokeville is 0.35.
What is the Total Population of Cokeville?
Total Population of Cokeville is 423.
What is the Total Male Population of Cokeville?
Total Male Population of Cokeville is 225.
What is the Total Female Population of Cokeville?
Total Female Population of Cokeville is 198.
What is the Ratio of Males per 100 Females in Cokeville?
There are 113.64 Males per 100 Females in Cokeville.
What is the Ratio of Females per 100 Males in Cokeville?
There are 88.00 Females per 100 Males in Cokeville.
What is the Median Population Age in Cokeville?
Median Population Age in Cokeville is 28.5 Years.
What is the Average Family Size in Cokeville
Average Family Size in Cokeville is 3.2 People.
What is the Average Household Size in Cokeville
Average Household Size in Cokeville is 2.9 People.
How Large is the Labor Force in Cokeville?
There are 191 People in the Labor Forcein in Cokeville.
What is the Percentage of People in the Labor Force in Cokeville?
62.2% of People are in the Labor Force in Cokeville.
What is the Unemployment Rate in Cokeville?
Unemployment Rate in Cokeville is 6.8%.