Burlington, WY Map & Demographics
Burlington Map
Burlington Overview
$27,599
PER CAPITA INCOME
$98,000
AVG FAMILY INCOME
$82,188
AVG HOUSEHOLD INCOME
0.29
INEQUALITY / GINI INDEX
249
TOTAL POPULATION
160
MALE POPULATION
89
FEMALE POPULATION
179.78
MALES / 100 FEMALES
55.62
FEMALES / 100 MALES
37.7
MEDIAN AGE
3.9
AVG FAMILY SIZE
3.3
AVG HOUSEHOLD SIZE
119
LABOR FORCE [ PEOPLE ]
62.0%
PERCENT IN LABOR FORCE
4.2%
UNEMPLOYMENT RATE
Burlington Zip Codes
Burlington Area Codes
Income in Burlington
Income Overview in Burlington
Per Capita Income in Burlington is $27,599, while median incomes of families and households are $98,000 and $82,188 respectively.
| Characteristic | Number | Measure |
| Per Capita Income | 249 | $27,599 |
| Median Family Income | 60 | $98,000 |
| Mean Family Income | 60 | $97,163 |
| Median Household Income | 75 | $82,188 |
| Mean Household Income | 75 | $85,504 |
| Income Deficit | 60 | $0 |
| Wage / Income Gap (%) | 249 | 0.00% |
| Wage / Income Gap ($) | 249 | 100.00¢ per $1 |
| Gini / Inequality Index | 249 | 0.29 |
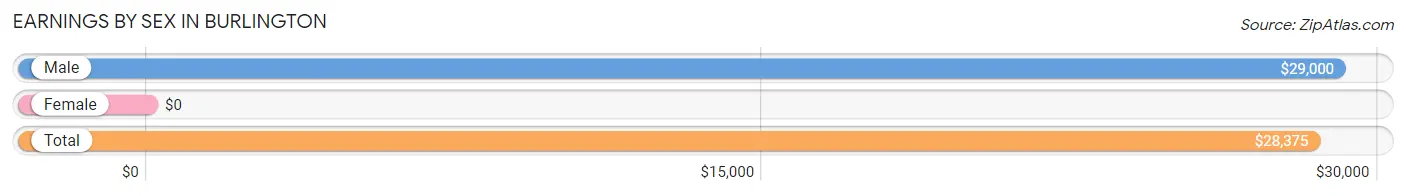
Earnings by Sex in Burlington
| Sex | Number | Average Earnings |
| Male | 76 (63.9%) | $29,000 |
| Female | 43 (36.1%) | $0 |
| Total | 119 (100.0%) | $28,375 |
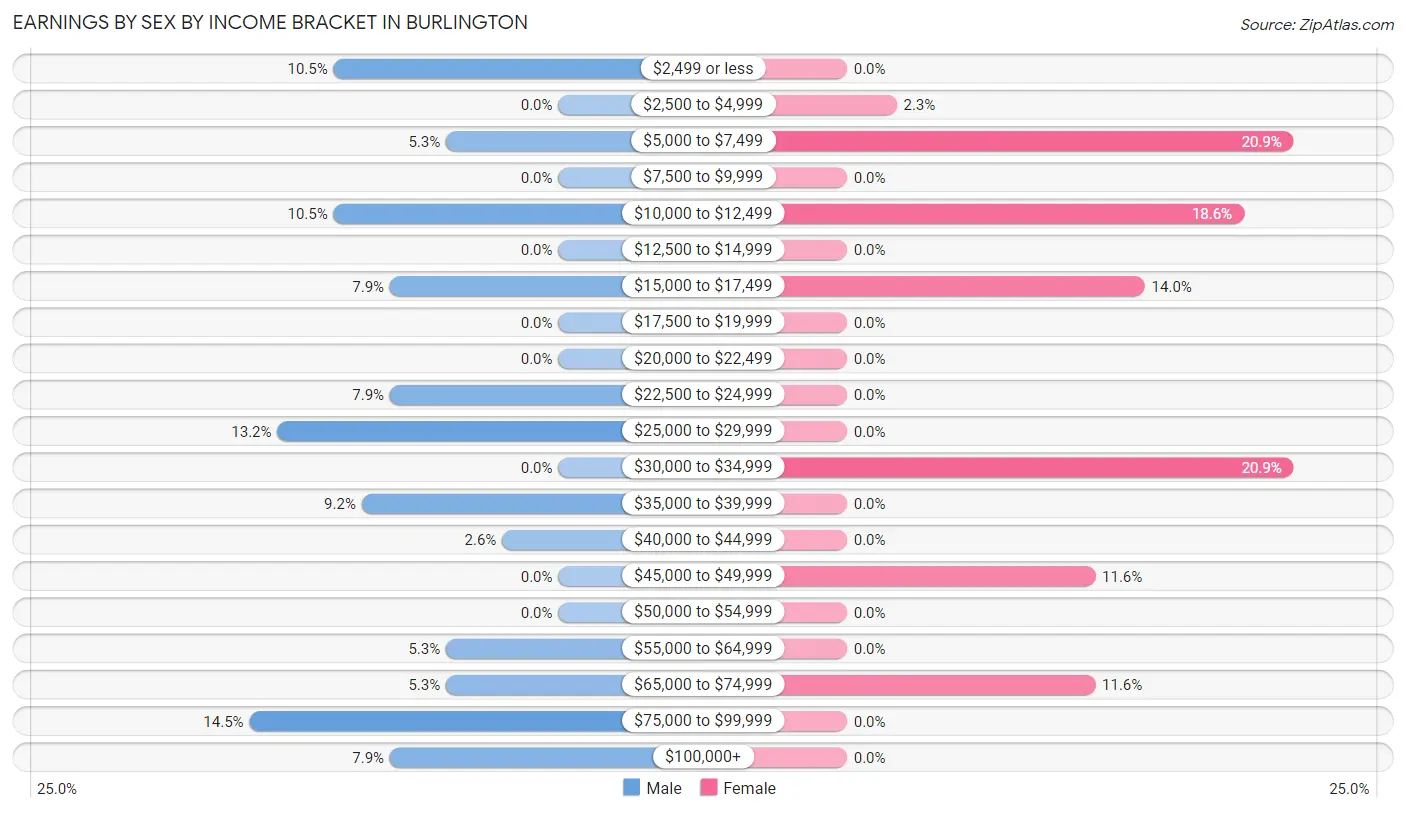
Earnings by Sex by Income Bracket in Burlington
The most common earnings brackets in Burlington are $75,000 to $99,999 for men (11 | 14.5%) and $5,000 to $7,499 for women (9 | 20.9%).
| Income | Male | Female |
| $2,499 or less | 8 (10.5%) | 0 (0.0%) |
| $2,500 to $4,999 | 0 (0.0%) | 1 (2.3%) |
| $5,000 to $7,499 | 4 (5.3%) | 9 (20.9%) |
| $7,500 to $9,999 | 0 (0.0%) | 0 (0.0%) |
| $10,000 to $12,499 | 8 (10.5%) | 8 (18.6%) |
| $12,500 to $14,999 | 0 (0.0%) | 0 (0.0%) |
| $15,000 to $17,499 | 6 (7.9%) | 6 (14.0%) |
| $17,500 to $19,999 | 0 (0.0%) | 0 (0.0%) |
| $20,000 to $22,499 | 0 (0.0%) | 0 (0.0%) |
| $22,500 to $24,999 | 6 (7.9%) | 0 (0.0%) |
| $25,000 to $29,999 | 10 (13.2%) | 0 (0.0%) |
| $30,000 to $34,999 | 0 (0.0%) | 9 (20.9%) |
| $35,000 to $39,999 | 7 (9.2%) | 0 (0.0%) |
| $40,000 to $44,999 | 2 (2.6%) | 0 (0.0%) |
| $45,000 to $49,999 | 0 (0.0%) | 5 (11.6%) |
| $50,000 to $54,999 | 0 (0.0%) | 0 (0.0%) |
| $55,000 to $64,999 | 4 (5.3%) | 0 (0.0%) |
| $65,000 to $74,999 | 4 (5.3%) | 5 (11.6%) |
| $75,000 to $99,999 | 11 (14.5%) | 0 (0.0%) |
| $100,000+ | 6 (7.9%) | 0 (0.0%) |
| Total | 76 (100.0%) | 43 (100.0%) |
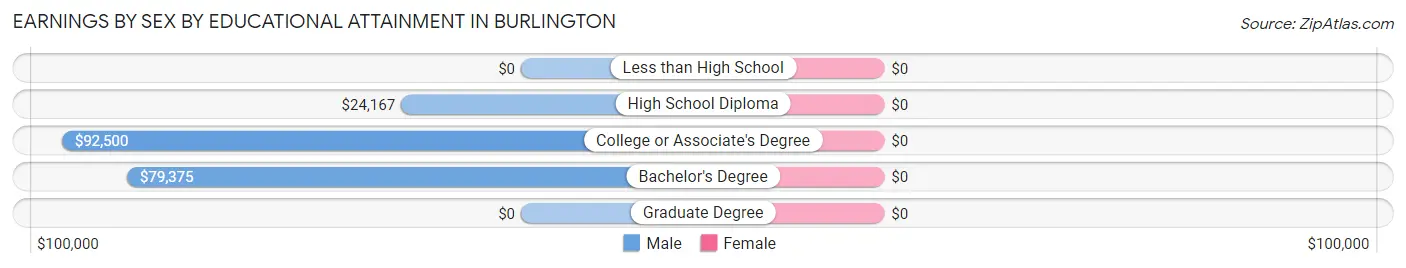
Earnings by Sex by Educational Attainment in Burlington
| Educational Attainment | Male Income | Female Income |
| Less than High School | - | - |
| High School Diploma | $24,167 | $0 |
| College or Associate's Degree | $92,500 | $0 |
| Bachelor's Degree | $79,375 | $0 |
| Graduate Degree | - | - |
| Total | - | - |
Family Income in Burlington
Family Income Brackets in Burlington
According to the Burlington family income data, there are 21 families falling into the $100,000 to $149,999 income range, which is the most common income bracket and makes up 35.0% of all families.
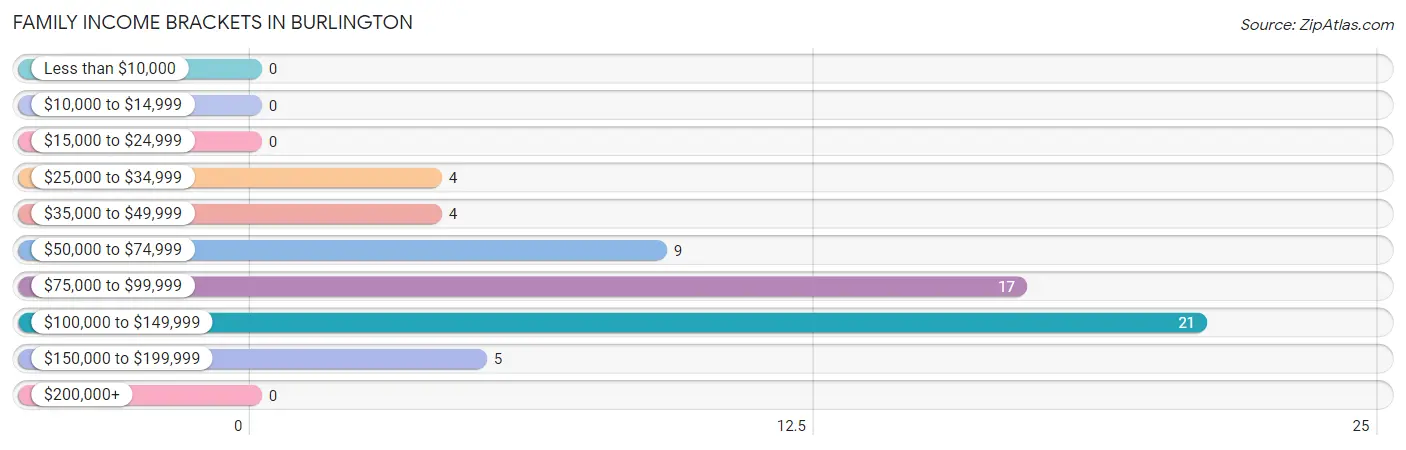
| Income Bracket | # Families | % Families |
| Less than $10,000 | 0 | 0.0% |
| $10,000 to $14,999 | 0 | 0.0% |
| $15,000 to $24,999 | 0 | 0.0% |
| $25,000 to $34,999 | 4 | 6.7% |
| $35,000 to $49,999 | 4 | 6.7% |
| $50,000 to $74,999 | 9 | 15.0% |
| $75,000 to $99,999 | 17 | 28.3% |
| $100,000 to $149,999 | 21 | 35.0% |
| $150,000 to $199,999 | 5 | 8.3% |
| $200,000+ | 0 | 0.0% |
Family Income by Famaliy Size in Burlington
2-person families (34 | 56.7%) account for the highest median family income in Burlington with $116,250 per family, while 2-person families (34 | 56.7%) have the highest median income of $58,125 per family member.
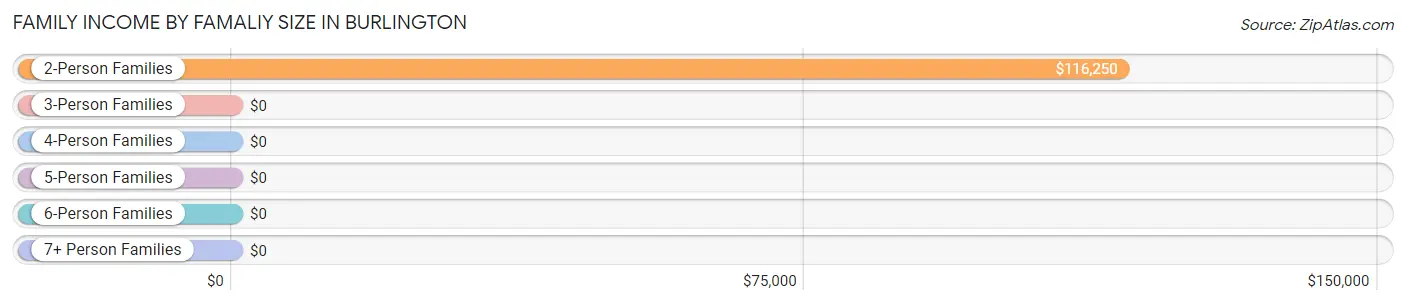
| Income Bracket | # Families | Median Income |
| 2-Person Families | 34 (56.7%) | $116,250 |
| 3-Person Families | 10 (16.7%) | $0 |
| 4-Person Families | 5 (8.3%) | $0 |
| 5-Person Families | 0 (0.0%) | $0 |
| 6-Person Families | 6 (10.0%) | $0 |
| 7+ Person Families | 5 (8.3%) | $0 |
| Total | 60 (100.0%) | $98,000 |
Family Income by Number of Earners in Burlington
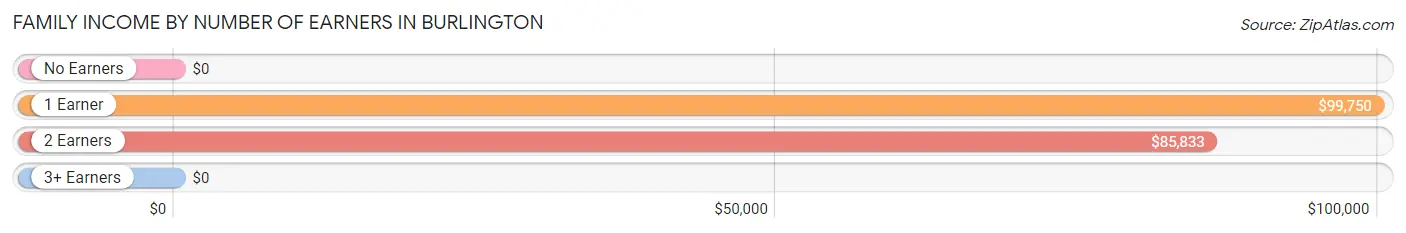
| Number of Earners | # Families | Median Income |
| No Earners | 10 (16.7%) | $0 |
| 1 Earner | 17 (28.3%) | $99,750 |
| 2 Earners | 28 (46.7%) | $85,833 |
| 3+ Earners | 5 (8.3%) | $0 |
| Total | 60 (100.0%) | $98,000 |
Household Income in Burlington
Household Income Brackets in Burlington
With 21 households falling in the category, the $75,000 to $99,999 income range is the most frequent in Burlington, accounting for 28.0% of all households.
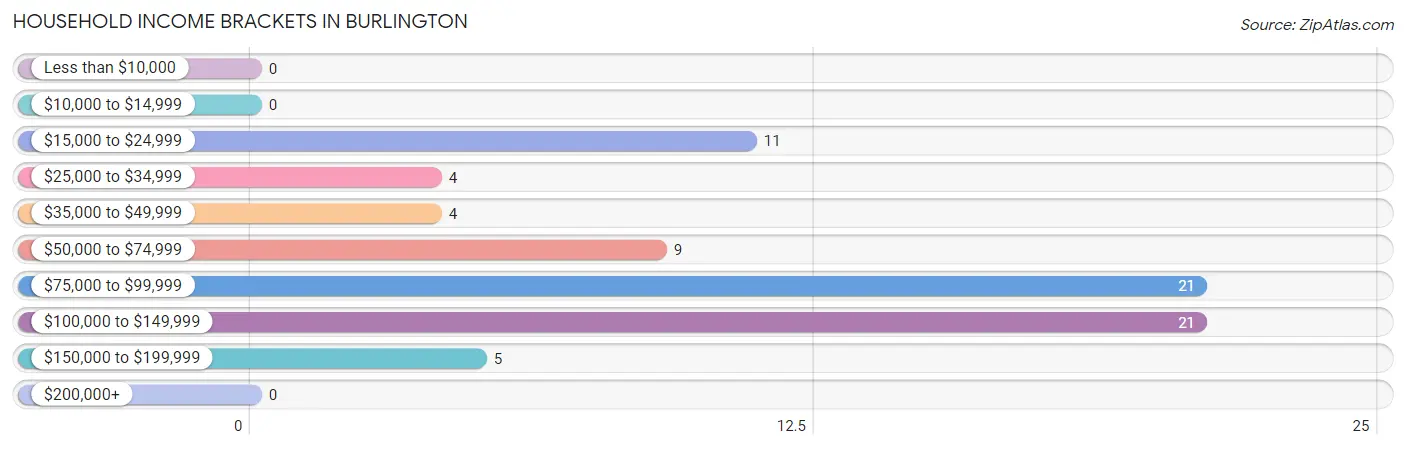
| Income Bracket | # Households | % Households |
| Less than $10,000 | 0 | 0.0% |
| $10,000 to $14,999 | 0 | 0.0% |
| $15,000 to $24,999 | 11 | 14.7% |
| $25,000 to $34,999 | 4 | 5.3% |
| $35,000 to $49,999 | 4 | 5.3% |
| $50,000 to $74,999 | 9 | 12.0% |
| $75,000 to $99,999 | 21 | 28.0% |
| $100,000 to $149,999 | 21 | 28.0% |
| $150,000 to $199,999 | 5 | 6.7% |
| $200,000+ | 0 | 0.0% |
Household Income by Householder Age in Burlington
The median household income in Burlington is $82,188, with the highest median household income of $135,156 found in the 45 to 64 years age bracket for the primary householder. A total of 33 households (44.0%) fall into this category.
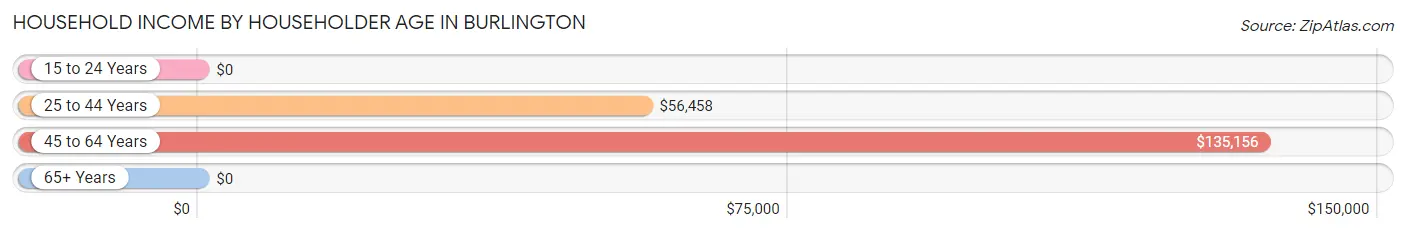
| Income Bracket | # Households | Median Income |
| 15 to 24 Years | 0 (0.0%) | $0 |
| 25 to 44 Years | 27 (36.0%) | $56,458 |
| 45 to 64 Years | 33 (44.0%) | $135,156 |
| 65+ Years | 15 (20.0%) | $0 |
| Total | 75 (100.0%) | $82,188 |
Poverty in Burlington
Income Below Poverty by Sex and Age in Burlington
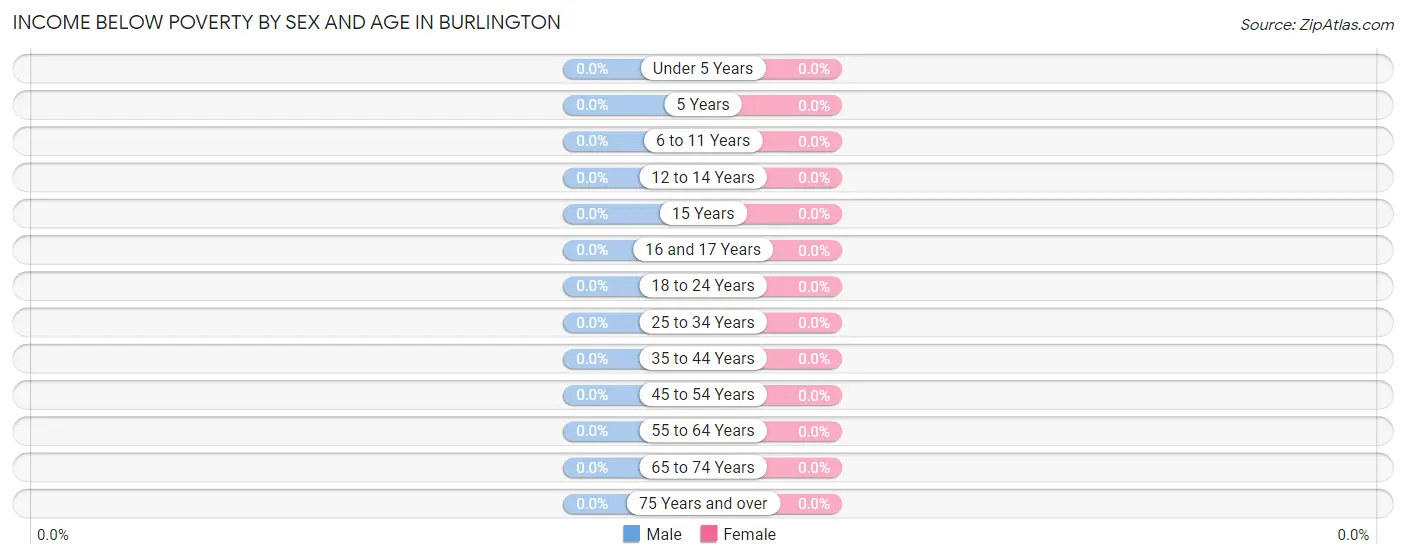
| Age Bracket | Male | Female |
| Under 5 Years | 0 (0.0%) | 0 (0.0%) |
| 5 Years | 0 (0.0%) | 0 (0.0%) |
| 6 to 11 Years | 0 (0.0%) | 0 (0.0%) |
| 12 to 14 Years | 0 (0.0%) | 0 (0.0%) |
| 15 Years | 0 (0.0%) | 0 (0.0%) |
| 16 and 17 Years | 0 (0.0%) | 0 (0.0%) |
| 18 to 24 Years | 0 (0.0%) | 0 (0.0%) |
| 25 to 34 Years | 0 (0.0%) | 0 (0.0%) |
| 35 to 44 Years | 0 (0.0%) | 0 (0.0%) |
| 45 to 54 Years | 0 (0.0%) | 0 (0.0%) |
| 55 to 64 Years | 0 (0.0%) | 0 (0.0%) |
| 65 to 74 Years | 0 (0.0%) | 0 (0.0%) |
| 75 Years and over | 0 (0.0%) | 0 (0.0%) |
| Total | 0 (0.0%) | 0 (0.0%) |
Income Above Poverty by Sex and Age in Burlington
According to the poverty statistics in Burlington, males aged 5 years and females aged under 5 years are the age groups that are most secure financially, with 100.0% of males and 100.0% of females in these age groups living above the poverty line.
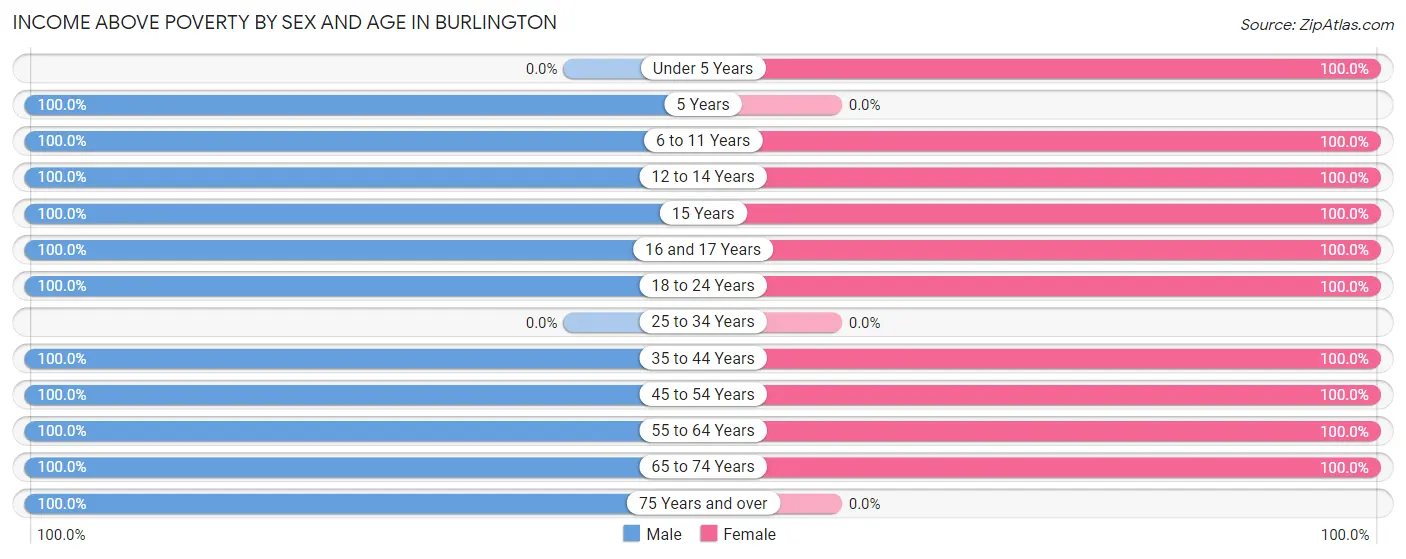
| Age Bracket | Male | Female |
| Under 5 Years | 0 (0.0%) | 6 (100.0%) |
| 5 Years | 5 (100.0%) | 0 (0.0%) |
| 6 to 11 Years | 20 (100.0%) | 4 (100.0%) |
| 12 to 14 Years | 10 (100.0%) | 6 (100.0%) |
| 15 Years | 1 (100.0%) | 5 (100.0%) |
| 16 and 17 Years | 9 (100.0%) | 5 (100.0%) |
| 18 to 24 Years | 38 (100.0%) | 3 (100.0%) |
| 25 to 34 Years | 0 (0.0%) | 0 (0.0%) |
| 35 to 44 Years | 23 (100.0%) | 15 (100.0%) |
| 45 to 54 Years | 12 (100.0%) | 26 (100.0%) |
| 55 to 64 Years | 21 (100.0%) | 9 (100.0%) |
| 65 to 74 Years | 10 (100.0%) | 10 (100.0%) |
| 75 Years and over | 11 (100.0%) | 0 (0.0%) |
| Total | 160 (100.0%) | 89 (100.0%) |
Income Below Poverty Among Married-Couple Families in Burlington
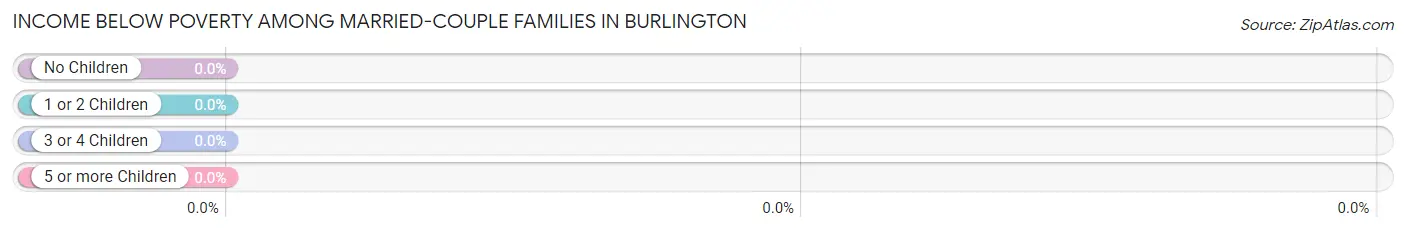
| Children | Above Poverty | Below Poverty |
| No Children | 40 (100.0%) | 0 (0.0%) |
| 1 or 2 Children | 5 (100.0%) | 0 (0.0%) |
| 3 or 4 Children | 6 (100.0%) | 0 (0.0%) |
| 5 or more Children | 5 (100.0%) | 0 (0.0%) |
| Total | 56 (100.0%) | 0 (0.0%) |
Income Below Poverty Among Single-Parent Households in Burlington
| Children | Single Father | Single Mother |
| No Children | 0 (0.0%) | 0 (0.0%) |
| 1 or 2 Children | 0 (0.0%) | 0 (0.0%) |
| 3 or 4 Children | 0 (0.0%) | 0 (0.0%) |
| 5 or more Children | 0 (0.0%) | 0 (0.0%) |
| Total | 0 (0.0%) | 0 (0.0%) |
Income Below Poverty Among Married-Couple vs Single-Parent Households in Burlington
| Children | Married-Couple Families | Single-Parent Households |
| No Children | 0 (0.0%) | 0 (0.0%) |
| 1 or 2 Children | 0 (0.0%) | 0 (0.0%) |
| 3 or 4 Children | 0 (0.0%) | 0 (0.0%) |
| 5 or more Children | 0 (0.0%) | 0 (0.0%) |
| Total | 0 (0.0%) | 0 (0.0%) |
Race in Burlington
The most populous races in Burlington are White / Caucasian (235 | 94.4%), Hispanic or Latino (10 | 4.0%), and Native / Alaskan (8 | 3.2%).
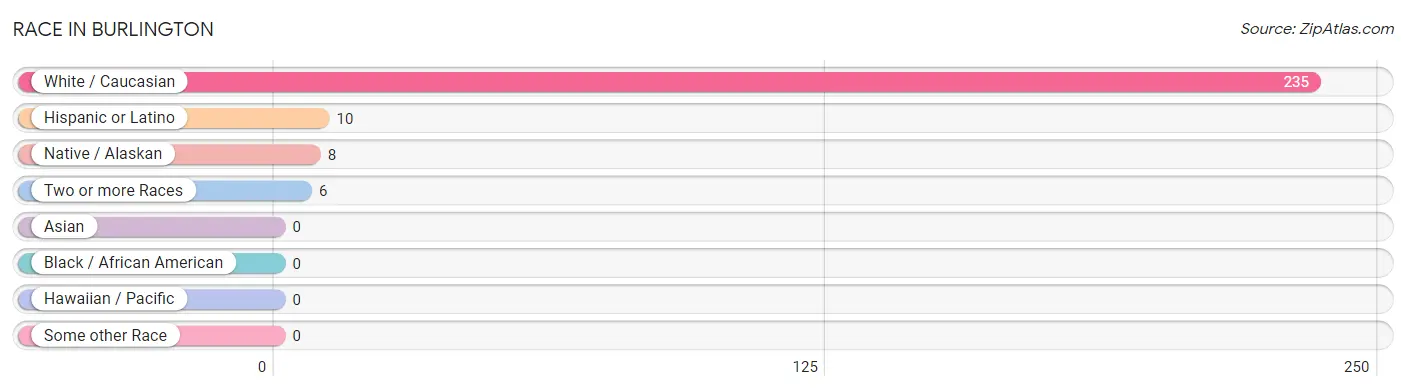
| Race | # Population | % Population |
| Asian | 0 | 0.0% |
| Black / African American | 0 | 0.0% |
| Hawaiian / Pacific | 0 | 0.0% |
| Hispanic or Latino | 10 | 4.0% |
| Native / Alaskan | 8 | 3.2% |
| White / Caucasian | 235 | 94.4% |
| Two or more Races | 6 | 2.4% |
| Some other Race | 0 | 0.0% |
| Total | 249 | 100.0% |
Ancestry in Burlington
The most populous ancestries reported in Burlington are Northern European (73 | 29.3%), English (70 | 28.1%), German (63 | 25.3%), Irish (19 | 7.6%), and Russian (15 | 6.0%), together accounting for 96.4% of all Burlington residents.
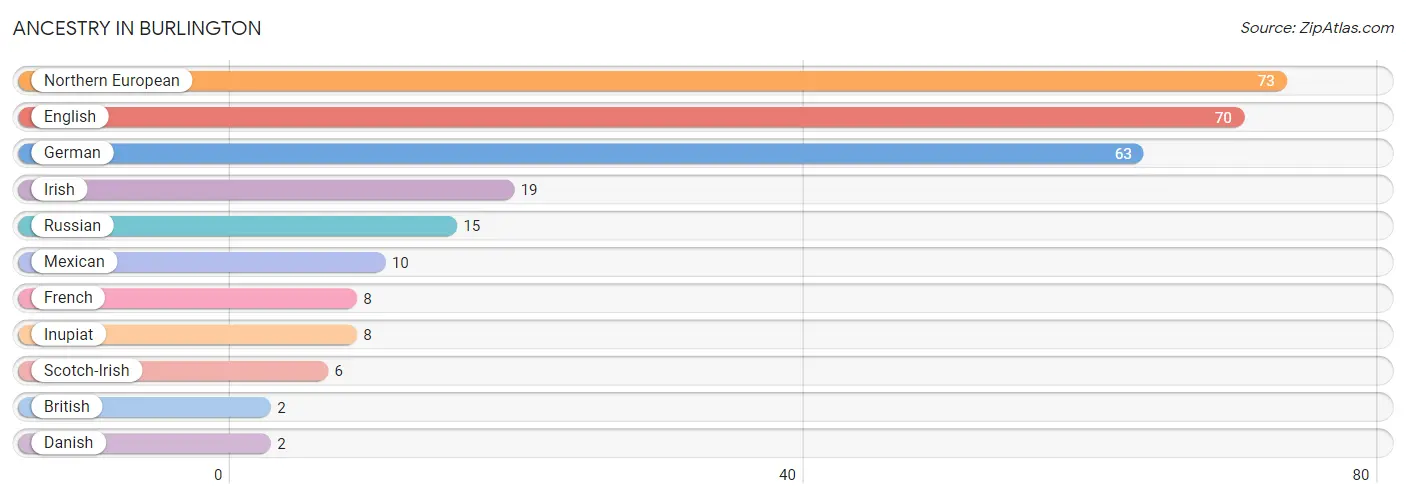
| Ancestry | # Population | % Population |
| British | 2 | 0.8% |
| Danish | 2 | 0.8% |
| English | 70 | 28.1% |
| French | 8 | 3.2% |
| German | 63 | 25.3% |
| Inupiat | 8 | 3.2% |
| Irish | 19 | 7.6% |
| Mexican | 10 | 4.0% |
| Northern European | 73 | 29.3% |
| Russian | 15 | 6.0% |
| Scotch-Irish | 6 | 2.4% | View All 11 Rows |
Immigrants in Burlington
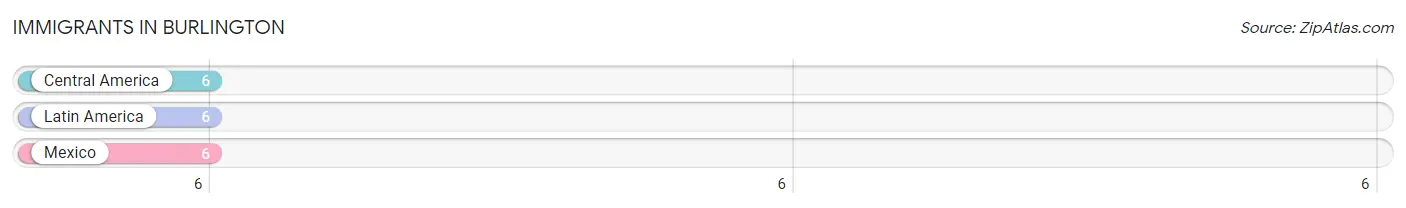
The most numerous immigrant groups reported in Burlington came from Central America (6 | 2.4%), Latin America (6 | 2.4%), and Mexico (6 | 2.4%), together accounting for 7.2% of all Burlington residents.
| Immigration Origin | # Population | % Population |
| Central America | 6 | 2.4% |
| Latin America | 6 | 2.4% |
| Mexico | 6 | 2.4% | View All 3 Rows |
Sex and Age in Burlington
Sex and Age in Burlington
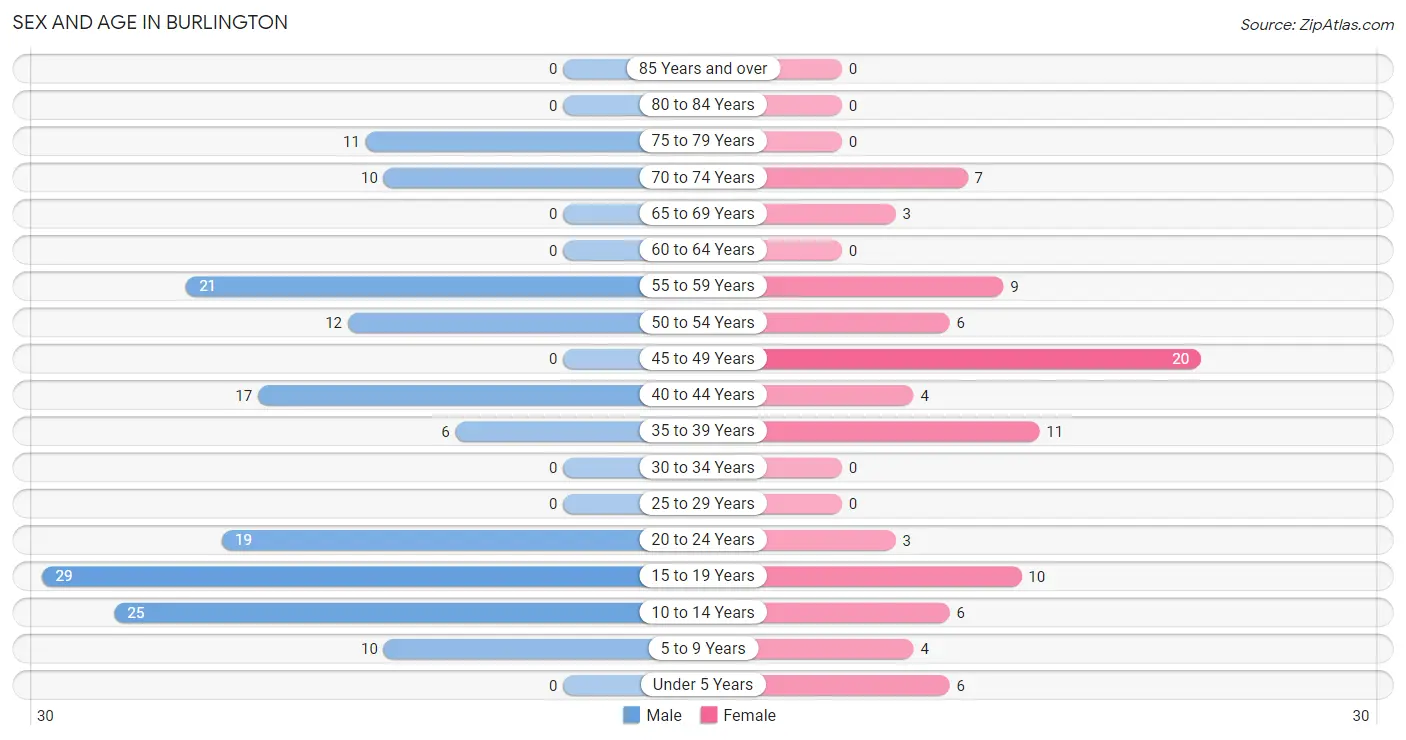
The most populous age groups in Burlington are 15 to 19 Years (29 | 18.1%) for men and 45 to 49 Years (20 | 22.5%) for women.
| Age Bracket | Male | Female |
| Under 5 Years | 0 (0.0%) | 6 (6.7%) |
| 5 to 9 Years | 10 (6.2%) | 4 (4.5%) |
| 10 to 14 Years | 25 (15.6%) | 6 (6.7%) |
| 15 to 19 Years | 29 (18.1%) | 10 (11.2%) |
| 20 to 24 Years | 19 (11.9%) | 3 (3.4%) |
| 25 to 29 Years | 0 (0.0%) | 0 (0.0%) |
| 30 to 34 Years | 0 (0.0%) | 0 (0.0%) |
| 35 to 39 Years | 6 (3.7%) | 11 (12.4%) |
| 40 to 44 Years | 17 (10.6%) | 4 (4.5%) |
| 45 to 49 Years | 0 (0.0%) | 20 (22.5%) |
| 50 to 54 Years | 12 (7.5%) | 6 (6.7%) |
| 55 to 59 Years | 21 (13.1%) | 9 (10.1%) |
| 60 to 64 Years | 0 (0.0%) | 0 (0.0%) |
| 65 to 69 Years | 0 (0.0%) | 3 (3.4%) |
| 70 to 74 Years | 10 (6.2%) | 7 (7.9%) |
| 75 to 79 Years | 11 (6.9%) | 0 (0.0%) |
| 80 to 84 Years | 0 (0.0%) | 0 (0.0%) |
| 85 Years and over | 0 (0.0%) | 0 (0.0%) |
| Total | 160 (100.0%) | 89 (100.0%) |
Families and Households in Burlington
Median Family Size in Burlington
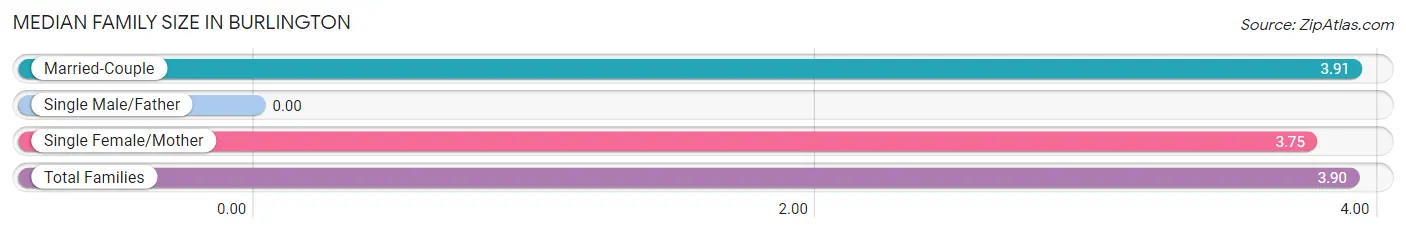
| Family Type | # Families | Family Size |
| Married-Couple | 56 (93.3%) | 3.91 |
| Single Male/Father | 0 (0.0%) | - |
| Single Female/Mother | 4 (6.7%) | 3.75 |
| Total Families | 60 (100.0%) | 3.90 |
Median Household Size in Burlington
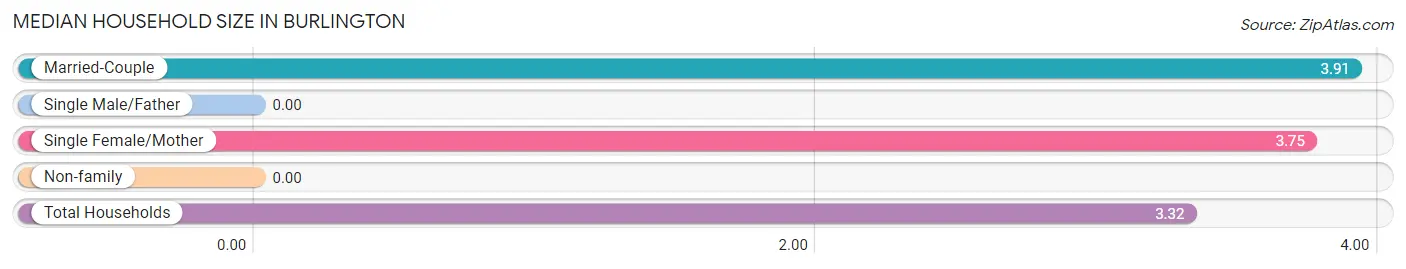
| Household Type | # Households | Household Size |
| Married-Couple | 56 (74.7%) | 3.91 |
| Single Male/Father | 0 (0.0%) | - |
| Single Female/Mother | 4 (5.3%) | 3.75 |
| Non-family | 15 (20.0%) | - |
| Total Households | 75 (100.0%) | 3.32 |
Household Size by Marriage Status in Burlington
Out of a total of 75 households in Burlington, 60 (80.0%) are family households, while 15 (20.0%) are nonfamily households. The most numerous type of family households are 2-person households, comprising 34, and the most common type of nonfamily households are 1-person households, comprising 15.
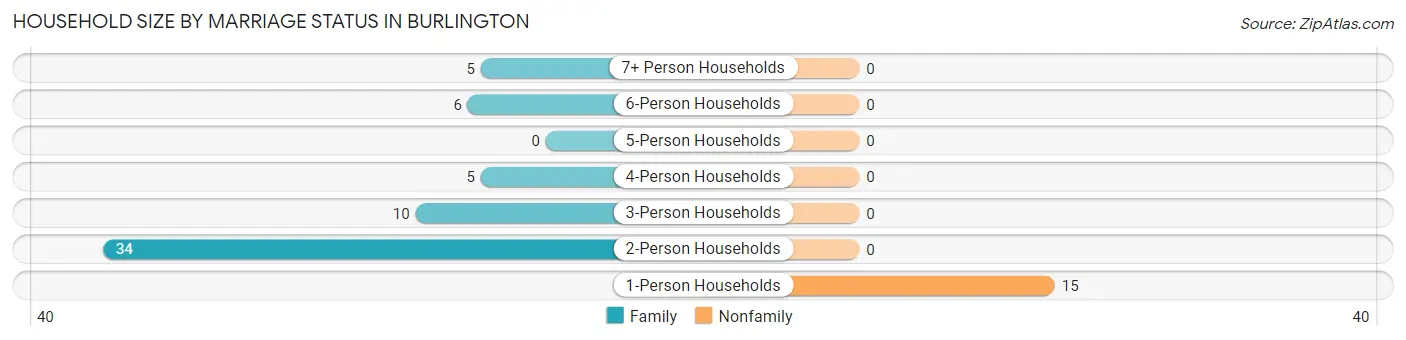
| Household Size | Family Households | Nonfamily Households |
| 1-Person Households | - | 15 (20.0%) |
| 2-Person Households | 34 (45.3%) | 0 (0.0%) |
| 3-Person Households | 10 (13.3%) | 0 (0.0%) |
| 4-Person Households | 5 (6.7%) | 0 (0.0%) |
| 5-Person Households | 0 (0.0%) | 0 (0.0%) |
| 6-Person Households | 6 (8.0%) | 0 (0.0%) |
| 7+ Person Households | 5 (6.7%) | 0 (0.0%) |
| Total | 60 (80.0%) | 15 (20.0%) |
Female Fertility in Burlington
Fertility by Age in Burlington
| Age Bracket | Women with Births | Births / 1,000 Women |
| 15 to 19 years | 0 (0.0%) | 0.0 |
| 20 to 34 years | 0 (0.0%) | 0.0 |
| 35 to 50 years | 0 (0.0%) | 0.0 |
| Total | 0 (0.0%) | 0.0 |
Fertility by Age by Marriage Status in Burlington
| Age Bracket | Married | Unmarried |
| 15 to 19 years | 0 (0.0%) | 0 (0.0%) |
| 20 to 34 years | 0 (0.0%) | 0 (0.0%) |
| 35 to 50 years | 0 (0.0%) | 0 (0.0%) |
| Total | 0 (0.0%) | 0 (0.0%) |
Fertility by Education in Burlington
| Educational Attainment | Women with Births | Births / 1,000 Women |
| Less than High School | 0 (0.0%) | 0.0 |
| High School Diploma | 0 (0.0%) | 0.0 |
| College or Associate's Degree | 0 (0.0%) | 0.0 |
| Bachelor's Degree | 0 (0.0%) | 0.0 |
| Graduate Degree | 0 (0.0%) | 0.0 |
| Total | 0 (0.0%) | 0.0 |
Fertility by Education by Marriage Status in Burlington
| Educational Attainment | Married | Unmarried |
| Less than High School | 0 (0.0%) | 0 (0.0%) |
| High School Diploma | 0 (0.0%) | 0 (0.0%) |
| College or Associate's Degree | 0 (0.0%) | 0 (0.0%) |
| Bachelor's Degree | 0 (0.0%) | 0 (0.0%) |
| Graduate Degree | 0 (0.0%) | 0 (0.0%) |
| Total | 0 (0.0%) | 0 (0.0%) |
Employment Characteristics in Burlington
Employment by Class of Employer in Burlington
Among the 114 employed individuals in Burlington, private company employees (69 | 60.5%), self-employed (not incorporated) (12 | 10.5%), and local government employees (12 | 10.5%) make up the most common classes of employment.
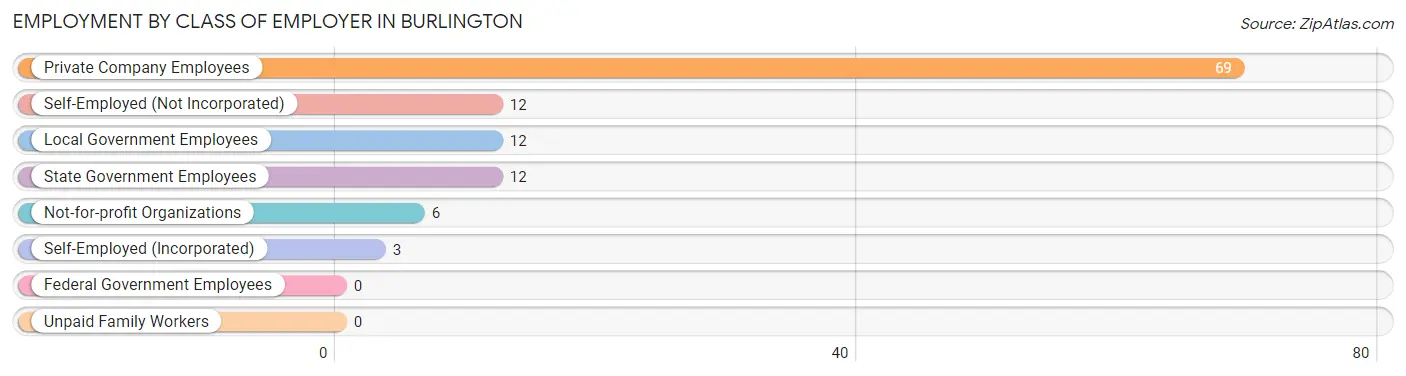
| Employer Class | # Employees | % Employees |
| Private Company Employees | 69 | 60.5% |
| Self-Employed (Incorporated) | 3 | 2.6% |
| Self-Employed (Not Incorporated) | 12 | 10.5% |
| Not-for-profit Organizations | 6 | 5.3% |
| Local Government Employees | 12 | 10.5% |
| State Government Employees | 12 | 10.5% |
| Federal Government Employees | 0 | 0.0% |
| Unpaid Family Workers | 0 | 0.0% |
| Total | 114 | 100.0% |
Employment Status by Age in Burlington
According to the labor force statistics for Burlington, out of the total population over 16 years of age (192), 62.0% or 119 individuals are in the labor force, with 4.2% or 5 of them unemployed. The age group with the highest labor force participation rate is 55 to 59 years, with 100.0% or 30 individuals in the labor force. Within the labor force, the 45 to 54 years age range has the highest percentage of unemployed individuals, with 19.2% or 5 of them being unemployed.
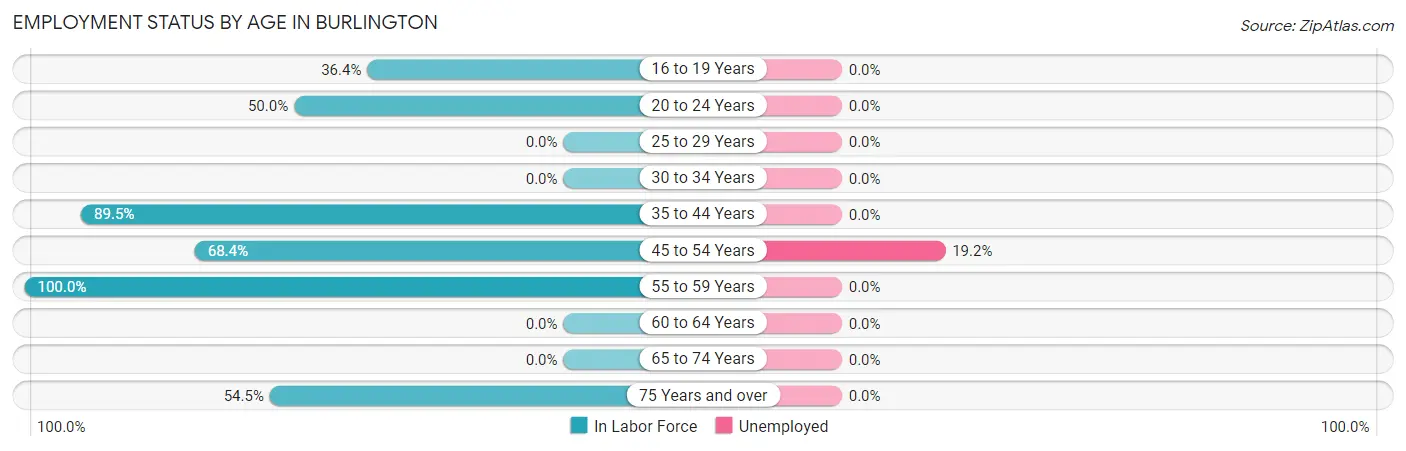
| Age Bracket | In Labor Force | Unemployed |
| 16 to 19 Years | 12 (36.4%) | 0 (0.0%) |
| 20 to 24 Years | 11 (50.0%) | 0 (0.0%) |
| 25 to 29 Years | 0 (0.0%) | 0 (0.0%) |
| 30 to 34 Years | 0 (0.0%) | 0 (0.0%) |
| 35 to 44 Years | 34 (89.5%) | 0 (0.0%) |
| 45 to 54 Years | 26 (68.4%) | 5 (19.2%) |
| 55 to 59 Years | 30 (100.0%) | 0 (0.0%) |
| 60 to 64 Years | 0 (0.0%) | 0 (0.0%) |
| 65 to 74 Years | 0 (0.0%) | 0 (0.0%) |
| 75 Years and over | 6 (54.5%) | 0 (0.0%) |
| Total | 119 (62.0%) | 5 (4.2%) |
Employment Status by Educational Attainment in Burlington
According to labor force statistics for Burlington, 84.9% of individuals (90) out of the total population between 25 and 64 years of age (106) are in the labor force, with 5.6% or 5 of them being unemployed. The group with the highest labor force participation rate are those with the educational attainment of less than high school, with 100.0% or 10 individuals in the labor force. Within the labor force, individuals with bachelor's degree or higher education have the highest percentage of unemployment, with 16.7% or 5 of them being unemployed.
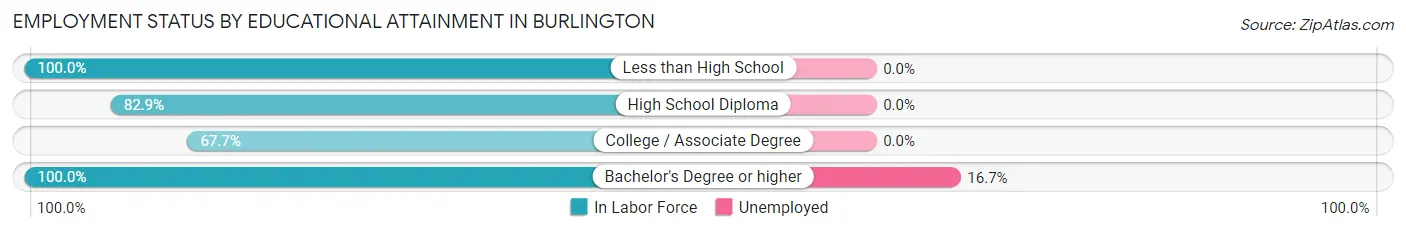
| Educational Attainment | In Labor Force | Unemployed |
| Less than High School | 10 (100.0%) | 0 (0.0%) |
| High School Diploma | 29 (82.9%) | 0 (0.0%) |
| College / Associate Degree | 21 (67.7%) | 0 (0.0%) |
| Bachelor's Degree or higher | 30 (100.0%) | 5 (16.7%) |
| Total | 90 (84.9%) | 6 (5.6%) |
Employment Occupations by Sex in Burlington
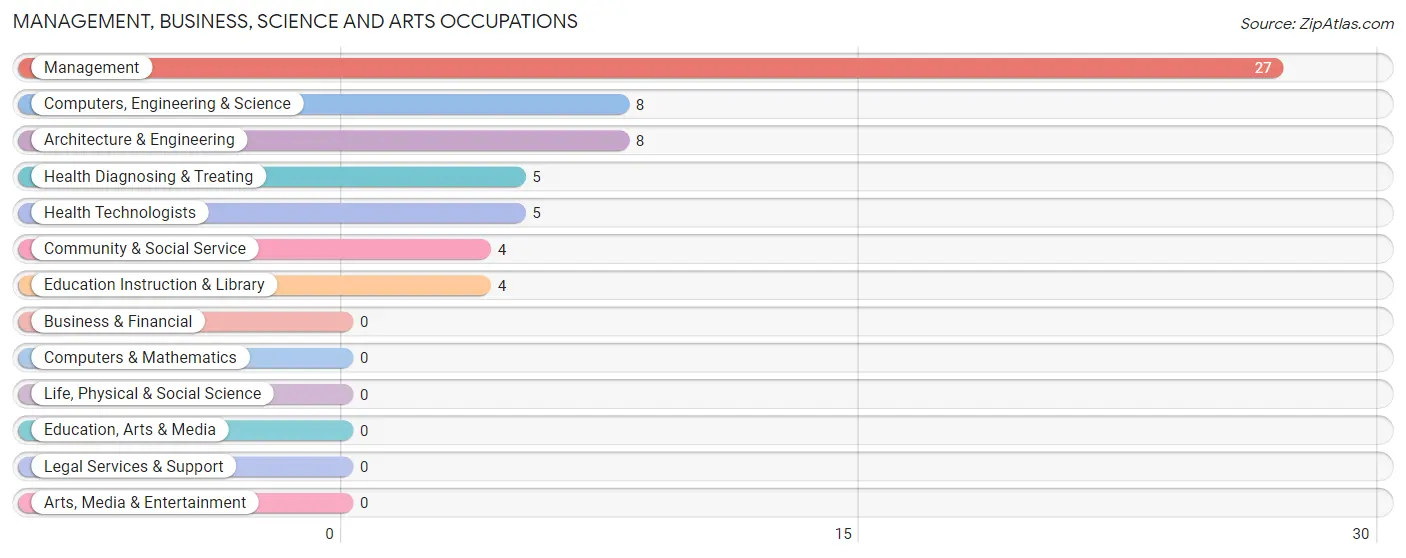
Management, Business, Science and Arts Occupations
The most common Management, Business, Science and Arts occupations in Burlington are Management (27 | 23.7%), Computers, Engineering & Science (8 | 7.0%), Architecture & Engineering (8 | 7.0%), Health Diagnosing & Treating (5 | 4.4%), and Health Technologists (5 | 4.4%).
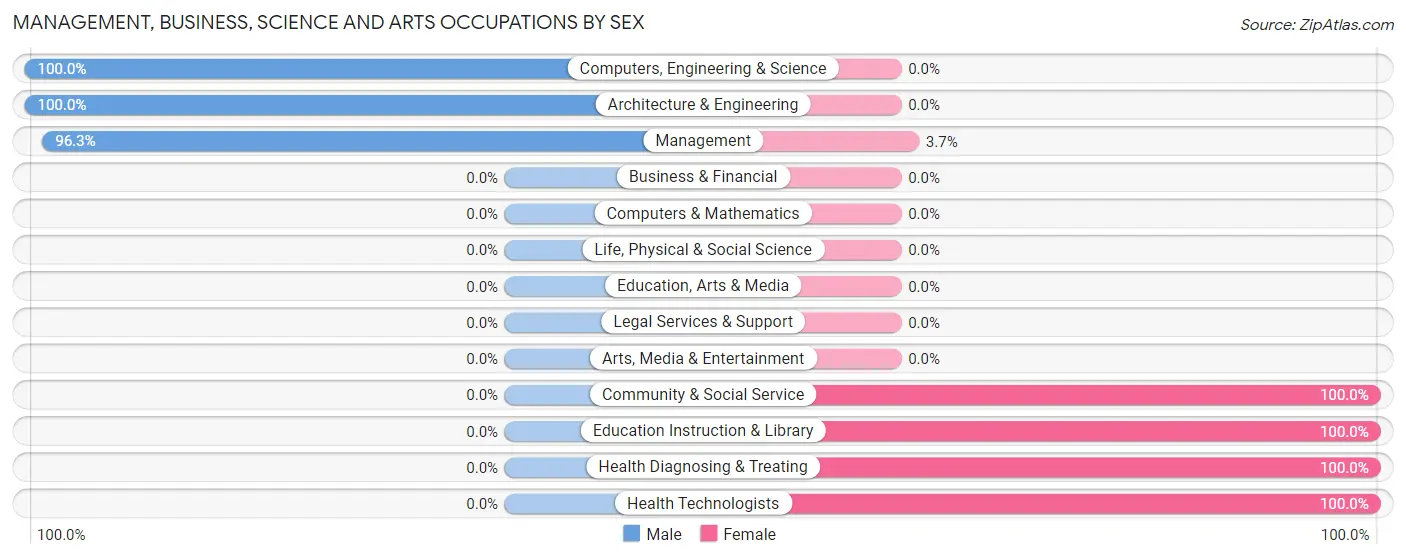
Management, Business, Science and Arts Occupations by Sex
Within the Management, Business, Science and Arts occupations in Burlington, the most male-oriented occupations are Computers, Engineering & Science (100.0%), Architecture & Engineering (100.0%), and Management (96.3%), while the most female-oriented occupations are Community & Social Service (100.0%), Education Instruction & Library (100.0%), and Health Diagnosing & Treating (100.0%).
| Occupation | Male | Female |
| Management | 26 (96.3%) | 1 (3.7%) |
| Business & Financial | 0 (0.0%) | 0 (0.0%) |
| Computers, Engineering & Science | 8 (100.0%) | 0 (0.0%) |
| Computers & Mathematics | 0 (0.0%) | 0 (0.0%) |
| Architecture & Engineering | 8 (100.0%) | 0 (0.0%) |
| Life, Physical & Social Science | 0 (0.0%) | 0 (0.0%) |
| Community & Social Service | 0 (0.0%) | 4 (100.0%) |
| Education, Arts & Media | 0 (0.0%) | 0 (0.0%) |
| Legal Services & Support | 0 (0.0%) | 0 (0.0%) |
| Education Instruction & Library | 0 (0.0%) | 4 (100.0%) |
| Arts, Media & Entertainment | 0 (0.0%) | 0 (0.0%) |
| Health Diagnosing & Treating | 0 (0.0%) | 5 (100.0%) |
| Health Technologists | 0 (0.0%) | 5 (100.0%) |
| Total (Category) | 34 (77.3%) | 10 (22.7%) |
| Total (Overall) | 76 (66.7%) | 38 (33.3%) |
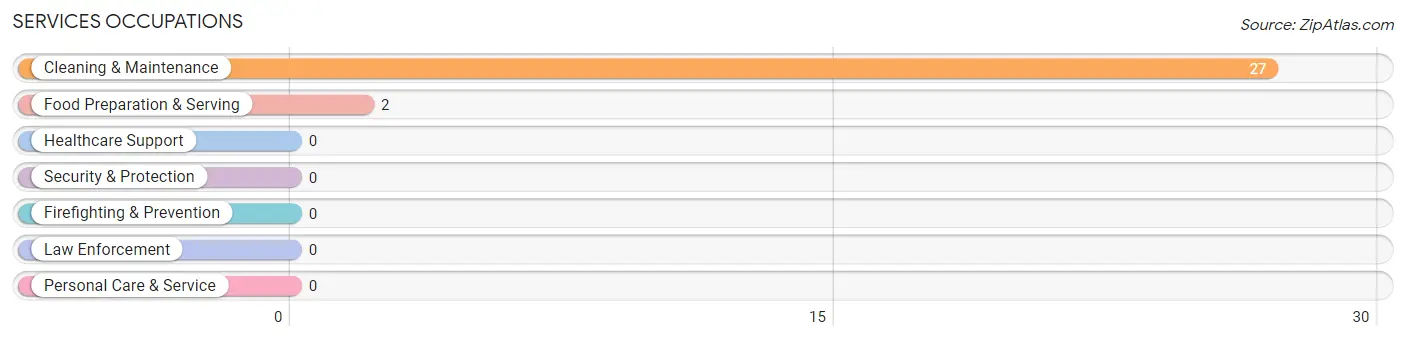
Services Occupations
The most common Services occupations in Burlington are Cleaning & Maintenance (27 | 23.7%), and Food Preparation & Serving (2 | 1.8%).
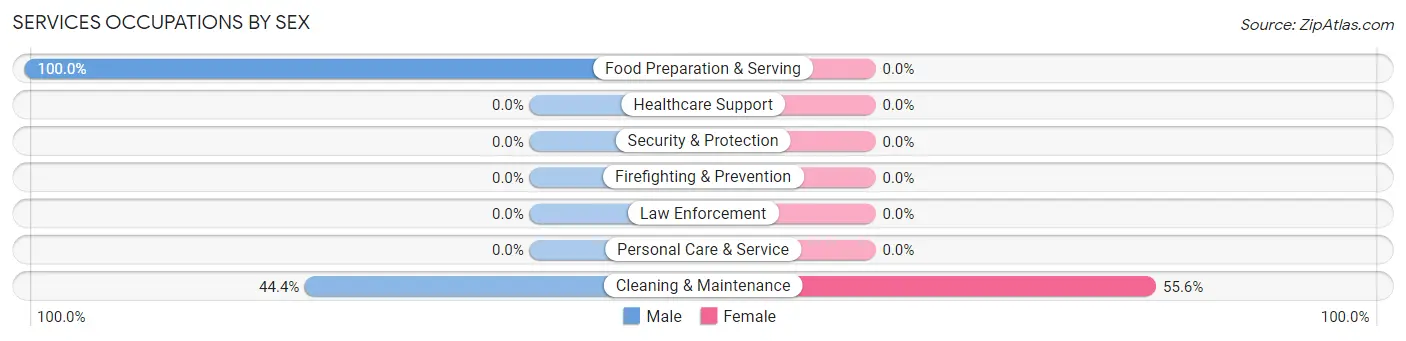
Services Occupations by Sex
| Occupation | Male | Female |
| Healthcare Support | 0 (0.0%) | 0 (0.0%) |
| Security & Protection | 0 (0.0%) | 0 (0.0%) |
| Firefighting & Prevention | 0 (0.0%) | 0 (0.0%) |
| Law Enforcement | 0 (0.0%) | 0 (0.0%) |
| Food Preparation & Serving | 2 (100.0%) | 0 (0.0%) |
| Cleaning & Maintenance | 12 (44.4%) | 15 (55.6%) |
| Personal Care & Service | 0 (0.0%) | 0 (0.0%) |
| Total (Category) | 14 (48.3%) | 15 (51.7%) |
| Total (Overall) | 76 (66.7%) | 38 (33.3%) |
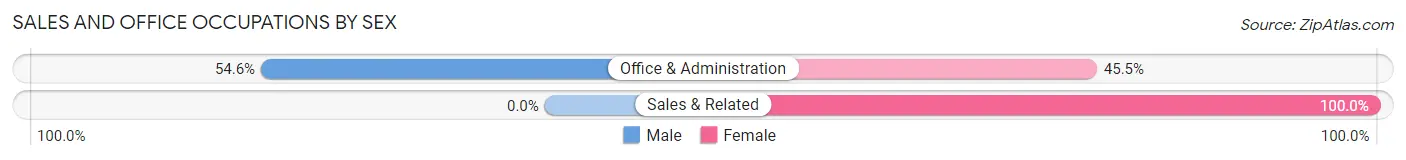
Sales and Office Occupations
The most common Sales and Office occupations in Burlington are Office & Administration (11 | 9.7%), and Sales & Related (5 | 4.4%).
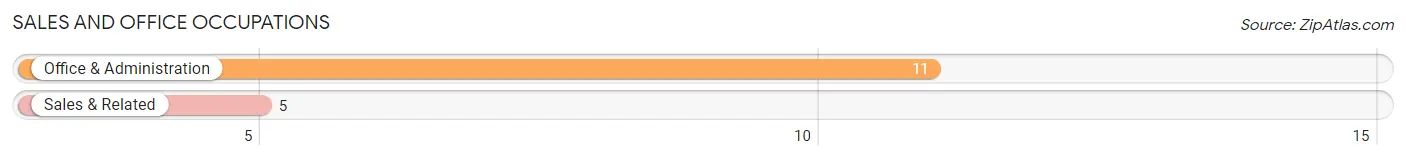
Sales and Office Occupations by Sex
| Occupation | Male | Female |
| Sales & Related | 0 (0.0%) | 5 (100.0%) |
| Office & Administration | 6 (54.5%) | 5 (45.5%) |
| Total (Category) | 6 (37.5%) | 10 (62.5%) |
| Total (Overall) | 76 (66.7%) | 38 (33.3%) |
Natural Resources, Construction and Maintenance Occupations
The most common Natural Resources, Construction and Maintenance occupations in Burlington are Construction & Extraction (11 | 9.7%), Farming, Fishing & Forestry (10 | 8.8%), and Installation, Maintenance & Repair (4 | 3.5%).
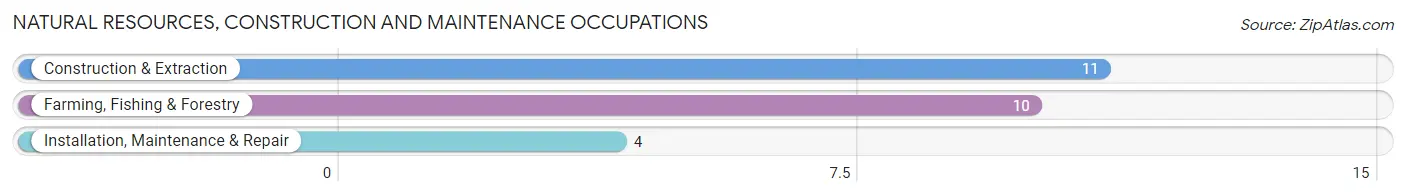
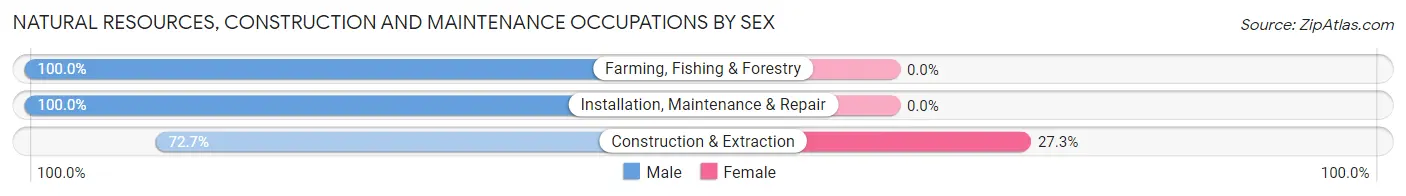
Natural Resources, Construction and Maintenance Occupations by Sex
| Occupation | Male | Female |
| Farming, Fishing & Forestry | 10 (100.0%) | 0 (0.0%) |
| Construction & Extraction | 8 (72.7%) | 3 (27.3%) |
| Installation, Maintenance & Repair | 4 (100.0%) | 0 (0.0%) |
| Total (Category) | 22 (88.0%) | 3 (12.0%) |
| Total (Overall) | 76 (66.7%) | 38 (33.3%) |
Production, Transportation and Moving Occupations
Production, Transportation and Moving Occupations by Sex
| Occupation | Male | Female |
| Production | 0 (0.0%) | 0 (0.0%) |
| Transportation | 0 (0.0%) | 0 (0.0%) |
| Material Moving | 0 (0.0%) | 0 (0.0%) |
| Total (Category) | 0 (0.0%) | 0 (0.0%) |
| Total (Overall) | 76 (66.7%) | 38 (33.3%) |
Employment Industries by Sex in Burlington
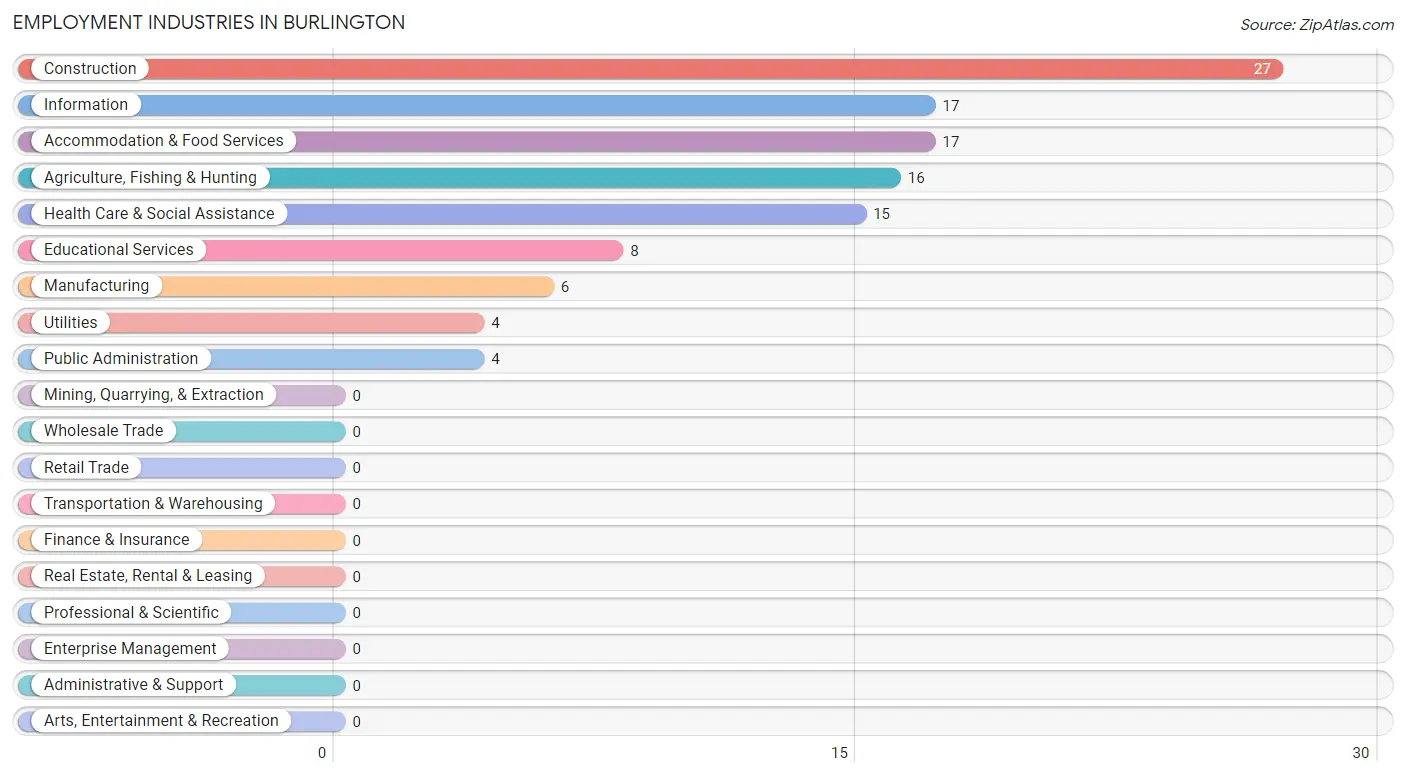
Employment Industries in Burlington
The major employment industries in Burlington include Construction (27 | 23.7%), Information (17 | 14.9%), Accommodation & Food Services (17 | 14.9%), Agriculture, Fishing & Hunting (16 | 14.0%), and Health Care & Social Assistance (15 | 13.2%).
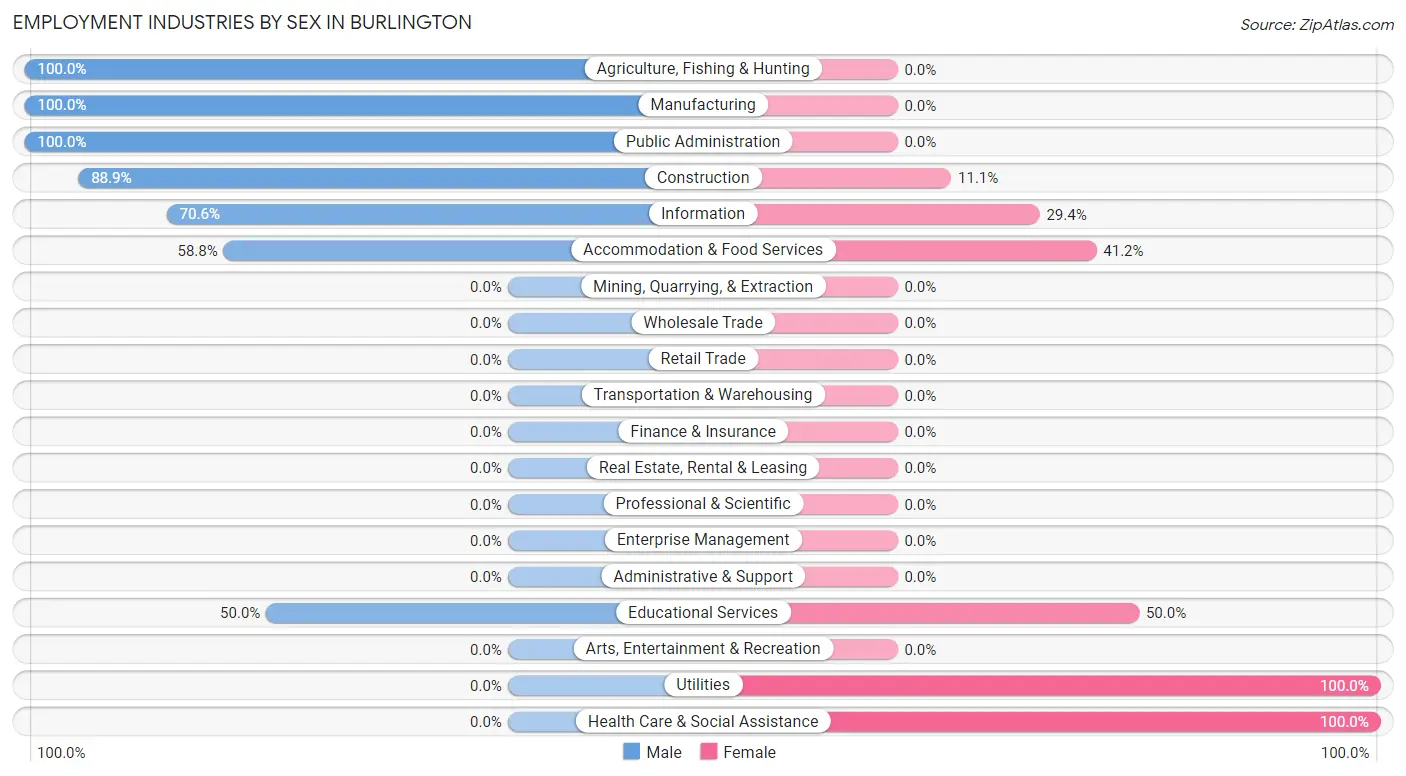
Employment Industries by Sex in Burlington
The Burlington industries that see more men than women are Agriculture, Fishing & Hunting (100.0%), Manufacturing (100.0%), and Public Administration (100.0%), whereas the industries that tend to have a higher number of women are Utilities (100.0%), Health Care & Social Assistance (100.0%), and Educational Services (50.0%).
| Industry | Male | Female |
| Agriculture, Fishing & Hunting | 16 (100.0%) | 0 (0.0%) |
| Mining, Quarrying, & Extraction | 0 (0.0%) | 0 (0.0%) |
| Construction | 24 (88.9%) | 3 (11.1%) |
| Manufacturing | 6 (100.0%) | 0 (0.0%) |
| Wholesale Trade | 0 (0.0%) | 0 (0.0%) |
| Retail Trade | 0 (0.0%) | 0 (0.0%) |
| Transportation & Warehousing | 0 (0.0%) | 0 (0.0%) |
| Utilities | 0 (0.0%) | 4 (100.0%) |
| Information | 12 (70.6%) | 5 (29.4%) |
| Finance & Insurance | 0 (0.0%) | 0 (0.0%) |
| Real Estate, Rental & Leasing | 0 (0.0%) | 0 (0.0%) |
| Professional & Scientific | 0 (0.0%) | 0 (0.0%) |
| Enterprise Management | 0 (0.0%) | 0 (0.0%) |
| Administrative & Support | 0 (0.0%) | 0 (0.0%) |
| Educational Services | 4 (50.0%) | 4 (50.0%) |
| Health Care & Social Assistance | 0 (0.0%) | 15 (100.0%) |
| Arts, Entertainment & Recreation | 0 (0.0%) | 0 (0.0%) |
| Accommodation & Food Services | 10 (58.8%) | 7 (41.2%) |
| Public Administration | 4 (100.0%) | 0 (0.0%) |
| Total | 76 (66.7%) | 38 (33.3%) |
Education in Burlington
School Enrollment in Burlington
The most common levels of schooling among the 90 students in Burlington are college / undergraduate (30 | 33.3%), middle school (21 | 23.3%), and high school (20 | 22.2%).
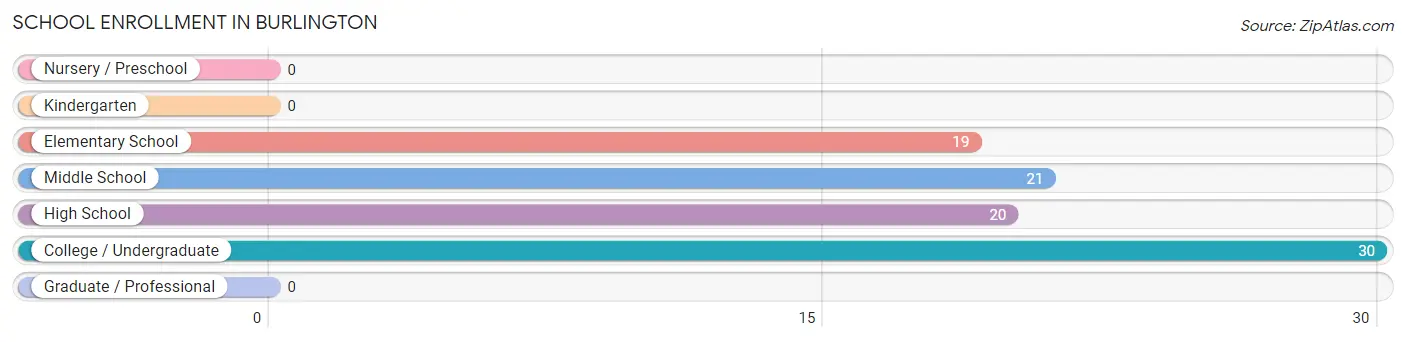
| School Level | # Students | % Students |
| Nursery / Preschool | 0 | 0.0% |
| Kindergarten | 0 | 0.0% |
| Elementary School | 19 | 21.1% |
| Middle School | 21 | 23.3% |
| High School | 20 | 22.2% |
| College / Undergraduate | 30 | 33.3% |
| Graduate / Professional | 0 | 0.0% |
| Total | 90 | 100.0% |
School Enrollment by Age by Funding Source in Burlington
Out of a total of 90 students who are enrolled in schools in Burlington, 11 (12.2%) attend a private institution, while the remaining 79 (87.8%) are enrolled in public schools. The age group of 20 to 24 year olds has the highest likelihood of being enrolled in private schools, with 11 (50.0% in the age bracket) enrolled. Conversely, the age group of 5 to 9 year old has the lowest likelihood of being enrolled in a private school, with 9 (100.0% in the age bracket) attending a public institution.
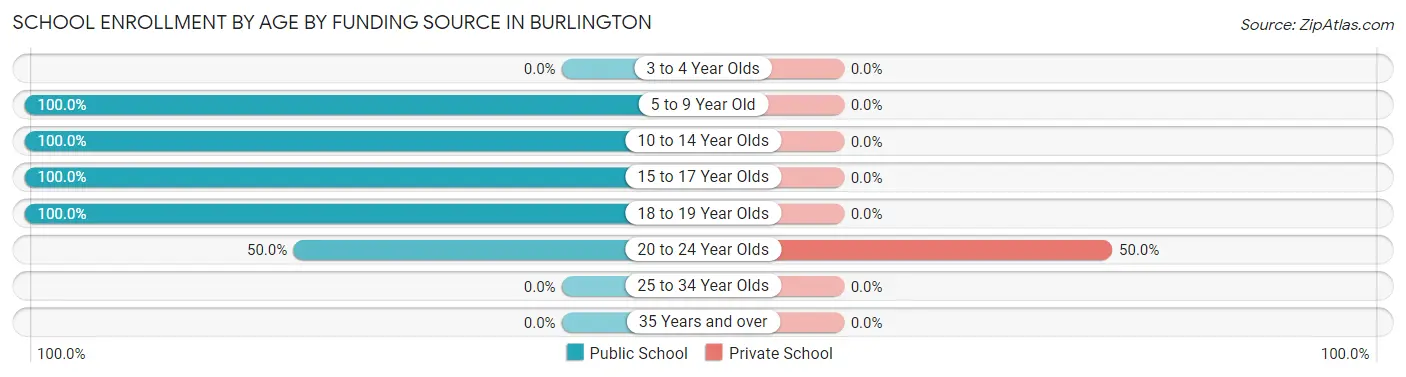
| Age Bracket | Public School | Private School |
| 3 to 4 Year Olds | 0 (0.0%) | 0 (0.0%) |
| 5 to 9 Year Old | 9 (100.0%) | 0 (0.0%) |
| 10 to 14 Year Olds | 31 (100.0%) | 0 (0.0%) |
| 15 to 17 Year Olds | 20 (100.0%) | 0 (0.0%) |
| 18 to 19 Year Olds | 8 (100.0%) | 0 (0.0%) |
| 20 to 24 Year Olds | 11 (50.0%) | 11 (50.0%) |
| 25 to 34 Year Olds | 0 (0.0%) | 0 (0.0%) |
| 35 Years and over | 0 (0.0%) | 0 (0.0%) |
| Total | 79 (87.8%) | 11 (12.2%) |
Educational Attainment by Field of Study in Burlington
Education (22 | 35.5%), business (12 | 19.4%), engineering (11 | 17.7%), science & technology (10 | 16.1%), and arts & humanities (5 | 8.1%) are the most common fields of study among 62 individuals in Burlington who have obtained a bachelor's degree or higher.
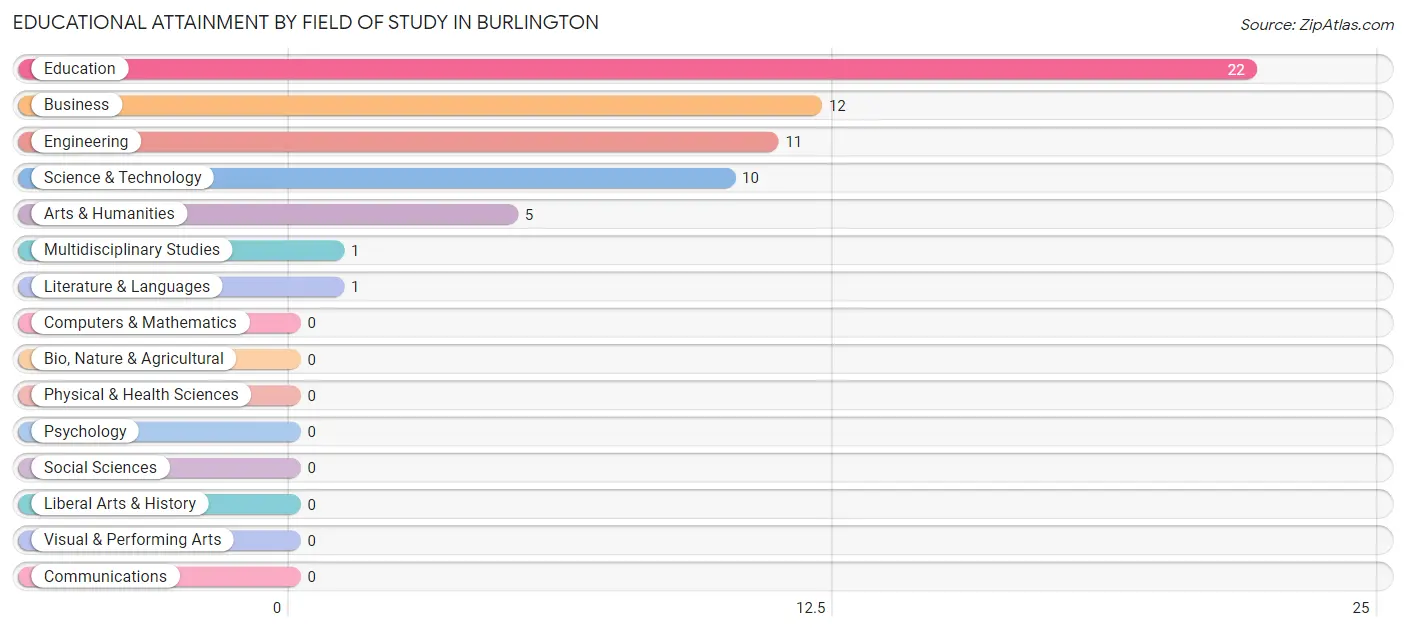
| Field of Study | # Graduates | % Graduates |
| Computers & Mathematics | 0 | 0.0% |
| Bio, Nature & Agricultural | 0 | 0.0% |
| Physical & Health Sciences | 0 | 0.0% |
| Psychology | 0 | 0.0% |
| Social Sciences | 0 | 0.0% |
| Engineering | 11 | 17.7% |
| Multidisciplinary Studies | 1 | 1.6% |
| Science & Technology | 10 | 16.1% |
| Business | 12 | 19.4% |
| Education | 22 | 35.5% |
| Literature & Languages | 1 | 1.6% |
| Liberal Arts & History | 0 | 0.0% |
| Visual & Performing Arts | 0 | 0.0% |
| Communications | 0 | 0.0% |
| Arts & Humanities | 5 | 8.1% |
| Total | 62 | 100.0% |
Transportation & Commute in Burlington
Vehicle Availability by Sex in Burlington
The most prevalent vehicle ownership categories in Burlington are males with 3 vehicles (23, accounting for 30.3%) and females with 3 vehicles (19, making up 60.5%).
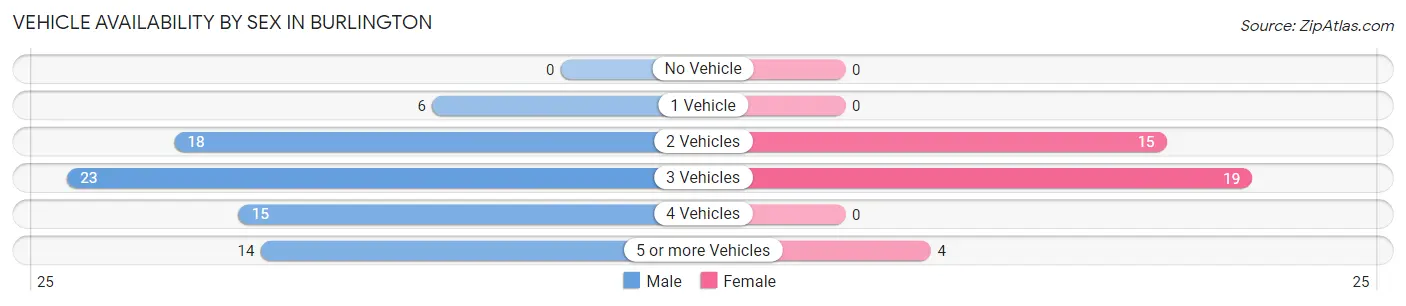
| Vehicles Available | Male | Female |
| No Vehicle | 0 (0.0%) | 0 (0.0%) |
| 1 Vehicle | 6 (7.9%) | 0 (0.0%) |
| 2 Vehicles | 18 (23.7%) | 15 (39.5%) |
| 3 Vehicles | 23 (30.3%) | 19 (50.0%) |
| 4 Vehicles | 15 (19.7%) | 0 (0.0%) |
| 5 or more Vehicles | 14 (18.4%) | 4 (10.5%) |
| Total | 76 (100.0%) | 38 (100.0%) |
Commute Time in Burlington
The most frequently occuring commute durations in Burlington are 30 to 34 minutes (25 commuters, 26.0%), 5 to 9 minutes (23 commuters, 24.0%), and 15 to 19 minutes (20 commuters, 20.8%).
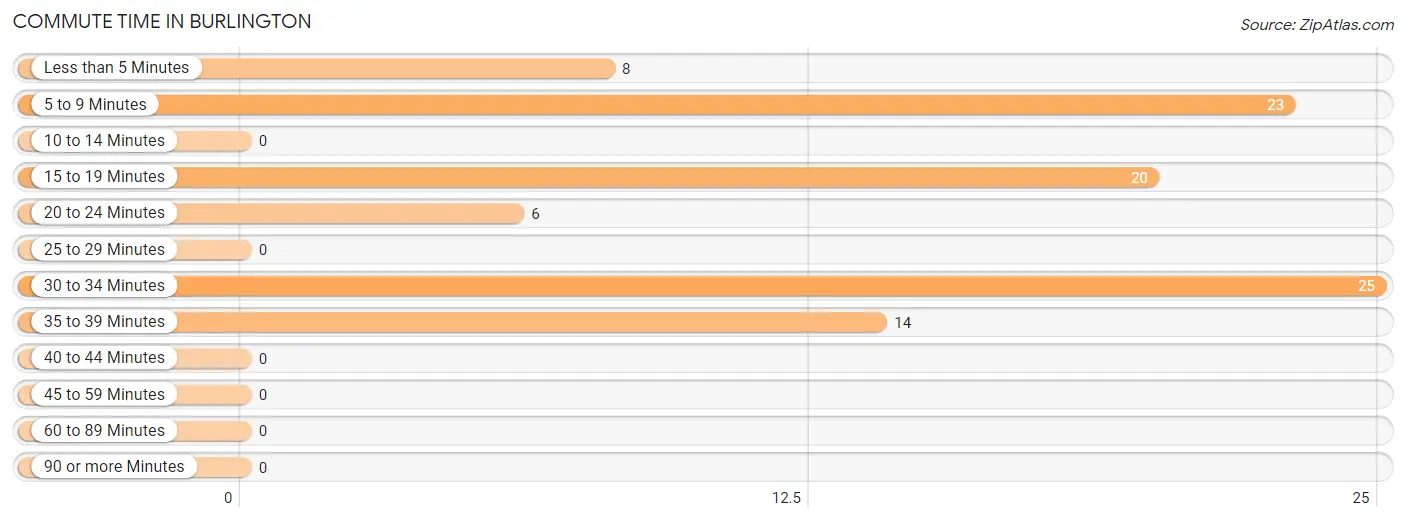
| Commute Time | # Commuters | % Commuters |
| Less than 5 Minutes | 8 | 8.3% |
| 5 to 9 Minutes | 23 | 24.0% |
| 10 to 14 Minutes | 0 | 0.0% |
| 15 to 19 Minutes | 20 | 20.8% |
| 20 to 24 Minutes | 6 | 6.2% |
| 25 to 29 Minutes | 0 | 0.0% |
| 30 to 34 Minutes | 25 | 26.0% |
| 35 to 39 Minutes | 14 | 14.6% |
| 40 to 44 Minutes | 0 | 0.0% |
| 45 to 59 Minutes | 0 | 0.0% |
| 60 to 89 Minutes | 0 | 0.0% |
| 90 or more Minutes | 0 | 0.0% |
Commute Time by Sex in Burlington
The most common commute times in Burlington are 15 to 19 minutes (20 commuters, 31.8%) for males and 30 to 34 minutes (20 commuters, 60.6%) for females.
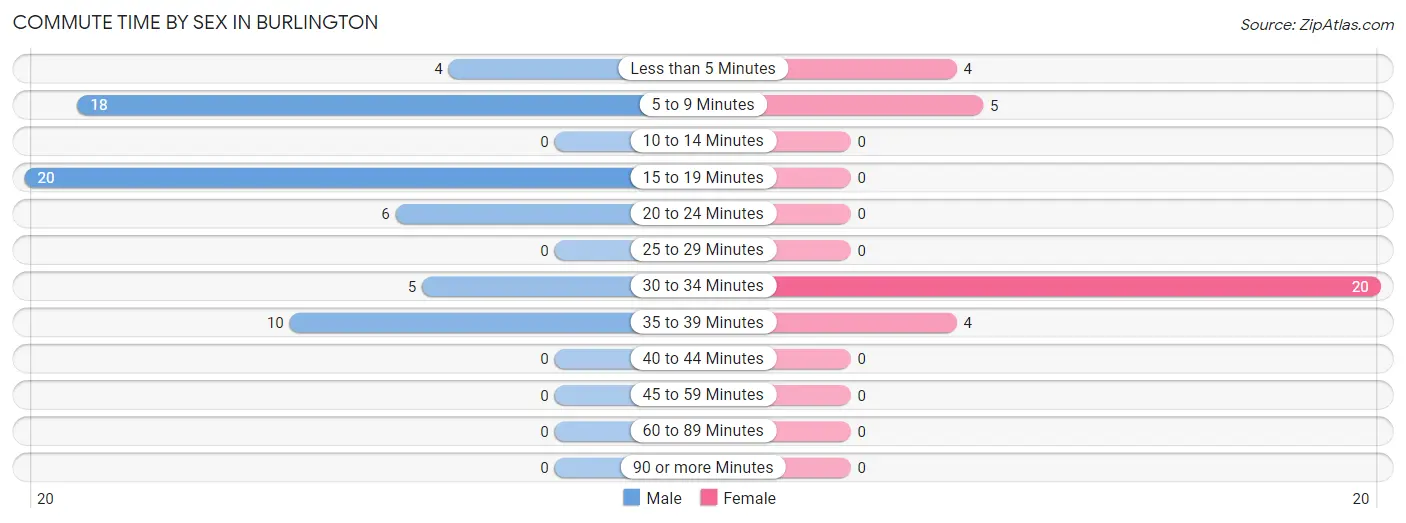
| Commute Time | Male | Female |
| Less than 5 Minutes | 4 (6.4%) | 4 (12.1%) |
| 5 to 9 Minutes | 18 (28.6%) | 5 (15.1%) |
| 10 to 14 Minutes | 0 (0.0%) | 0 (0.0%) |
| 15 to 19 Minutes | 20 (31.8%) | 0 (0.0%) |
| 20 to 24 Minutes | 6 (9.5%) | 0 (0.0%) |
| 25 to 29 Minutes | 0 (0.0%) | 0 (0.0%) |
| 30 to 34 Minutes | 5 (7.9%) | 20 (60.6%) |
| 35 to 39 Minutes | 10 (15.9%) | 4 (12.1%) |
| 40 to 44 Minutes | 0 (0.0%) | 0 (0.0%) |
| 45 to 59 Minutes | 0 (0.0%) | 0 (0.0%) |
| 60 to 89 Minutes | 0 (0.0%) | 0 (0.0%) |
| 90 or more Minutes | 0 (0.0%) | 0 (0.0%) |
Time of Departure to Work by Sex in Burlington
The most frequent times of departure to work in Burlington are 7:00 AM to 7:29 AM (22, 34.9%) for males and 6:30 AM to 6:59 AM (9, 27.3%) for females.
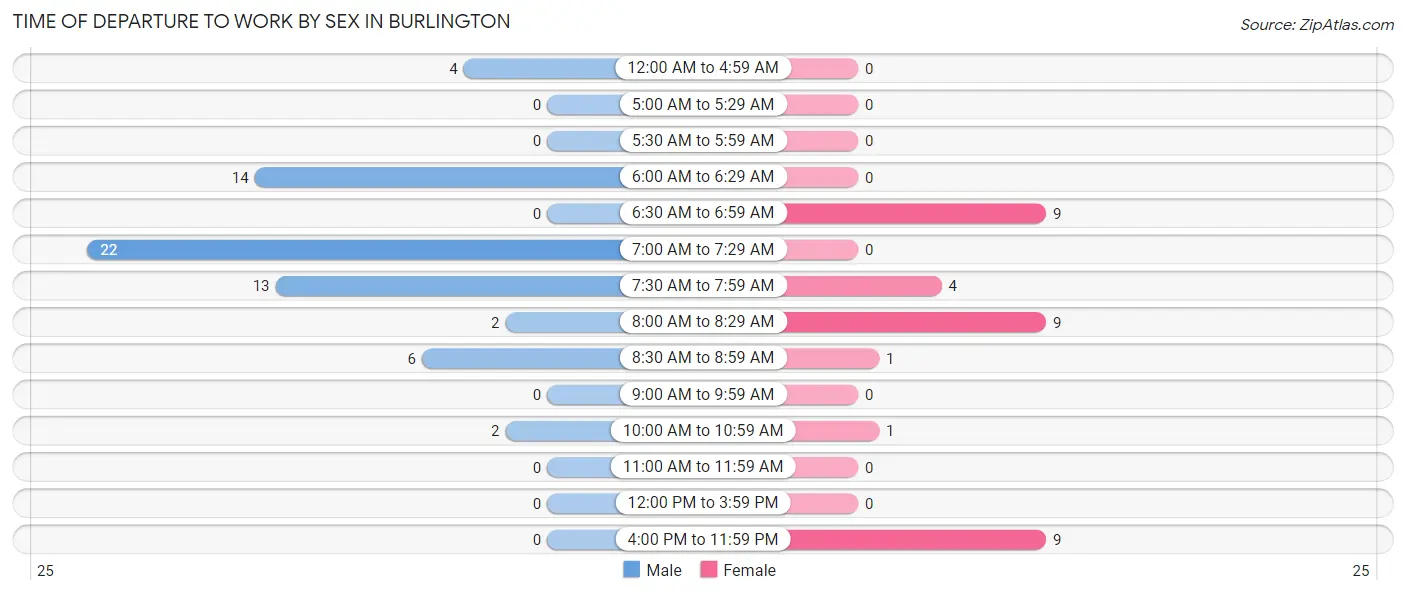
| Time of Departure | Male | Female |
| 12:00 AM to 4:59 AM | 4 (6.4%) | 0 (0.0%) |
| 5:00 AM to 5:29 AM | 0 (0.0%) | 0 (0.0%) |
| 5:30 AM to 5:59 AM | 0 (0.0%) | 0 (0.0%) |
| 6:00 AM to 6:29 AM | 14 (22.2%) | 0 (0.0%) |
| 6:30 AM to 6:59 AM | 0 (0.0%) | 9 (27.3%) |
| 7:00 AM to 7:29 AM | 22 (34.9%) | 0 (0.0%) |
| 7:30 AM to 7:59 AM | 13 (20.6%) | 4 (12.1%) |
| 8:00 AM to 8:29 AM | 2 (3.2%) | 9 (27.3%) |
| 8:30 AM to 8:59 AM | 6 (9.5%) | 1 (3.0%) |
| 9:00 AM to 9:59 AM | 0 (0.0%) | 0 (0.0%) |
| 10:00 AM to 10:59 AM | 2 (3.2%) | 1 (3.0%) |
| 11:00 AM to 11:59 AM | 0 (0.0%) | 0 (0.0%) |
| 12:00 PM to 3:59 PM | 0 (0.0%) | 0 (0.0%) |
| 4:00 PM to 11:59 PM | 0 (0.0%) | 9 (27.3%) |
| Total | 63 (100.0%) | 33 (100.0%) |
Housing Occupancy in Burlington
Occupancy by Ownership in Burlington
Of the total 75 dwellings in Burlington, owner-occupied units account for 60 (80.0%), while renter-occupied units make up 15 (20.0%).
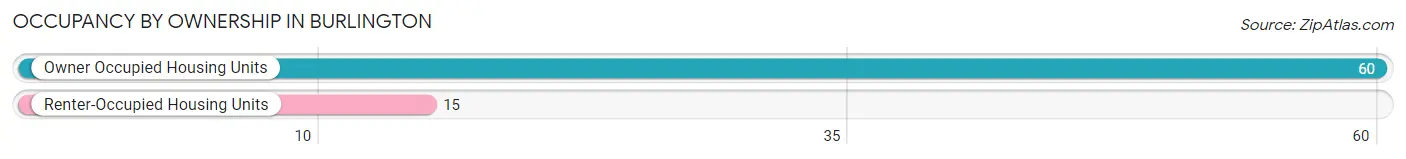
| Occupancy | # Housing Units | % Housing Units |
| Owner Occupied Housing Units | 60 | 80.0% |
| Renter-Occupied Housing Units | 15 | 20.0% |
| Total Occupied Housing Units | 75 | 100.0% |
Occupancy by Household Size in Burlington
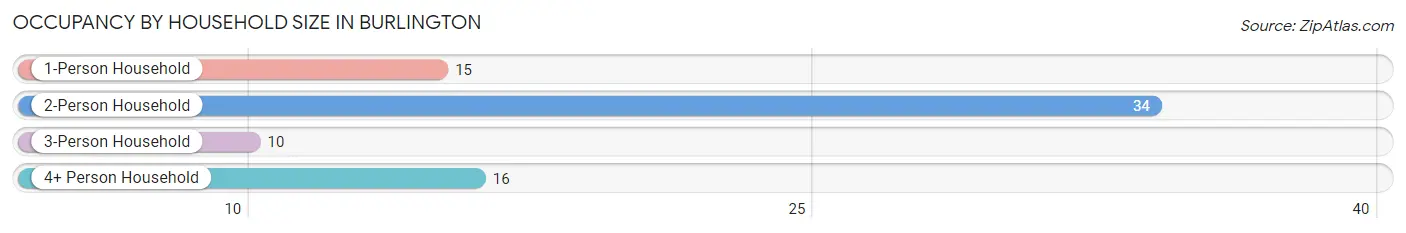
| Household Size | # Housing Units | % Housing Units |
| 1-Person Household | 15 | 20.0% |
| 2-Person Household | 34 | 45.3% |
| 3-Person Household | 10 | 13.3% |
| 4+ Person Household | 16 | 21.3% |
| Total Housing Units | 75 | 100.0% |
Occupancy by Ownership by Household Size in Burlington
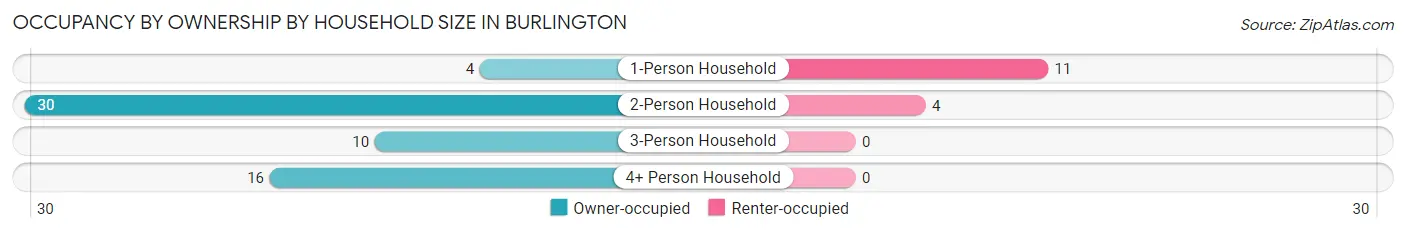
| Household Size | Owner-occupied | Renter-occupied |
| 1-Person Household | 4 (26.7%) | 11 (73.3%) |
| 2-Person Household | 30 (88.2%) | 4 (11.8%) |
| 3-Person Household | 10 (100.0%) | 0 (0.0%) |
| 4+ Person Household | 16 (100.0%) | 0 (0.0%) |
| Total Housing Units | 60 (80.0%) | 15 (20.0%) |
Occupancy by Educational Attainment in Burlington
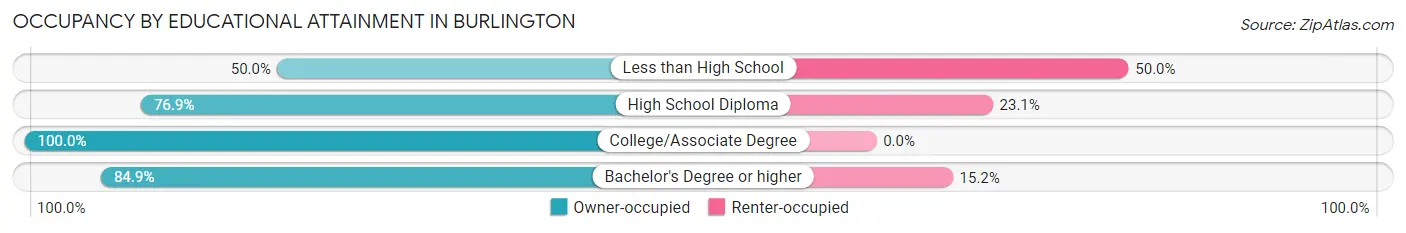
| Household Size | Owner-occupied | Renter-occupied |
| Less than High School | 4 (50.0%) | 4 (50.0%) |
| High School Diploma | 20 (76.9%) | 6 (23.1%) |
| College/Associate Degree | 8 (100.0%) | 0 (0.0%) |
| Bachelor's Degree or higher | 28 (84.9%) | 5 (15.1%) |
Occupancy by Age of Householder in Burlington
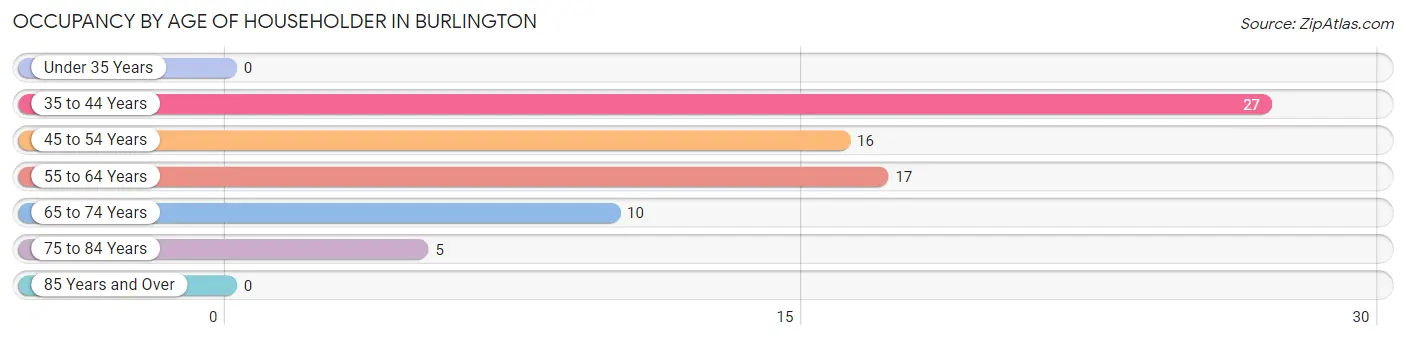
| Age Bracket | # Households | % Households |
| Under 35 Years | 0 | 0.0% |
| 35 to 44 Years | 27 | 36.0% |
| 45 to 54 Years | 16 | 21.3% |
| 55 to 64 Years | 17 | 22.7% |
| 65 to 74 Years | 10 | 13.3% |
| 75 to 84 Years | 5 | 6.7% |
| 85 Years and Over | 0 | 0.0% |
| Total | 75 | 100.0% |
Housing Finances in Burlington
Median Income by Occupancy in Burlington
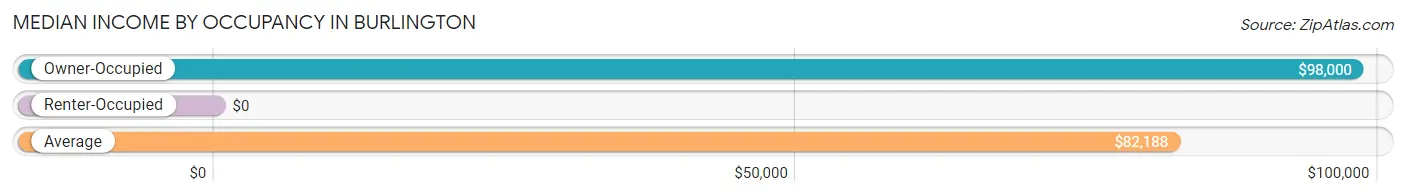
| Occupancy Type | # Households | Median Income |
| Owner-Occupied | 60 (80.0%) | $98,000 |
| Renter-Occupied | 15 (20.0%) | $0 |
| Average | 75 (100.0%) | $82,188 |
Occupancy by Householder Income Bracket in Burlington
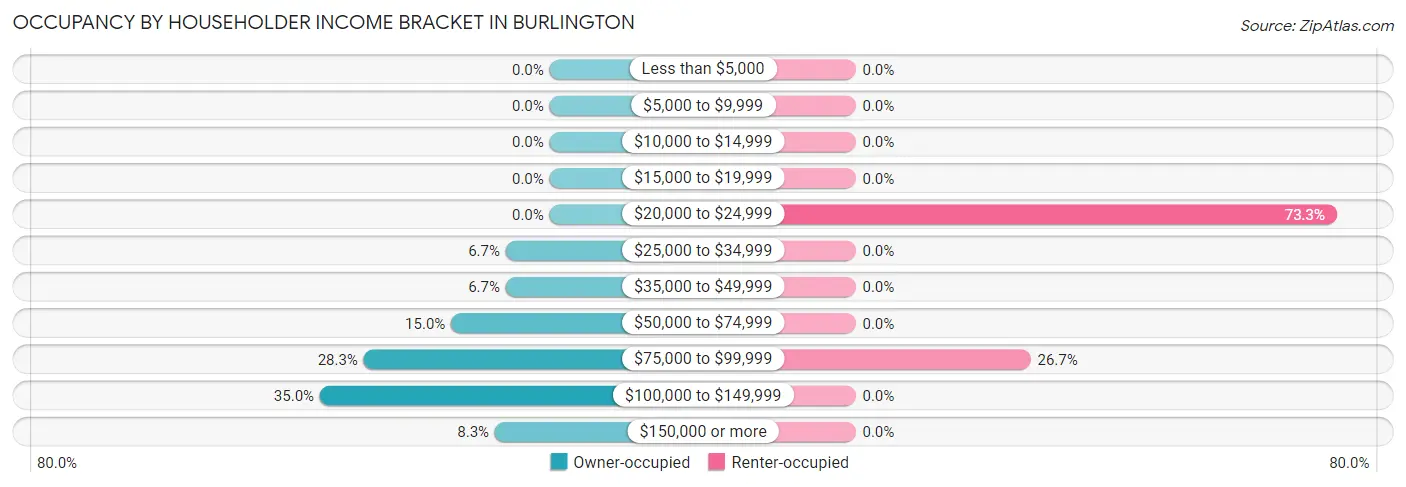
| Income Bracket | Owner-occupied | Renter-occupied |
| Less than $5,000 | 0 (0.0%) | 0 (0.0%) |
| $5,000 to $9,999 | 0 (0.0%) | 0 (0.0%) |
| $10,000 to $14,999 | 0 (0.0%) | 0 (0.0%) |
| $15,000 to $19,999 | 0 (0.0%) | 0 (0.0%) |
| $20,000 to $24,999 | 0 (0.0%) | 11 (73.3%) |
| $25,000 to $34,999 | 4 (6.7%) | 0 (0.0%) |
| $35,000 to $49,999 | 4 (6.7%) | 0 (0.0%) |
| $50,000 to $74,999 | 9 (15.0%) | 0 (0.0%) |
| $75,000 to $99,999 | 17 (28.3%) | 4 (26.7%) |
| $100,000 to $149,999 | 21 (35.0%) | 0 (0.0%) |
| $150,000 or more | 5 (8.3%) | 0 (0.0%) |
| Total | 60 (100.0%) | 15 (100.0%) |
Monthly Housing Cost Tiers in Burlington
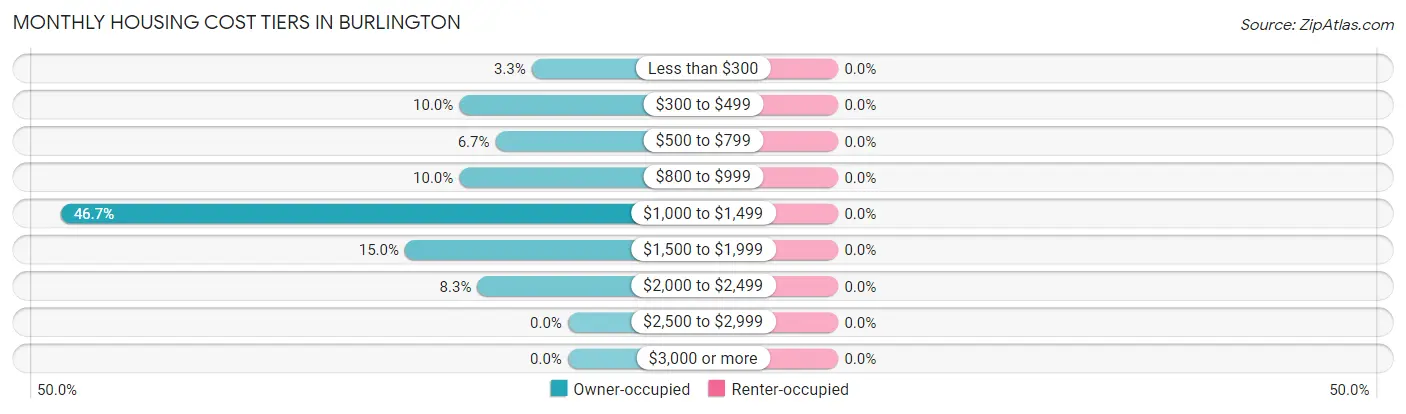
| Monthly Cost | Owner-occupied | Renter-occupied |
| Less than $300 | 2 (3.3%) | 0 (0.0%) |
| $300 to $499 | 6 (10.0%) | 0 (0.0%) |
| $500 to $799 | 4 (6.7%) | 0 (0.0%) |
| $800 to $999 | 6 (10.0%) | 0 (0.0%) |
| $1,000 to $1,499 | 28 (46.7%) | 0 (0.0%) |
| $1,500 to $1,999 | 9 (15.0%) | 0 (0.0%) |
| $2,000 to $2,499 | 5 (8.3%) | 0 (0.0%) |
| $2,500 to $2,999 | 0 (0.0%) | 0 (0.0%) |
| $3,000 or more | 0 (0.0%) | 0 (0.0%) |
| Total | 60 (100.0%) | 15 (100.0%) |
Physical Housing Characteristics in Burlington
Housing Structures in Burlington
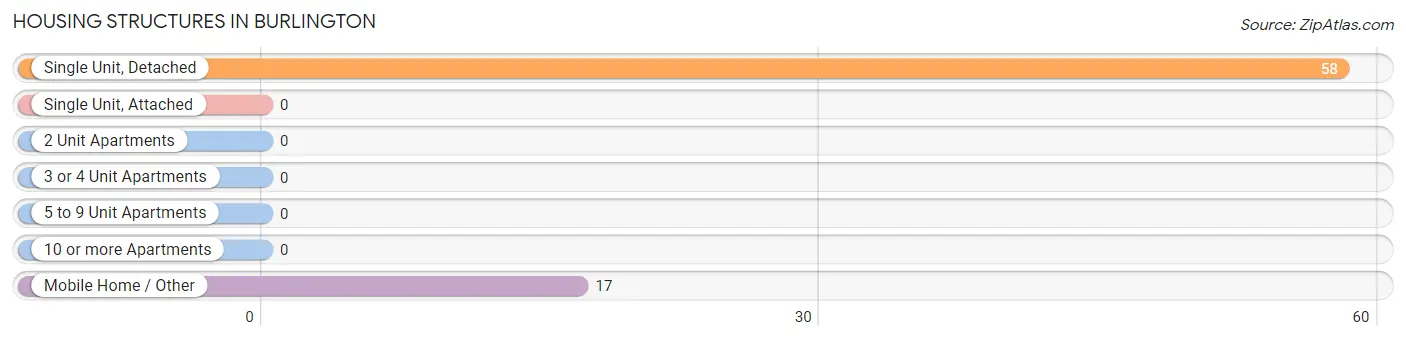
| Structure Type | # Housing Units | % Housing Units |
| Single Unit, Detached | 58 | 77.3% |
| Single Unit, Attached | 0 | 0.0% |
| 2 Unit Apartments | 0 | 0.0% |
| 3 or 4 Unit Apartments | 0 | 0.0% |
| 5 to 9 Unit Apartments | 0 | 0.0% |
| 10 or more Apartments | 0 | 0.0% |
| Mobile Home / Other | 17 | 22.7% |
| Total | 75 | 100.0% |
Housing Structures by Occupancy in Burlington
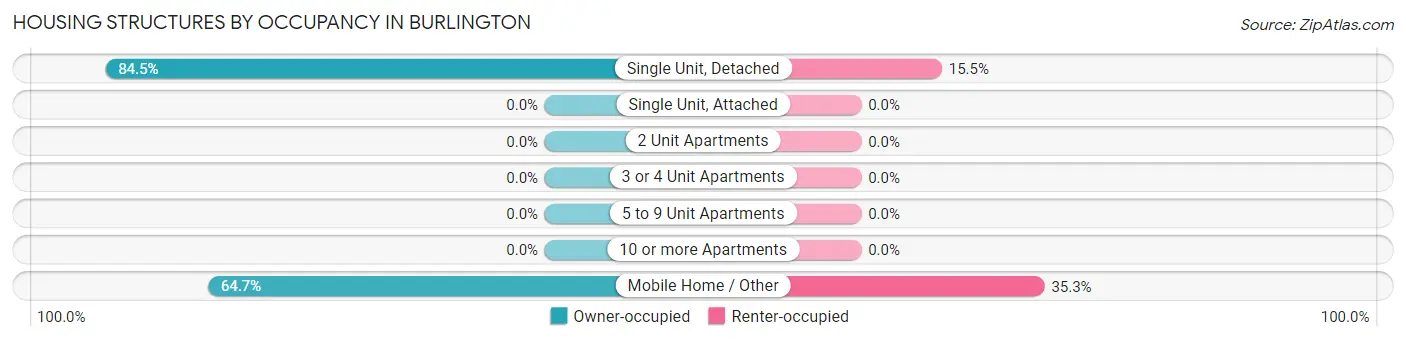
| Structure Type | Owner-occupied | Renter-occupied |
| Single Unit, Detached | 49 (84.5%) | 9 (15.5%) |
| Single Unit, Attached | 0 (0.0%) | 0 (0.0%) |
| 2 Unit Apartments | 0 (0.0%) | 0 (0.0%) |
| 3 or 4 Unit Apartments | 0 (0.0%) | 0 (0.0%) |
| 5 to 9 Unit Apartments | 0 (0.0%) | 0 (0.0%) |
| 10 or more Apartments | 0 (0.0%) | 0 (0.0%) |
| Mobile Home / Other | 11 (64.7%) | 6 (35.3%) |
| Total | 60 (80.0%) | 15 (20.0%) |
Housing Structures by Number of Rooms in Burlington
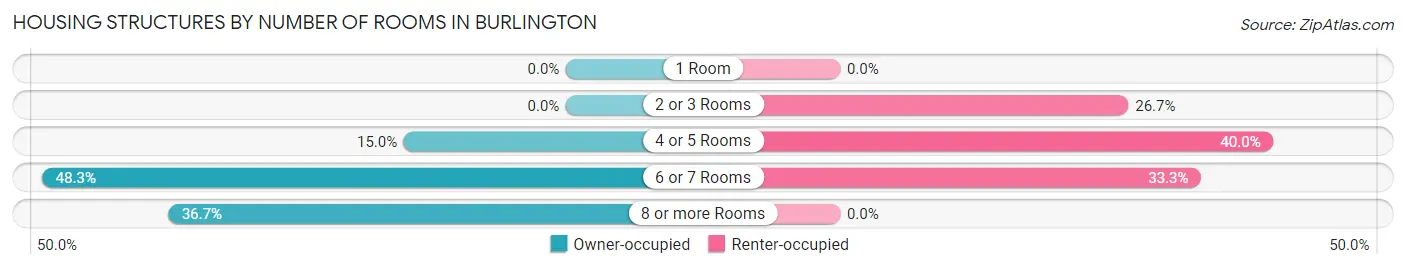
| Number of Rooms | Owner-occupied | Renter-occupied |
| 1 Room | 0 (0.0%) | 0 (0.0%) |
| 2 or 3 Rooms | 0 (0.0%) | 4 (26.7%) |
| 4 or 5 Rooms | 9 (15.0%) | 6 (40.0%) |
| 6 or 7 Rooms | 29 (48.3%) | 5 (33.3%) |
| 8 or more Rooms | 22 (36.7%) | 0 (0.0%) |
| Total | 60 (100.0%) | 15 (100.0%) |
Housing Structure by Heating Type in Burlington
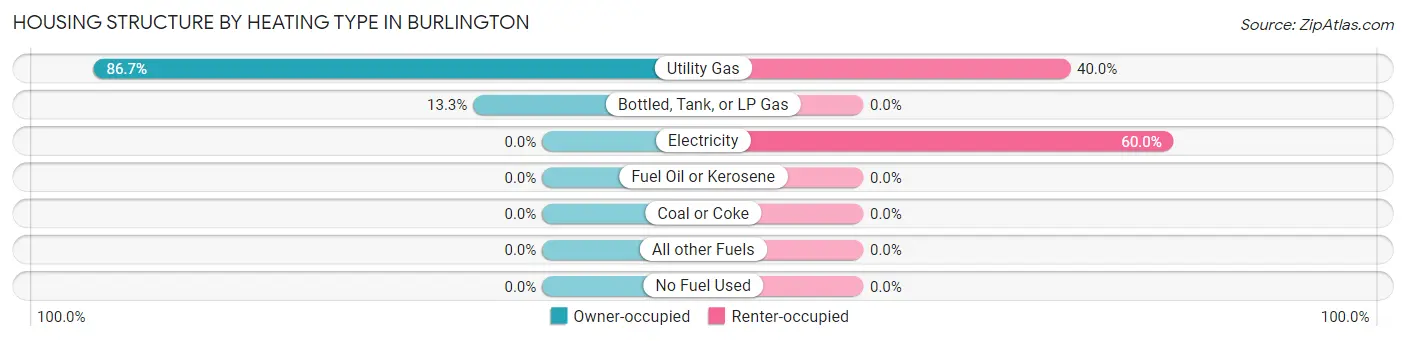
| Heating Type | Owner-occupied | Renter-occupied |
| Utility Gas | 52 (86.7%) | 6 (40.0%) |
| Bottled, Tank, or LP Gas | 8 (13.3%) | 0 (0.0%) |
| Electricity | 0 (0.0%) | 9 (60.0%) |
| Fuel Oil or Kerosene | 0 (0.0%) | 0 (0.0%) |
| Coal or Coke | 0 (0.0%) | 0 (0.0%) |
| All other Fuels | 0 (0.0%) | 0 (0.0%) |
| No Fuel Used | 0 (0.0%) | 0 (0.0%) |
| Total | 60 (100.0%) | 15 (100.0%) |
Household Vehicle Usage in Burlington
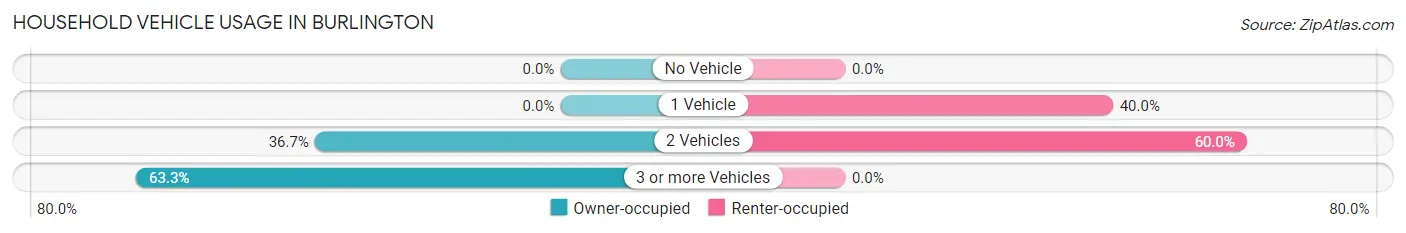
| Vehicles per Household | Owner-occupied | Renter-occupied |
| No Vehicle | 0 (0.0%) | 0 (0.0%) |
| 1 Vehicle | 0 (0.0%) | 6 (40.0%) |
| 2 Vehicles | 22 (36.7%) | 9 (60.0%) |
| 3 or more Vehicles | 38 (63.3%) | 0 (0.0%) |
| Total | 60 (100.0%) | 15 (100.0%) |
Real Estate & Mortgages in Burlington
Real Estate and Mortgage Overview in Burlington
| Characteristic | Without Mortgage | With Mortgage |
| Housing Units | 12 | 48 |
| Median Property Value | - | - |
| Median Household Income | $81,250 | $5 |
| Monthly Housing Costs | $350 | $0 |
| Real Estate Taxes | - | - |
Property Value by Mortgage Status in Burlington
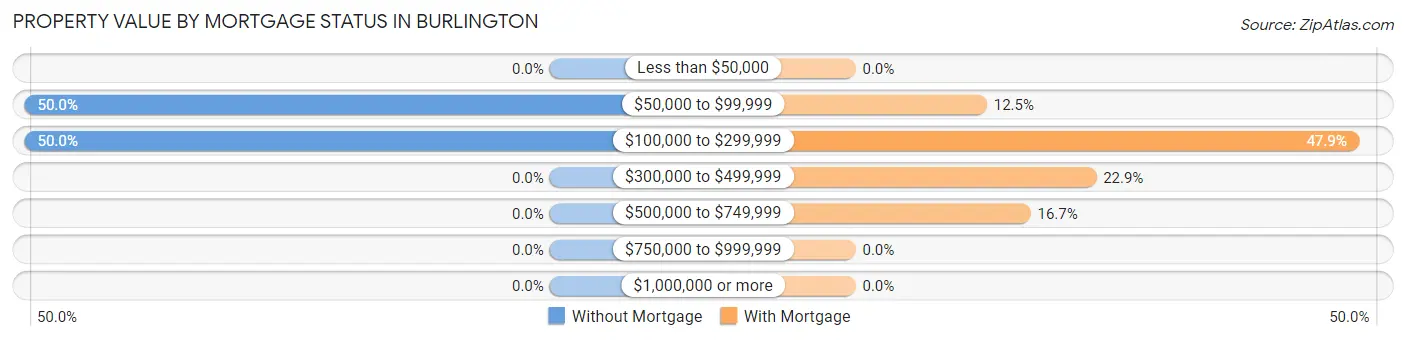
| Property Value | Without Mortgage | With Mortgage |
| Less than $50,000 | 0 (0.0%) | 0 (0.0%) |
| $50,000 to $99,999 | 6 (50.0%) | 6 (12.5%) |
| $100,000 to $299,999 | 6 (50.0%) | 23 (47.9%) |
| $300,000 to $499,999 | 0 (0.0%) | 11 (22.9%) |
| $500,000 to $749,999 | 0 (0.0%) | 8 (16.7%) |
| $750,000 to $999,999 | 0 (0.0%) | 0 (0.0%) |
| $1,000,000 or more | 0 (0.0%) | 0 (0.0%) |
| Total | 12 (100.0%) | 48 (100.0%) |
Household Income by Mortgage Status in Burlington
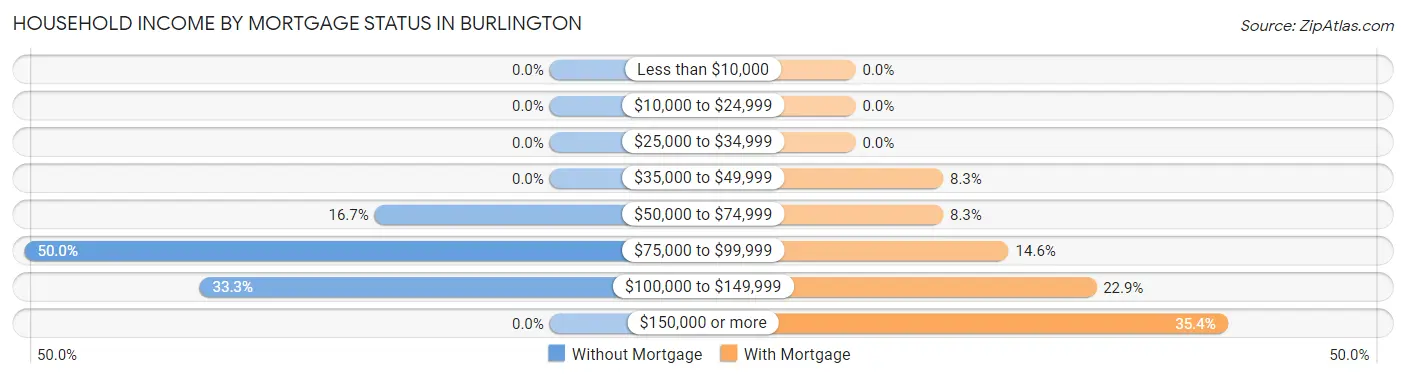
| Household Income | Without Mortgage | With Mortgage |
| Less than $10,000 | 0 (0.0%) | 0 (0.0%) |
| $10,000 to $24,999 | 0 (0.0%) | 0 (0.0%) |
| $25,000 to $34,999 | 0 (0.0%) | 0 (0.0%) |
| $35,000 to $49,999 | 0 (0.0%) | 4 (8.3%) |
| $50,000 to $74,999 | 2 (16.7%) | 4 (8.3%) |
| $75,000 to $99,999 | 6 (50.0%) | 7 (14.6%) |
| $100,000 to $149,999 | 4 (33.3%) | 11 (22.9%) |
| $150,000 or more | 0 (0.0%) | 17 (35.4%) |
| Total | 12 (100.0%) | 48 (100.0%) |
Property Value to Household Income Ratio in Burlington
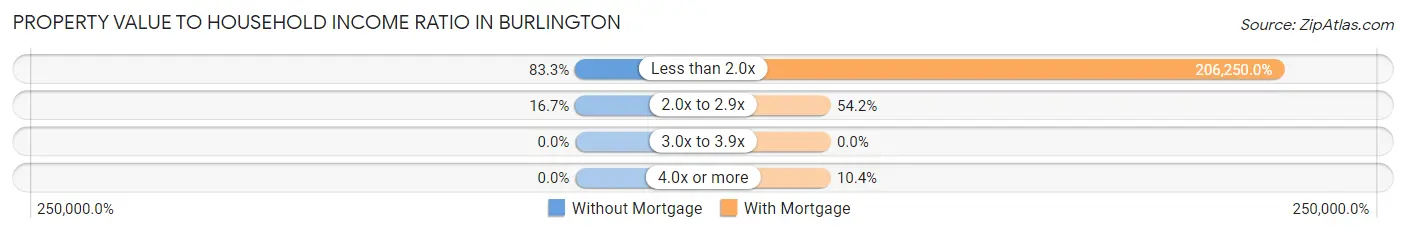
| Value-to-Income Ratio | Without Mortgage | With Mortgage |
| Less than 2.0x | 10 (83.3%) | 99,000 (206,250.0%) |
| 2.0x to 2.9x | 2 (16.7%) | 26 (54.2%) |
| 3.0x to 3.9x | 0 (0.0%) | 0 (0.0%) |
| 4.0x or more | 0 (0.0%) | 5 (10.4%) |
| Total | 12 (100.0%) | 48 (100.0%) |
Real Estate Taxes by Mortgage Status in Burlington
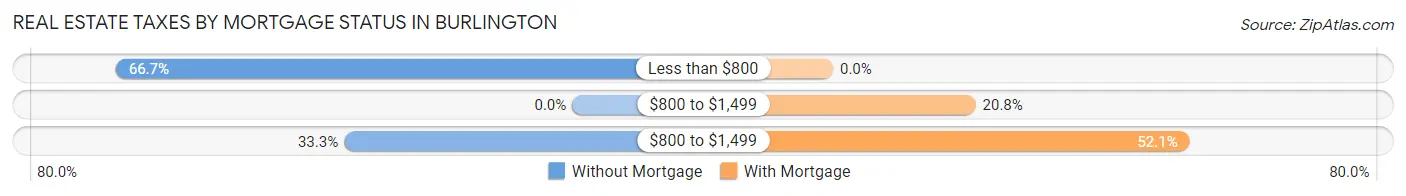
| Property Taxes | Without Mortgage | With Mortgage |
| Less than $800 | 8 (66.7%) | 0 (0.0%) |
| $800 to $1,499 | 0 (0.0%) | 10 (20.8%) |
| $800 to $1,499 | 4 (33.3%) | 25 (52.1%) |
| Total | 12 (100.0%) | 48 (100.0%) |
Health & Disability in Burlington
Health Insurance Coverage by Age in Burlington
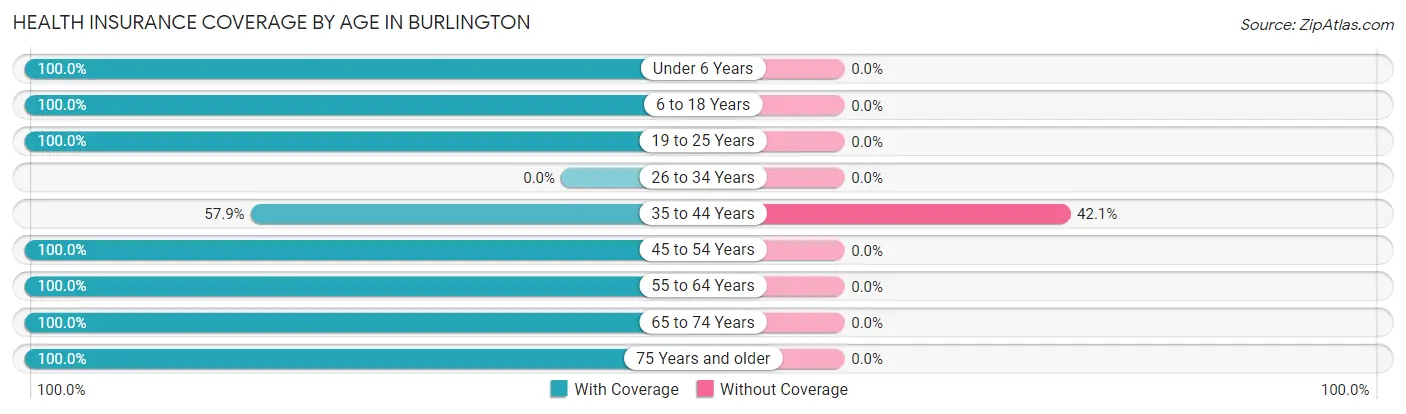
| Age Bracket | With Coverage | Without Coverage |
| Under 6 Years | 11 (100.0%) | 0 (0.0%) |
| 6 to 18 Years | 68 (100.0%) | 0 (0.0%) |
| 19 to 25 Years | 33 (100.0%) | 0 (0.0%) |
| 26 to 34 Years | 0 (0.0%) | 0 (0.0%) |
| 35 to 44 Years | 22 (57.9%) | 16 (42.1%) |
| 45 to 54 Years | 38 (100.0%) | 0 (0.0%) |
| 55 to 64 Years | 30 (100.0%) | 0 (0.0%) |
| 65 to 74 Years | 20 (100.0%) | 0 (0.0%) |
| 75 Years and older | 11 (100.0%) | 0 (0.0%) |
| Total | 233 (93.6%) | 16 (6.4%) |
Health Insurance Coverage by Citizenship Status in Burlington
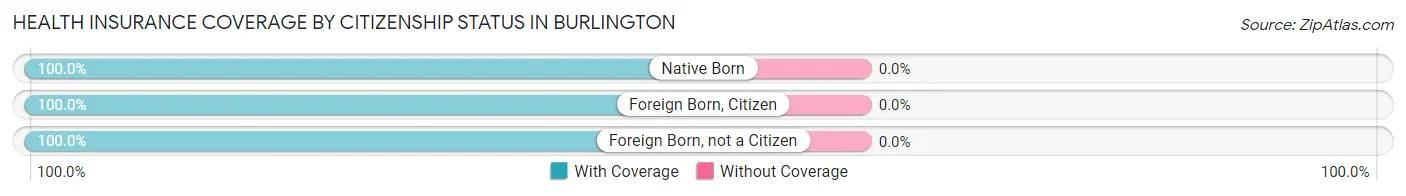
| Citizenship Status | With Coverage | Without Coverage |
| Native Born | 11 (100.0%) | 0 (0.0%) |
| Foreign Born, Citizen | 68 (100.0%) | 0 (0.0%) |
| Foreign Born, not a Citizen | 33 (100.0%) | 0 (0.0%) |
Health Insurance Coverage by Household Income in Burlington
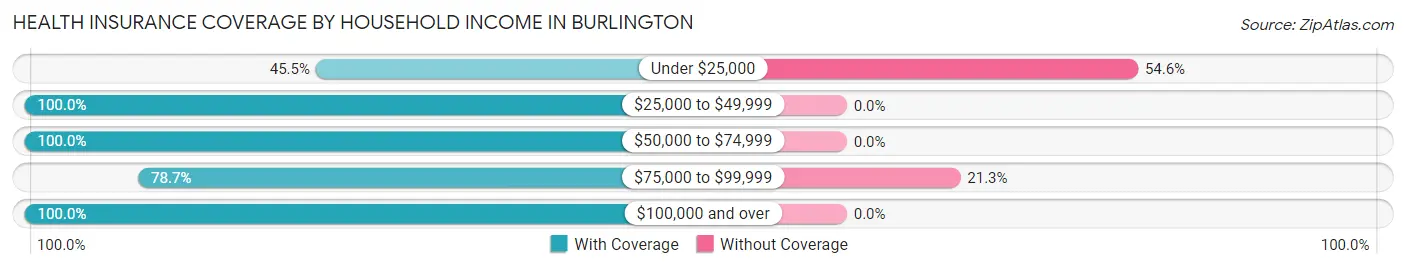
| Household Income | With Coverage | Without Coverage |
| Under $25,000 | 5 (45.5%) | 6 (54.5%) |
| $25,000 to $49,999 | 22 (100.0%) | 0 (0.0%) |
| $50,000 to $74,999 | 46 (100.0%) | 0 (0.0%) |
| $75,000 to $99,999 | 37 (78.7%) | 10 (21.3%) |
| $100,000 and over | 123 (100.0%) | 0 (0.0%) |
Public vs Private Health Insurance Coverage by Age in Burlington
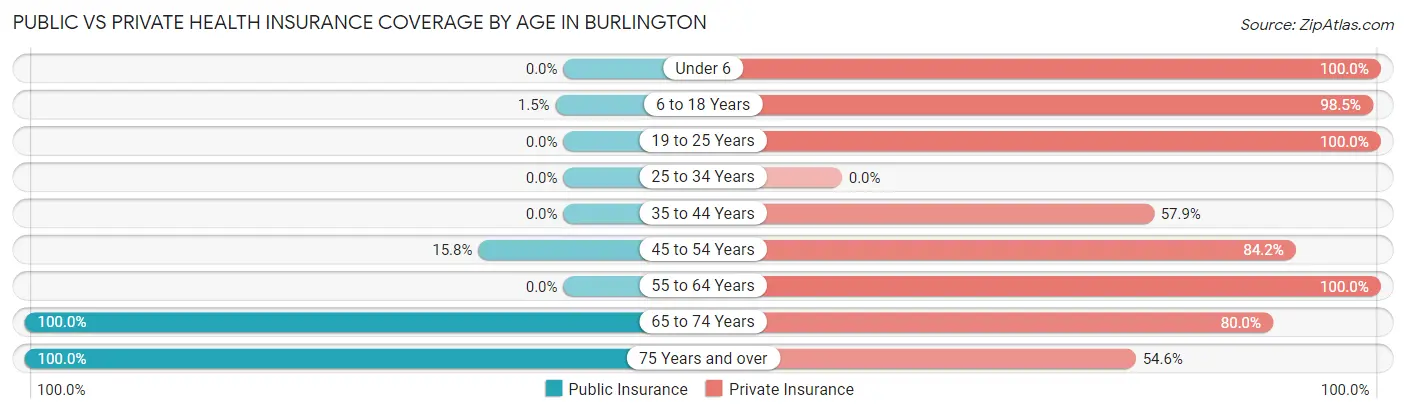
| Age Bracket | Public Insurance | Private Insurance |
| Under 6 | 0 (0.0%) | 11 (100.0%) |
| 6 to 18 Years | 1 (1.5%) | 67 (98.5%) |
| 19 to 25 Years | 0 (0.0%) | 33 (100.0%) |
| 25 to 34 Years | 0 (0.0%) | 0 (0.0%) |
| 35 to 44 Years | 0 (0.0%) | 22 (57.9%) |
| 45 to 54 Years | 6 (15.8%) | 32 (84.2%) |
| 55 to 64 Years | 0 (0.0%) | 30 (100.0%) |
| 65 to 74 Years | 20 (100.0%) | 16 (80.0%) |
| 75 Years and over | 11 (100.0%) | 6 (54.5%) |
| Total | 38 (15.3%) | 217 (87.2%) |
Disability Status by Sex by Age in Burlington
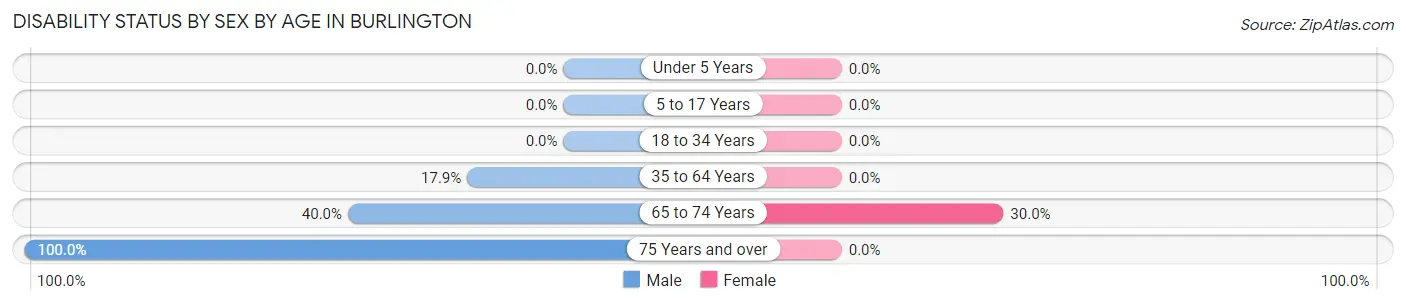
| Age Bracket | Male | Female |
| Under 5 Years | 0 (0.0%) | 0 (0.0%) |
| 5 to 17 Years | 0 (0.0%) | 0 (0.0%) |
| 18 to 34 Years | 0 (0.0%) | 0 (0.0%) |
| 35 to 64 Years | 10 (17.9%) | 0 (0.0%) |
| 65 to 74 Years | 4 (40.0%) | 3 (30.0%) |
| 75 Years and over | 11 (100.0%) | 0 (0.0%) |
Disability Class by Sex by Age in Burlington
Disability Class: Hearing Difficulty
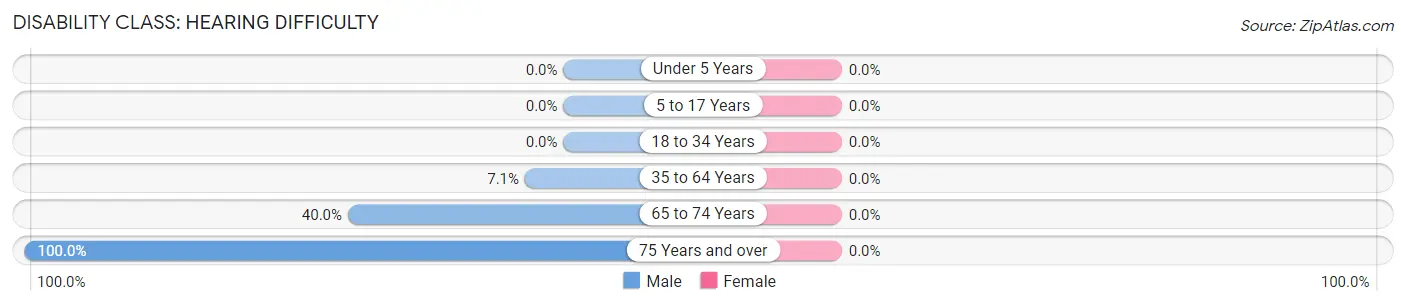
| Age Bracket | Male | Female |
| Under 5 Years | 0 (0.0%) | 0 (0.0%) |
| 5 to 17 Years | 0 (0.0%) | 0 (0.0%) |
| 18 to 34 Years | 0 (0.0%) | 0 (0.0%) |
| 35 to 64 Years | 4 (7.1%) | 0 (0.0%) |
| 65 to 74 Years | 4 (40.0%) | 0 (0.0%) |
| 75 Years and over | 11 (100.0%) | 0 (0.0%) |
Disability Class: Vision Difficulty
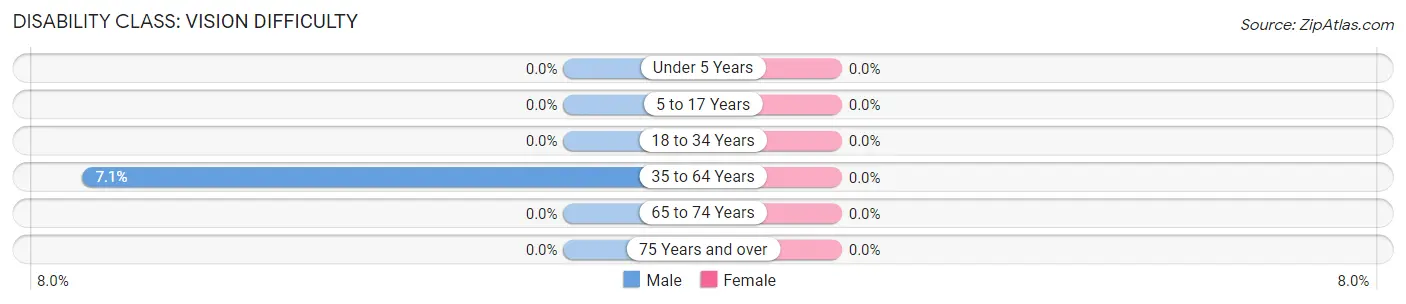
| Age Bracket | Male | Female |
| Under 5 Years | 0 (0.0%) | 0 (0.0%) |
| 5 to 17 Years | 0 (0.0%) | 0 (0.0%) |
| 18 to 34 Years | 0 (0.0%) | 0 (0.0%) |
| 35 to 64 Years | 4 (7.1%) | 0 (0.0%) |
| 65 to 74 Years | 0 (0.0%) | 0 (0.0%) |
| 75 Years and over | 0 (0.0%) | 0 (0.0%) |
Disability Class: Cognitive Difficulty
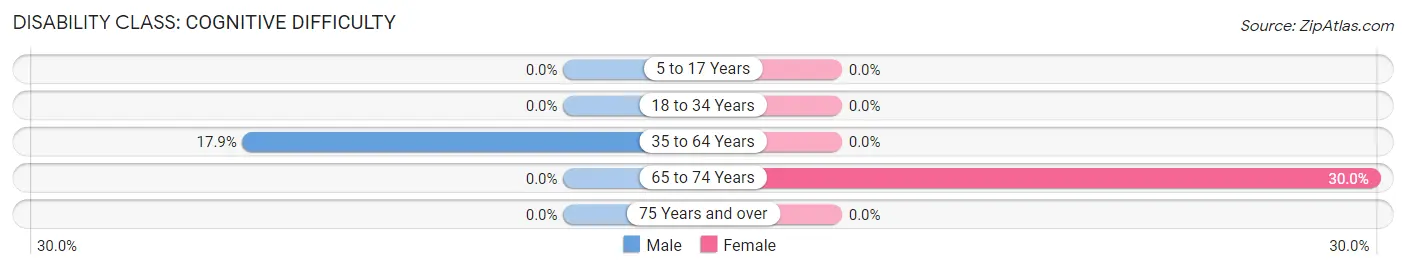
| Age Bracket | Male | Female |
| 5 to 17 Years | 0 (0.0%) | 0 (0.0%) |
| 18 to 34 Years | 0 (0.0%) | 0 (0.0%) |
| 35 to 64 Years | 10 (17.9%) | 0 (0.0%) |
| 65 to 74 Years | 0 (0.0%) | 3 (30.0%) |
| 75 Years and over | 0 (0.0%) | 0 (0.0%) |
Disability Class: Ambulatory Difficulty
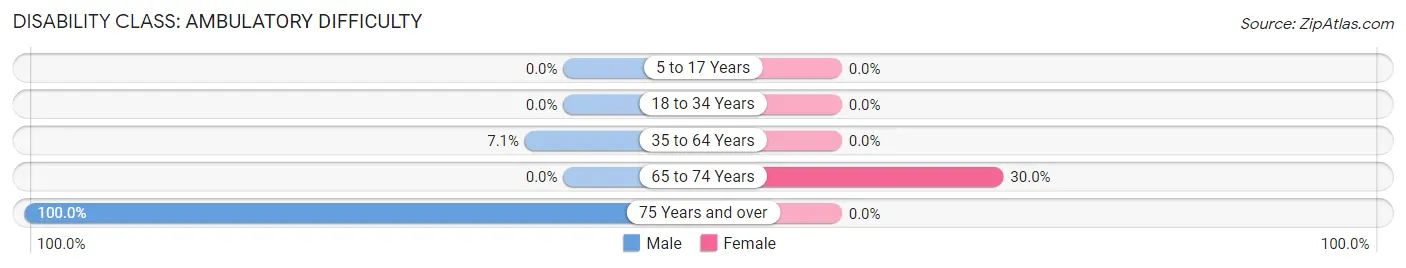
| Age Bracket | Male | Female |
| 5 to 17 Years | 0 (0.0%) | 0 (0.0%) |
| 18 to 34 Years | 0 (0.0%) | 0 (0.0%) |
| 35 to 64 Years | 4 (7.1%) | 0 (0.0%) |
| 65 to 74 Years | 0 (0.0%) | 3 (30.0%) |
| 75 Years and over | 11 (100.0%) | 0 (0.0%) |
Disability Class: Self-Care Difficulty
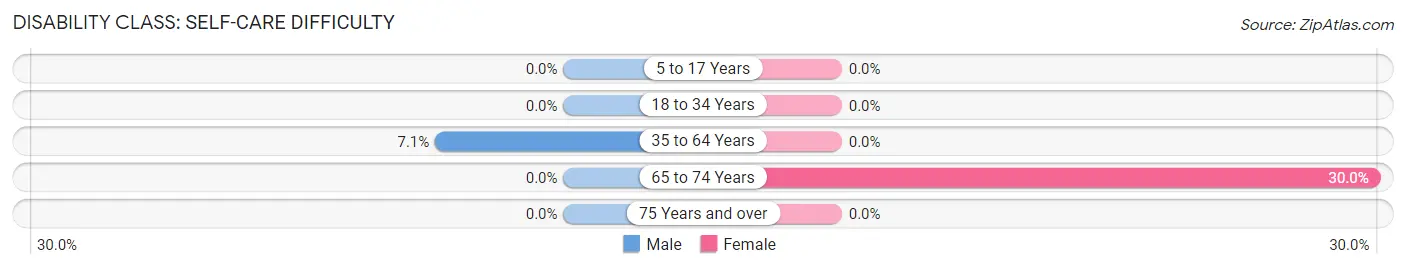
| Age Bracket | Male | Female |
| 5 to 17 Years | 0 (0.0%) | 0 (0.0%) |
| 18 to 34 Years | 0 (0.0%) | 0 (0.0%) |
| 35 to 64 Years | 4 (7.1%) | 0 (0.0%) |
| 65 to 74 Years | 0 (0.0%) | 3 (30.0%) |
| 75 Years and over | 0 (0.0%) | 0 (0.0%) |
Technology Access in Burlington
Computing Device Access in Burlington
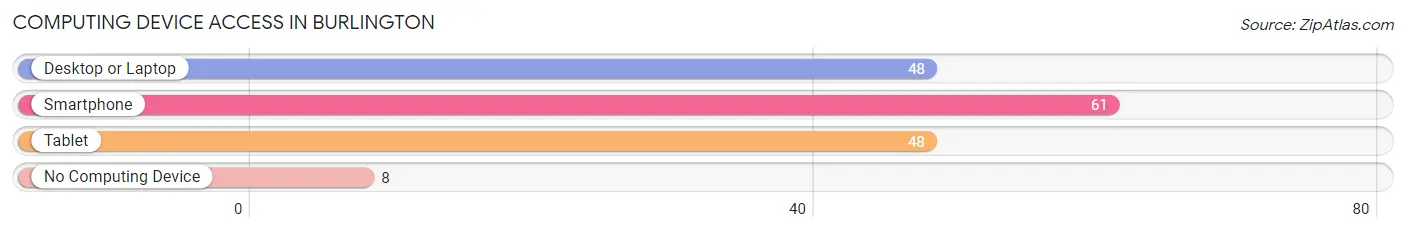
| Device Type | # Households | % Households |
| Desktop or Laptop | 48 | 64.0% |
| Smartphone | 61 | 81.3% |
| Tablet | 48 | 64.0% |
| No Computing Device | 8 | 10.7% |
| Total | 75 | 100.0% |
Internet Access in Burlington
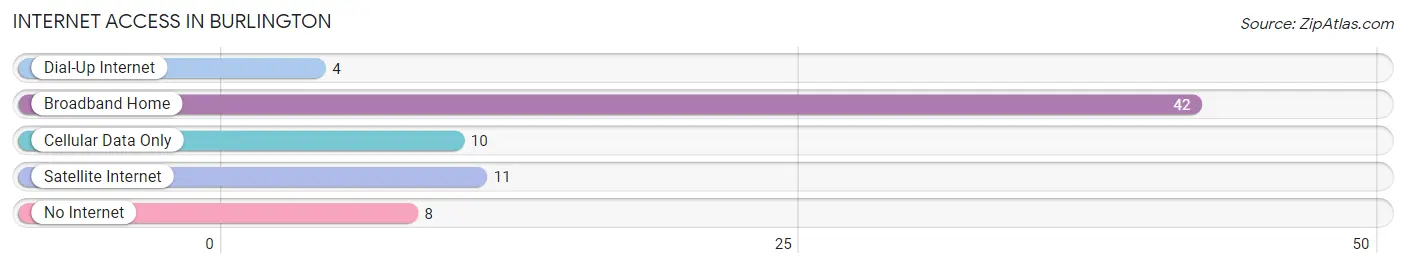
| Internet Type | # Households | % Households |
| Dial-Up Internet | 4 | 5.3% |
| Broadband Home | 42 | 56.0% |
| Cellular Data Only | 10 | 13.3% |
| Satellite Internet | 11 | 14.7% |
| No Internet | 8 | 10.7% |
| Total | 75 | 100.0% |
Burlington Summary
Burlington, Wyoming is a small town located in the southeastern corner of the state. It is situated in the foothills of the Wind River Mountains, and is surrounded by the vast expanse of the Great Plains. The town has a population of just over 500 people, and is the county seat of Carbon County.
History
The area around Burlington was first settled in the late 1800s by ranchers and farmers. The town was officially founded in 1891, and was named after Burlington, Iowa. The town was incorporated in 1909, and the first post office was established in 1910.
The town grew slowly, but steadily, and by the 1920s, it had become a thriving agricultural center. The town was also home to several coal mines, which provided employment for many of the town’s residents.
In the 1950s, the town began to decline as the coal mines closed and the agricultural industry shifted away from the area. The population of the town began to decline, and by the 1970s, the town was in danger of becoming a ghost town.
However, in the 1980s, the town began to experience a resurgence. The town was designated as a historic district, and several businesses began to move into the area. The population of the town began to grow again, and by the 2000s, the town had become a popular tourist destination.
Geography
Burlington is located in the southeastern corner of Wyoming, in the foothills of the Wind River Mountains. The town is situated at an elevation of 5,400 feet, and is surrounded by the vast expanse of the Great Plains.
The town is located near the headwaters of the Little Snake River, and is just a few miles from the Wyoming-Colorado border. The town is also located near the Medicine Bow National Forest, which provides a variety of recreational opportunities.
Economy
The economy of Burlington is largely based on tourism and agriculture. The town is home to several small businesses, including restaurants, shops, and lodging. The town is also home to several ranches, which provide employment for many of the town’s residents.
The town is also home to several coal mines, which provide employment for many of the town’s residents. The coal mines are owned by the Burlington Coal Company, which is the largest employer in the town.
Demographics
As of the 2010 census, the population of Burlington was 514. The town is predominantly white, with a small Hispanic population. The median household income in the town is $41,250, and the median home value is $127,000.
The town is served by the Carbon County School District, which includes two elementary schools, one middle school, and one high school. The town is also home to a branch of the University of Wyoming.
Conclusion
Burlington, Wyoming is a small town located in the southeastern corner of the state. It is situated in the foothills of the Wind River Mountains, and is surrounded by the vast expanse of the Great Plains. The town has a population of just over 500 people, and is the county seat of Carbon County. The town’s economy is largely based on tourism and agriculture, and the town is home to several small businesses, ranches, and coal mines. The town is predominantly white, with a small Hispanic population, and is served by the Carbon County School District.
Common Questions
What is Per Capita Income in Burlington?
Per Capita income in Burlington is $27,599.
What is the Median Family Income in Burlington?
Median Family Income in Burlington is $98,000.
What is the Median Household income in Burlington?
Median Household Income in Burlington is $82,188.
What is Inequality or Gini Index in Burlington?
Inequality or Gini Index in Burlington is 0.29.
What is the Total Population of Burlington?
Total Population of Burlington is 249.
What is the Total Male Population of Burlington?
Total Male Population of Burlington is 160.
What is the Total Female Population of Burlington?
Total Female Population of Burlington is 89.
What is the Ratio of Males per 100 Females in Burlington?
There are 179.78 Males per 100 Females in Burlington.
What is the Ratio of Females per 100 Males in Burlington?
There are 55.62 Females per 100 Males in Burlington.
What is the Median Population Age in Burlington?
Median Population Age in Burlington is 37.7 Years.
What is the Average Family Size in Burlington
Average Family Size in Burlington is 3.9 People.
What is the Average Household Size in Burlington
Average Household Size in Burlington is 3.3 People.
How Large is the Labor Force in Burlington?
There are 119 People in the Labor Forcein in Burlington.
What is the Percentage of People in the Labor Force in Burlington?
62.0% of People are in the Labor Force in Burlington.
What is the Unemployment Rate in Burlington?
Unemployment Rate in Burlington is 4.2%.