Alpine, WY Map & Demographics
Alpine Map
Alpine Overview
$43,942
PER CAPITA INCOME
$111,953
AVG FAMILY INCOME
$85,326
AVG HOUSEHOLD INCOME
8.5%
WAGE / INCOME GAP [ % ]
91.5¢/ $1
WAGE / INCOME GAP [ $ ]
0.33
INEQUALITY / GINI INDEX
891
TOTAL POPULATION
526
MALE POPULATION
365
FEMALE POPULATION
144.11
MALES / 100 FEMALES
69.39
FEMALES / 100 MALES
33.7
MEDIAN AGE
2.9
AVG FAMILY SIZE
2.2
AVG HOUSEHOLD SIZE
591
LABOR FORCE [ PEOPLE ]
83.5%
PERCENT IN LABOR FORCE
Alpine Zip Codes
Alpine Area Codes
Income in Alpine
Income Overview in Alpine
Per Capita Income in Alpine is $43,942, while median incomes of families and households are $111,953 and $85,326 respectively.
| Characteristic | Number | Measure |
| Per Capita Income | 891 | $43,942 |
| Median Family Income | 215 | $111,953 |
| Mean Family Income | 215 | $118,971 |
| Median Household Income | 396 | $85,326 |
| Mean Household Income | 396 | $100,357 |
| Income Deficit | 215 | $0 |
| Wage / Income Gap (%) | 891 | 8.48% |
| Wage / Income Gap ($) | 891 | 91.52¢ per $1 |
| Gini / Inequality Index | 891 | 0.33 |
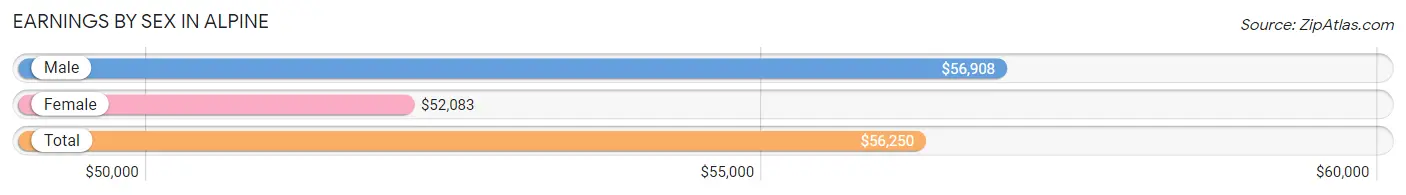
Earnings by Sex in Alpine
Average Earnings in Alpine are $56,250, $56,908 for men and $52,083 for women, a difference of 8.5%.
| Sex | Number | Average Earnings |
| Male | 340 (56.1%) | $56,908 |
| Female | 266 (43.9%) | $52,083 |
| Total | 606 (100.0%) | $56,250 |
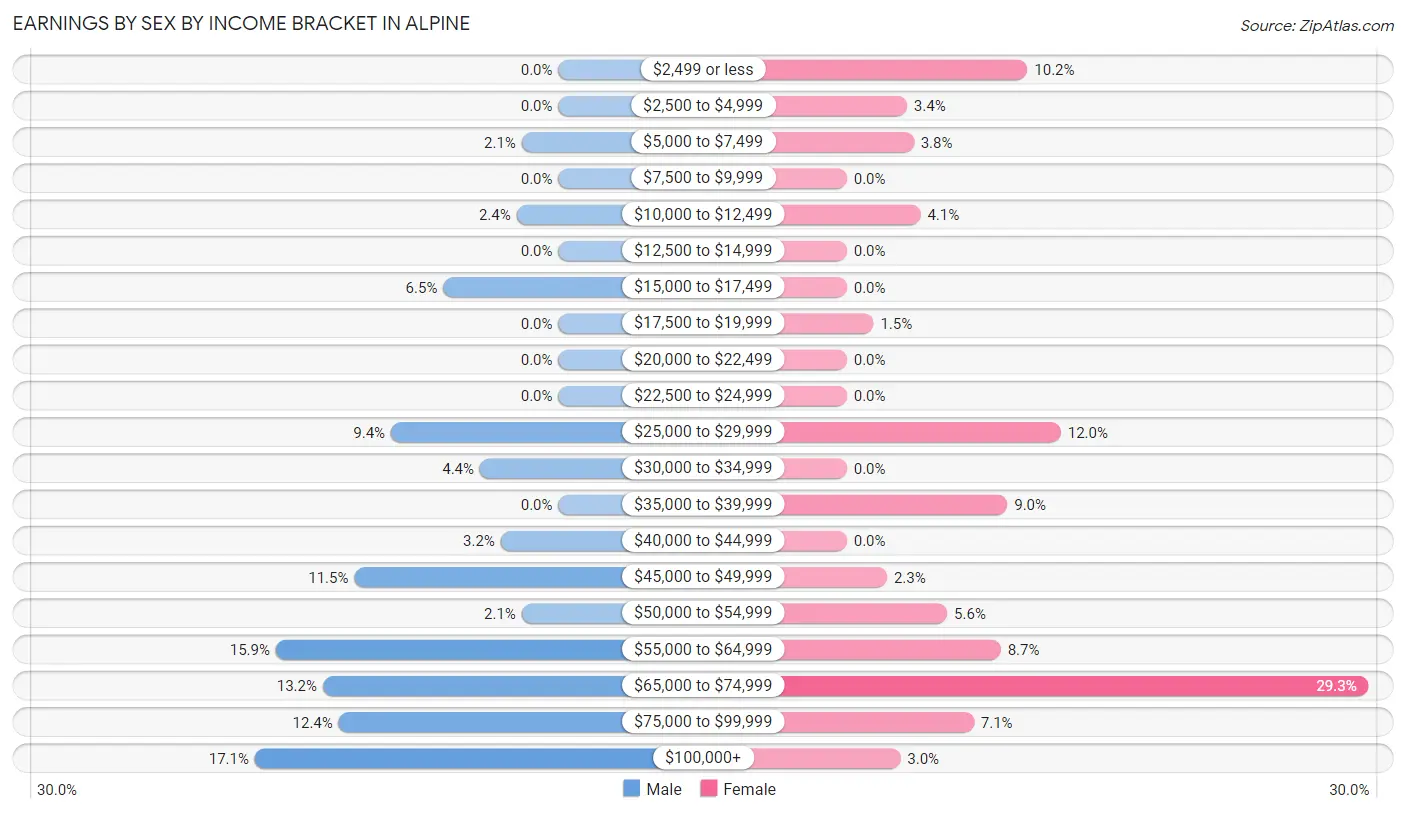
Earnings by Sex by Income Bracket in Alpine
The most common earnings brackets in Alpine are $100,000+ for men (58 | 17.1%) and $65,000 to $74,999 for women (78 | 29.3%).
| Income | Male | Female |
| $2,499 or less | 0 (0.0%) | 27 (10.2%) |
| $2,500 to $4,999 | 0 (0.0%) | 9 (3.4%) |
| $5,000 to $7,499 | 7 (2.1%) | 10 (3.8%) |
| $7,500 to $9,999 | 0 (0.0%) | 0 (0.0%) |
| $10,000 to $12,499 | 8 (2.4%) | 11 (4.1%) |
| $12,500 to $14,999 | 0 (0.0%) | 0 (0.0%) |
| $15,000 to $17,499 | 22 (6.5%) | 0 (0.0%) |
| $17,500 to $19,999 | 0 (0.0%) | 4 (1.5%) |
| $20,000 to $22,499 | 0 (0.0%) | 0 (0.0%) |
| $22,500 to $24,999 | 0 (0.0%) | 0 (0.0%) |
| $25,000 to $29,999 | 32 (9.4%) | 32 (12.0%) |
| $30,000 to $34,999 | 15 (4.4%) | 0 (0.0%) |
| $35,000 to $39,999 | 0 (0.0%) | 24 (9.0%) |
| $40,000 to $44,999 | 11 (3.2%) | 0 (0.0%) |
| $45,000 to $49,999 | 39 (11.5%) | 6 (2.3%) |
| $50,000 to $54,999 | 7 (2.1%) | 15 (5.6%) |
| $55,000 to $64,999 | 54 (15.9%) | 23 (8.6%) |
| $65,000 to $74,999 | 45 (13.2%) | 78 (29.3%) |
| $75,000 to $99,999 | 42 (12.3%) | 19 (7.1%) |
| $100,000+ | 58 (17.1%) | 8 (3.0%) |
| Total | 340 (100.0%) | 266 (100.0%) |
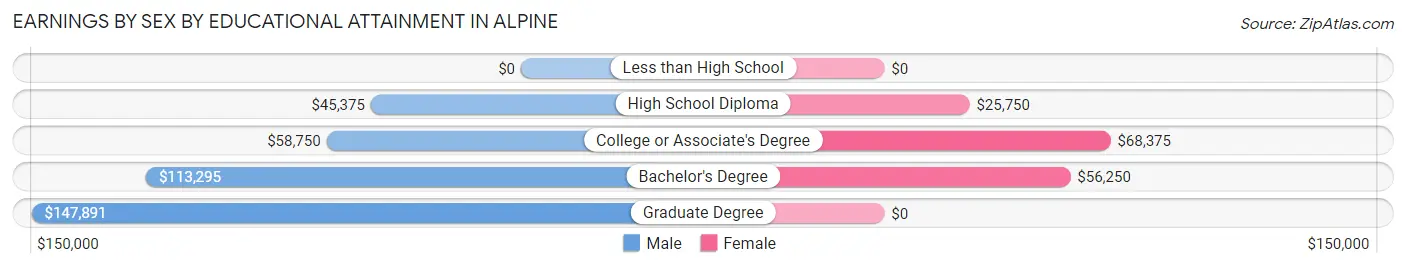
Earnings by Sex by Educational Attainment in Alpine
Average earnings in Alpine are $67,500 for men and $56,875 for women, a difference of 15.7%. Men with an educational attainment of graduate degree enjoy the highest average annual earnings of $147,891, while those with high school diploma education earn the least with $45,375. Women with an educational attainment of college or associate's degree earn the most with the average annual earnings of $68,375, while those with high school diploma education have the smallest earnings of $25,750.
| Educational Attainment | Male Income | Female Income |
| Less than High School | - | - |
| High School Diploma | $45,375 | $25,750 |
| College or Associate's Degree | $58,750 | $68,375 |
| Bachelor's Degree | $113,295 | $56,250 |
| Graduate Degree | $147,891 | $0 |
| Total | $67,500 | $56,875 |
Family Income in Alpine
Family Income Brackets in Alpine
According to the Alpine family income data, there are 66 families falling into the $100,000 to $149,999 income range, which is the most common income bracket and makes up 30.7% of all families.
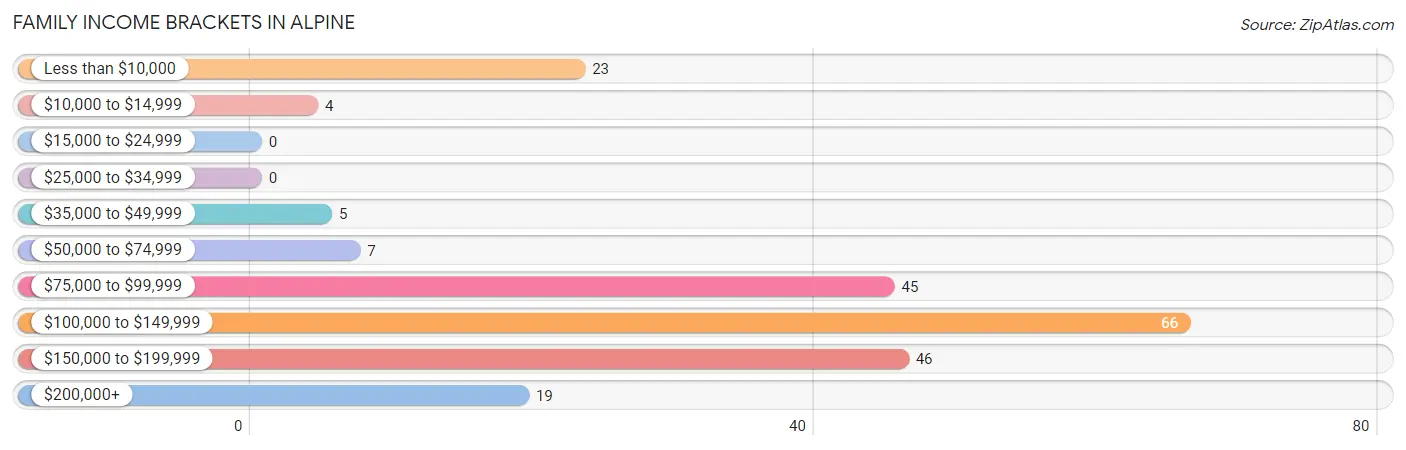
| Income Bracket | # Families | % Families |
| Less than $10,000 | 23 | 10.7% |
| $10,000 to $14,999 | 4 | 1.9% |
| $15,000 to $24,999 | 0 | 0.0% |
| $25,000 to $34,999 | 0 | 0.0% |
| $35,000 to $49,999 | 5 | 2.3% |
| $50,000 to $74,999 | 7 | 3.3% |
| $75,000 to $99,999 | 45 | 20.9% |
| $100,000 to $149,999 | 66 | 30.7% |
| $150,000 to $199,999 | 46 | 21.4% |
| $200,000+ | 19 | 8.8% |
Family Income by Famaliy Size in Alpine
4-person families (27 | 12.6%) account for the highest median family income in Alpine with $175,625 per family, while 2-person families (144 | 67.0%) have the highest median income of $50,893 per family member.
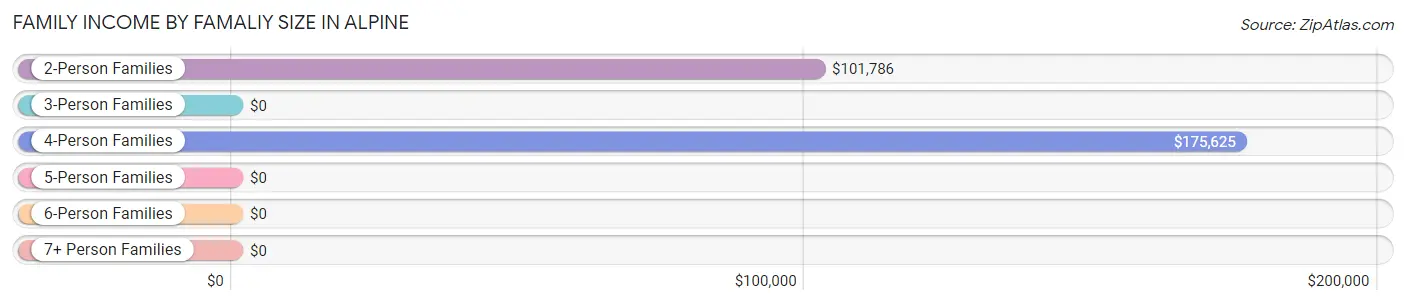
| Income Bracket | # Families | Median Income |
| 2-Person Families | 144 (67.0%) | $101,786 |
| 3-Person Families | 17 (7.9%) | $0 |
| 4-Person Families | 27 (12.6%) | $175,625 |
| 5-Person Families | 5 (2.3%) | $0 |
| 6-Person Families | 0 (0.0%) | $0 |
| 7+ Person Families | 22 (10.2%) | $0 |
| Total | 215 (100.0%) | $111,953 |
Family Income by Number of Earners in Alpine
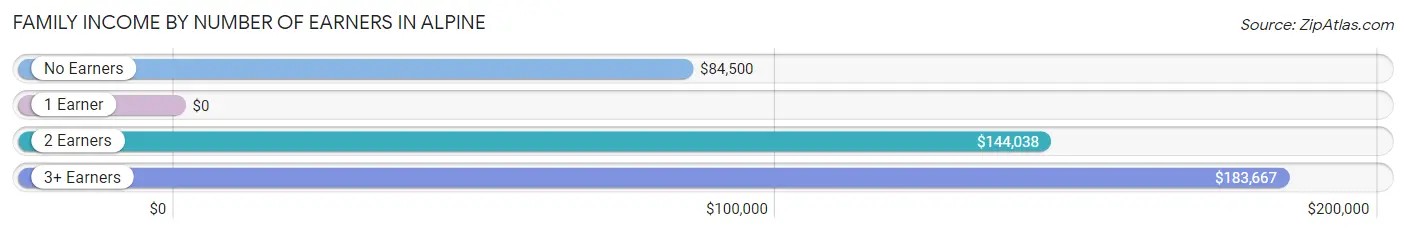
| Number of Earners | # Families | Median Income |
| No Earners | 16 (7.4%) | $84,500 |
| 1 Earner | 57 (26.5%) | $0 |
| 2 Earners | 108 (50.2%) | $144,038 |
| 3+ Earners | 34 (15.8%) | $183,667 |
| Total | 215 (100.0%) | $111,953 |
Household Income in Alpine
Household Income Brackets in Alpine
With 101 households falling in the category, the $100,000 to $149,999 income range is the most frequent in Alpine, accounting for 25.5% of all households.
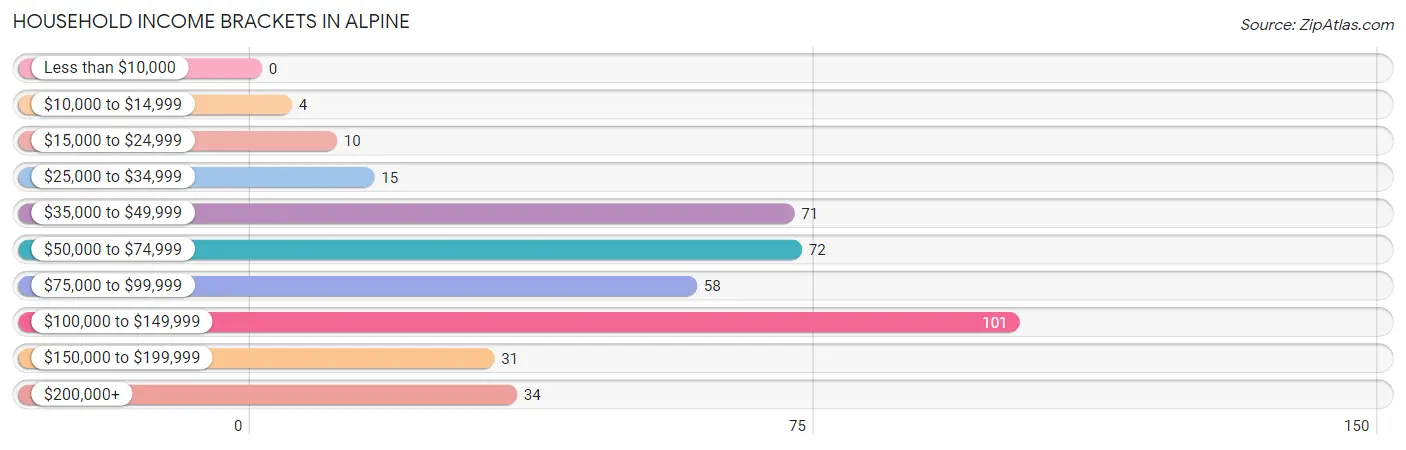
| Income Bracket | # Households | % Households |
| Less than $10,000 | 0 | 0.0% |
| $10,000 to $14,999 | 4 | 1.0% |
| $15,000 to $24,999 | 10 | 2.5% |
| $25,000 to $34,999 | 15 | 3.8% |
| $35,000 to $49,999 | 71 | 17.9% |
| $50,000 to $74,999 | 72 | 18.2% |
| $75,000 to $99,999 | 58 | 14.6% |
| $100,000 to $149,999 | 101 | 25.5% |
| $150,000 to $199,999 | 31 | 7.8% |
| $200,000+ | 34 | 8.6% |
Household Income by Householder Age in Alpine
The median household income in Alpine is $85,326, with the highest median household income of $99,625 found in the 45 to 64 years age bracket for the primary householder. A total of 135 households (34.1%) fall into this category. Meanwhile, the 15 to 24 years age bracket for the primary householder has the lowest median household income of $0, with 15 households (3.8%) in this group.
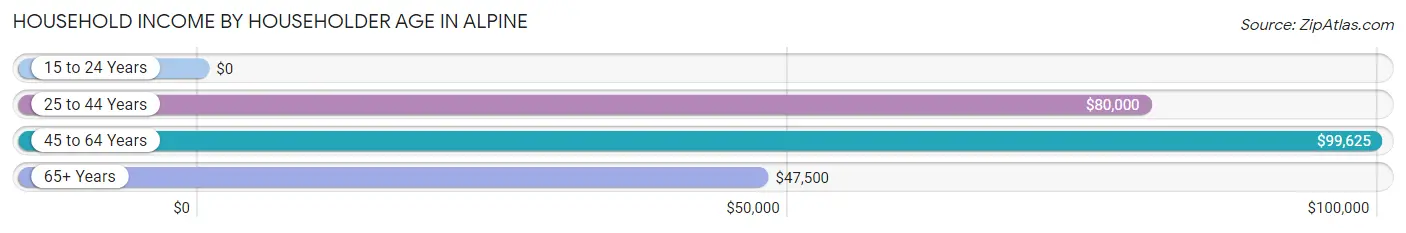
| Income Bracket | # Households | Median Income |
| 15 to 24 Years | 15 (3.8%) | $0 |
| 25 to 44 Years | 212 (53.5%) | $80,000 |
| 45 to 64 Years | 135 (34.1%) | $99,625 |
| 65+ Years | 34 (8.6%) | $47,500 |
| Total | 396 (100.0%) | $85,326 |
Poverty in Alpine
Income Below Poverty by Sex and Age in Alpine
With 5.9% poverty level for males and 13.7% for females among the residents of Alpine, 12 to 14 year old males and 65 to 74 year old females are the most vulnerable to poverty, with 5 males (45.5%) and 9 females (69.2%) in their respective age groups living below the poverty level.
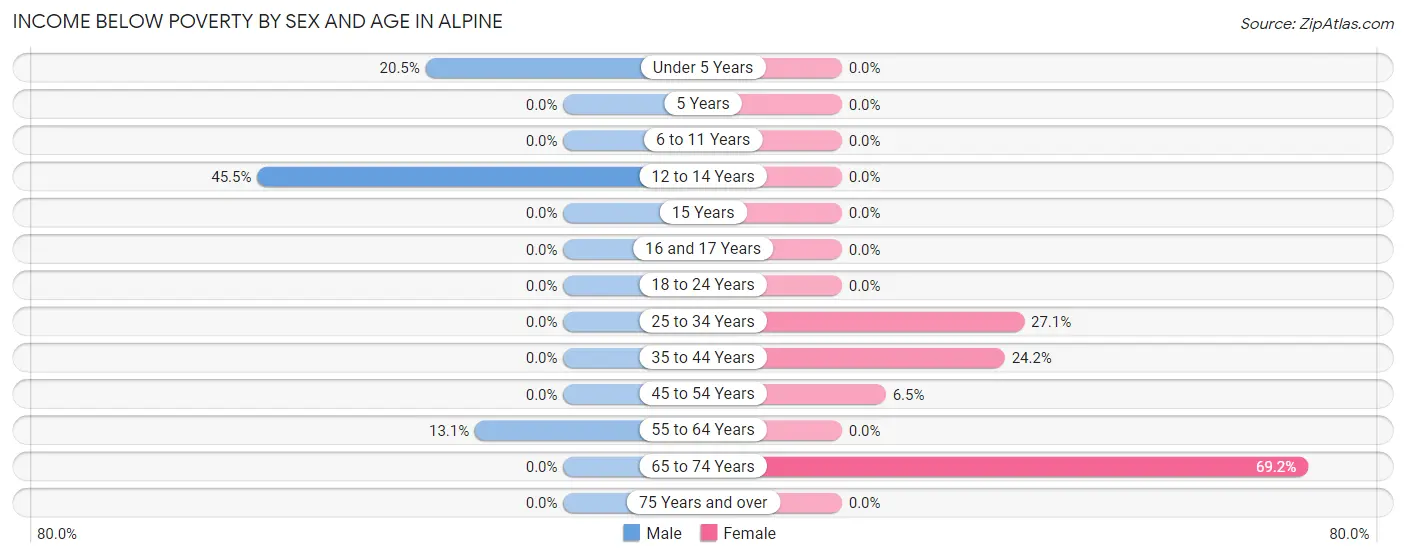
| Age Bracket | Male | Female |
| Under 5 Years | 18 (20.4%) | 0 (0.0%) |
| 5 Years | 0 (0.0%) | 0 (0.0%) |
| 6 to 11 Years | 0 (0.0%) | 0 (0.0%) |
| 12 to 14 Years | 5 (45.5%) | 0 (0.0%) |
| 15 Years | 0 (0.0%) | 0 (0.0%) |
| 16 and 17 Years | 0 (0.0%) | 0 (0.0%) |
| 18 to 24 Years | 0 (0.0%) | 0 (0.0%) |
| 25 to 34 Years | 0 (0.0%) | 23 (27.1%) |
| 35 to 44 Years | 0 (0.0%) | 15 (24.2%) |
| 45 to 54 Years | 0 (0.0%) | 3 (6.5%) |
| 55 to 64 Years | 8 (13.1%) | 0 (0.0%) |
| 65 to 74 Years | 0 (0.0%) | 9 (69.2%) |
| 75 Years and over | 0 (0.0%) | 0 (0.0%) |
| Total | 31 (5.9%) | 50 (13.7%) |
Income Above Poverty by Sex and Age in Alpine
According to the poverty statistics in Alpine, males aged 5 years and females aged under 5 years are the age groups that are most secure financially, with 100.0% of males and 100.0% of females in these age groups living above the poverty line.
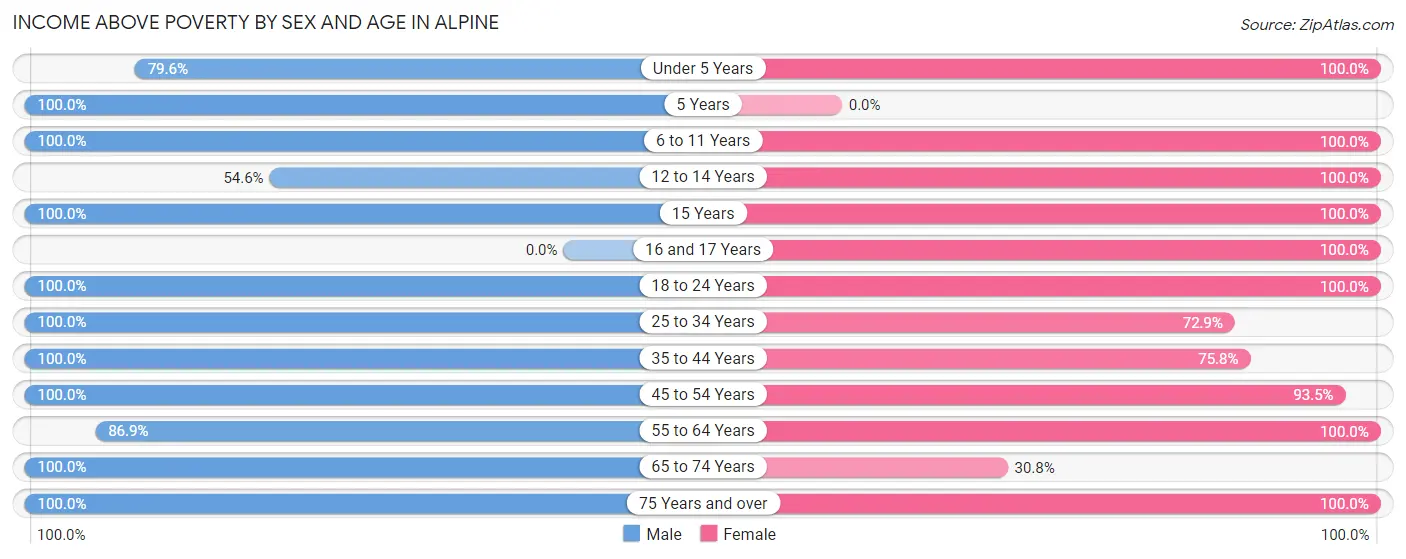
| Age Bracket | Male | Female |
| Under 5 Years | 70 (79.5%) | 38 (100.0%) |
| 5 Years | 7 (100.0%) | 0 (0.0%) |
| 6 to 11 Years | 9 (100.0%) | 8 (100.0%) |
| 12 to 14 Years | 6 (54.5%) | 6 (100.0%) |
| 15 Years | 9 (100.0%) | 7 (100.0%) |
| 16 and 17 Years | 0 (0.0%) | 10 (100.0%) |
| 18 to 24 Years | 62 (100.0%) | 15 (100.0%) |
| 25 to 34 Years | 105 (100.0%) | 62 (72.9%) |
| 35 to 44 Years | 59 (100.0%) | 47 (75.8%) |
| 45 to 54 Years | 71 (100.0%) | 43 (93.5%) |
| 55 to 64 Years | 53 (86.9%) | 61 (100.0%) |
| 65 to 74 Years | 29 (100.0%) | 4 (30.8%) |
| 75 Years and over | 15 (100.0%) | 14 (100.0%) |
| Total | 495 (94.1%) | 315 (86.3%) |
Income Below Poverty Among Married-Couple Families in Alpine
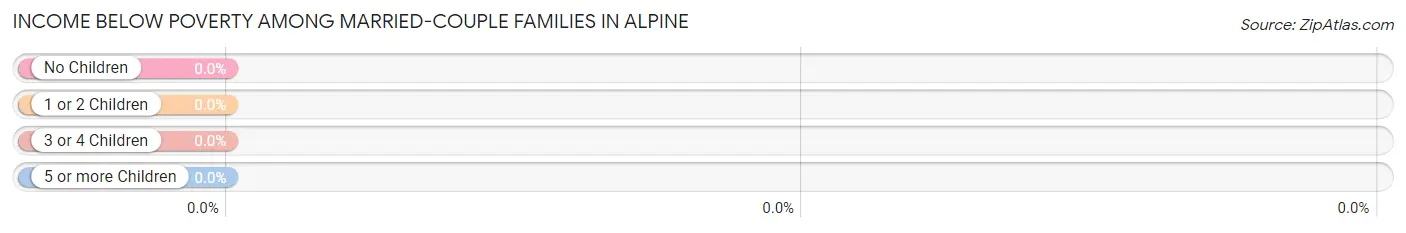
| Children | Above Poverty | Below Poverty |
| No Children | 94 (100.0%) | 0 (0.0%) |
| 1 or 2 Children | 34 (100.0%) | 0 (0.0%) |
| 3 or 4 Children | 20 (100.0%) | 0 (0.0%) |
| 5 or more Children | 7 (100.0%) | 0 (0.0%) |
| Total | 155 (100.0%) | 0 (0.0%) |
Income Below Poverty Among Single-Parent Households in Alpine
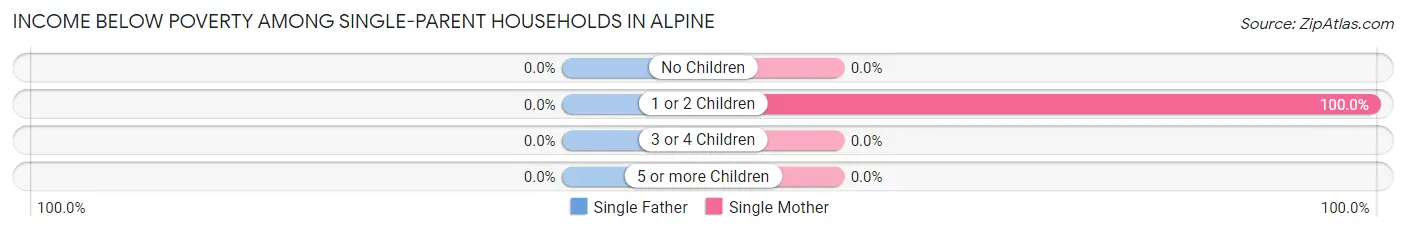
| Children | Single Father | Single Mother |
| No Children | 0 (0.0%) | 0 (0.0%) |
| 1 or 2 Children | 0 (0.0%) | 27 (100.0%) |
| 3 or 4 Children | 0 (0.0%) | 0 (0.0%) |
| 5 or more Children | 0 (0.0%) | 0 (0.0%) |
| Total | 0 (0.0%) | 27 (73.0%) |
Income Below Poverty Among Married-Couple vs Single-Parent Households in Alpine
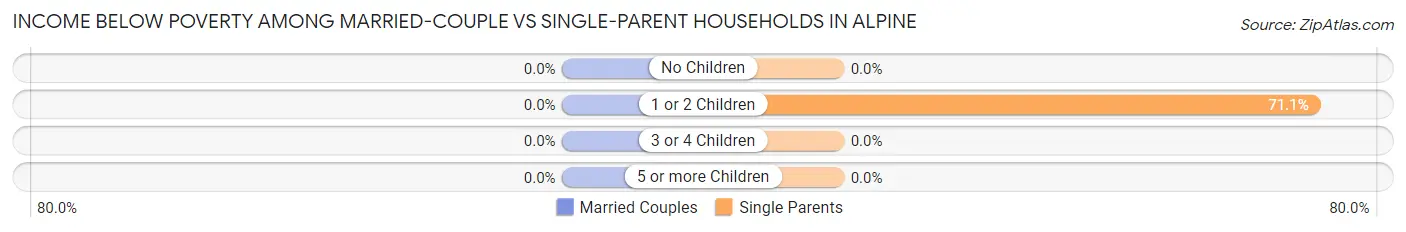
| Children | Married-Couple Families | Single-Parent Households |
| No Children | 0 (0.0%) | 0 (0.0%) |
| 1 or 2 Children | 0 (0.0%) | 27 (71.1%) |
| 3 or 4 Children | 0 (0.0%) | 0 (0.0%) |
| 5 or more Children | 0 (0.0%) | 0 (0.0%) |
| Total | 0 (0.0%) | 27 (45.0%) |
Race in Alpine
The most populous races in Alpine are White / Caucasian (808 | 90.7%), Two or more Races (52 | 5.8%), and Hispanic or Latino (40 | 4.5%).
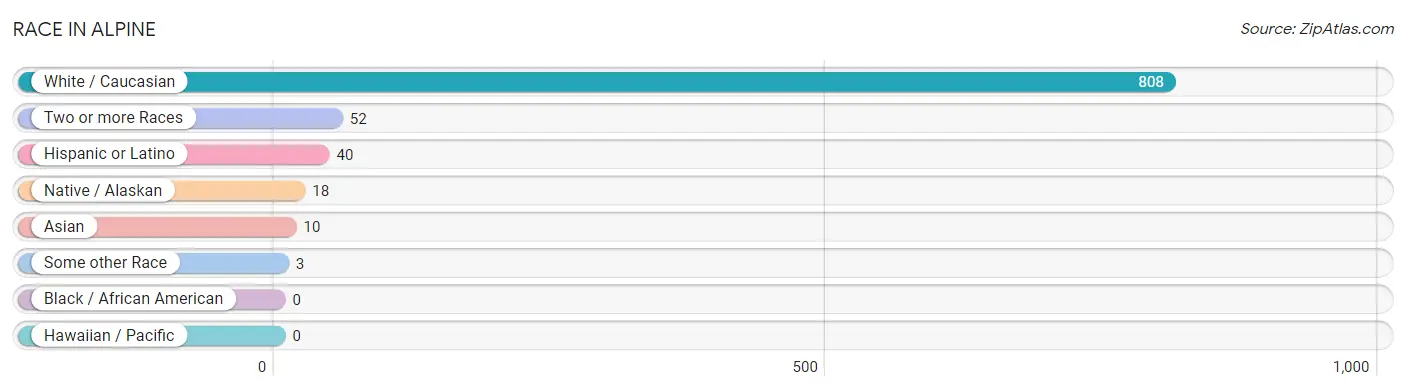
| Race | # Population | % Population |
| Asian | 10 | 1.1% |
| Black / African American | 0 | 0.0% |
| Hawaiian / Pacific | 0 | 0.0% |
| Hispanic or Latino | 40 | 4.5% |
| Native / Alaskan | 18 | 2.0% |
| White / Caucasian | 808 | 90.7% |
| Two or more Races | 52 | 5.8% |
| Some other Race | 3 | 0.3% |
| Total | 891 | 100.0% |
Ancestry in Alpine
The most populous ancestries reported in Alpine are German (248 | 27.8%), Irish (138 | 15.5%), English (97 | 10.9%), European (73 | 8.2%), and Norwegian (55 | 6.2%), together accounting for 68.6% of all Alpine residents.
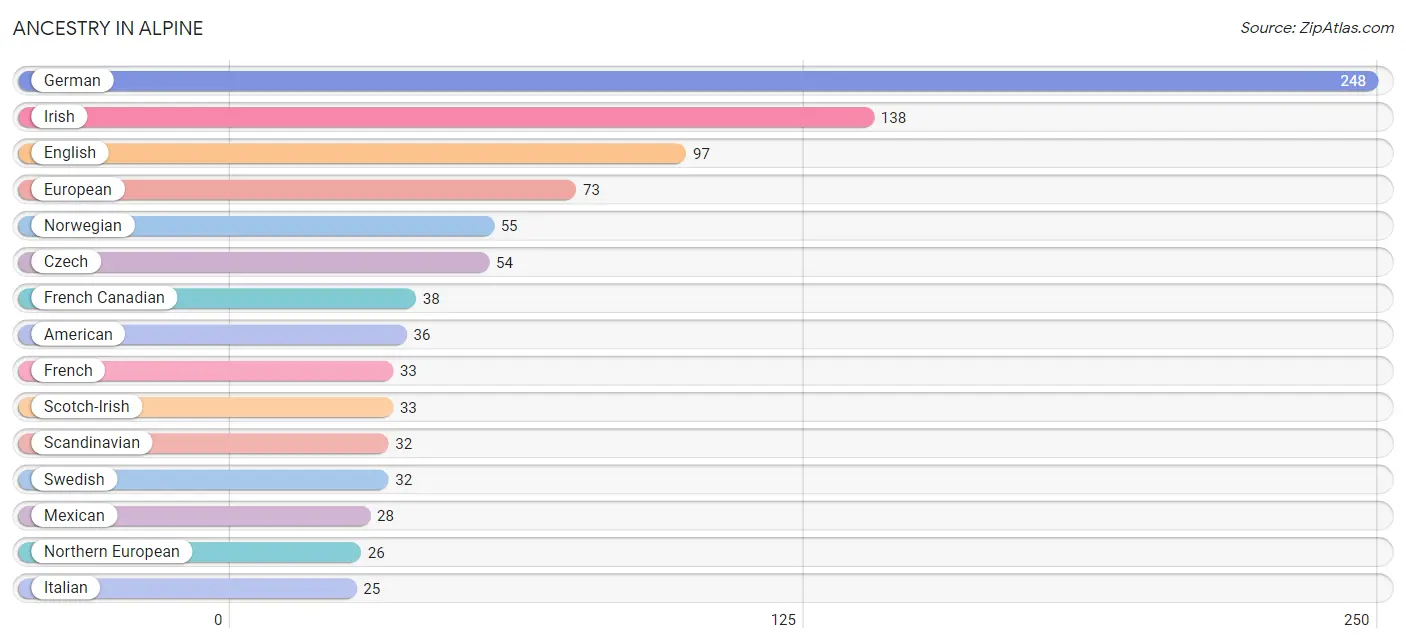
| Ancestry | # Population | % Population |
| African | 11 | 1.2% |
| American | 36 | 4.0% |
| Belgian | 6 | 0.7% |
| Bhutanese | 7 | 0.8% |
| Brazilian | 4 | 0.4% |
| British | 8 | 0.9% |
| Cherokee | 6 | 0.7% |
| Chippewa | 3 | 0.3% |
| Colville | 9 | 1.0% |
| Czech | 54 | 6.1% |
| Czechoslovakian | 6 | 0.7% |
| Danish | 14 | 1.6% |
| English | 97 | 10.9% |
| European | 73 | 8.2% |
| Finnish | 13 | 1.5% |
| French | 33 | 3.7% |
| French Canadian | 38 | 4.3% |
| German | 248 | 27.8% |
| Irish | 138 | 15.5% |
| Italian | 25 | 2.8% |
| Korean | 3 | 0.3% |
| Mexican | 28 | 3.1% |
| Northern European | 26 | 2.9% |
| Norwegian | 55 | 6.2% |
| Polish | 22 | 2.5% |
| Puerto Rican | 12 | 1.3% |
| Russian | 2 | 0.2% |
| Scandinavian | 32 | 3.6% |
| Scotch-Irish | 33 | 3.7% |
| Scottish | 16 | 1.8% |
| Sioux | 12 | 1.3% |
| Subsaharan African | 11 | 1.2% |
| Swedish | 32 | 3.6% |
| Swiss | 10 | 1.1% | View All 34 Rows |
Immigrants in Alpine
The most numerous immigrant groups reported in Alpine came from Latin America (11 | 1.2%), Central America (7 | 0.8%), Mexico (7 | 0.8%), Brazil (4 | 0.4%), and South America (4 | 0.4%), together accounting for 3.7% of all Alpine residents.
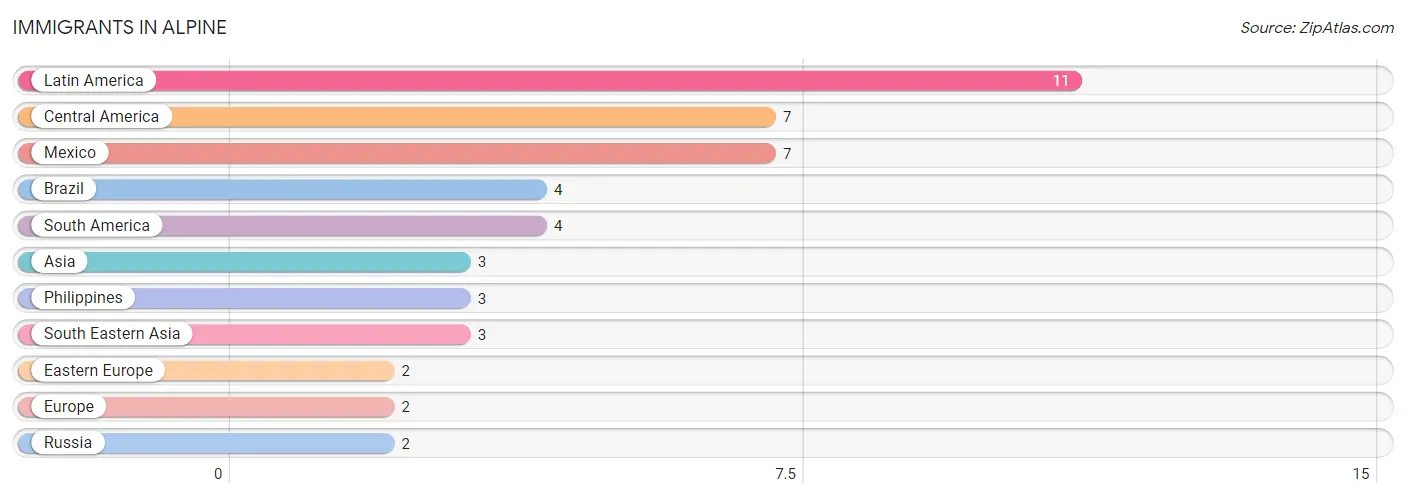
| Immigration Origin | # Population | % Population |
| Asia | 3 | 0.3% |
| Brazil | 4 | 0.4% |
| Central America | 7 | 0.8% |
| Eastern Europe | 2 | 0.2% |
| Europe | 2 | 0.2% |
| Latin America | 11 | 1.2% |
| Mexico | 7 | 0.8% |
| Philippines | 3 | 0.3% |
| Russia | 2 | 0.2% |
| South America | 4 | 0.4% |
| South Eastern Asia | 3 | 0.3% | View All 11 Rows |
Sex and Age in Alpine
Sex and Age in Alpine
The most populous age groups in Alpine are Under 5 Years (88 | 16.7%) for men and 30 to 34 Years (43 | 11.8%) for women.
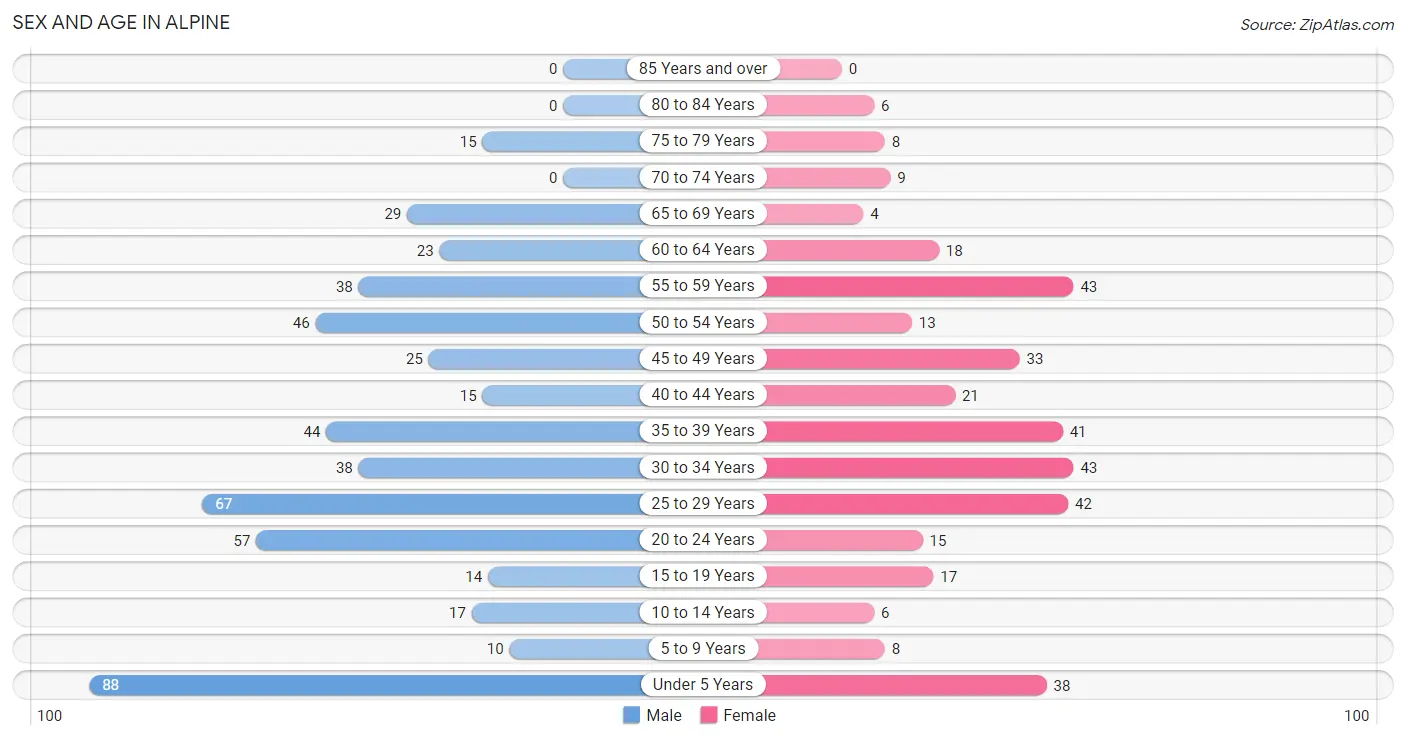
| Age Bracket | Male | Female |
| Under 5 Years | 88 (16.7%) | 38 (10.4%) |
| 5 to 9 Years | 10 (1.9%) | 8 (2.2%) |
| 10 to 14 Years | 17 (3.2%) | 6 (1.6%) |
| 15 to 19 Years | 14 (2.7%) | 17 (4.7%) |
| 20 to 24 Years | 57 (10.8%) | 15 (4.1%) |
| 25 to 29 Years | 67 (12.7%) | 42 (11.5%) |
| 30 to 34 Years | 38 (7.2%) | 43 (11.8%) |
| 35 to 39 Years | 44 (8.4%) | 41 (11.2%) |
| 40 to 44 Years | 15 (2.9%) | 21 (5.8%) |
| 45 to 49 Years | 25 (4.8%) | 33 (9.0%) |
| 50 to 54 Years | 46 (8.7%) | 13 (3.6%) |
| 55 to 59 Years | 38 (7.2%) | 43 (11.8%) |
| 60 to 64 Years | 23 (4.4%) | 18 (4.9%) |
| 65 to 69 Years | 29 (5.5%) | 4 (1.1%) |
| 70 to 74 Years | 0 (0.0%) | 9 (2.5%) |
| 75 to 79 Years | 15 (2.9%) | 8 (2.2%) |
| 80 to 84 Years | 0 (0.0%) | 6 (1.6%) |
| 85 Years and over | 0 (0.0%) | 0 (0.0%) |
| Total | 526 (100.0%) | 365 (100.0%) |
Families and Households in Alpine
Median Family Size in Alpine
The median family size in Alpine is 2.92 persons per family, with married-couple families (155 | 72.1%) accounting for the largest median family size of 3.13 persons per family. On the other hand, single male/father families (23 | 10.7%) represent the smallest median family size with 2.00 persons per family.
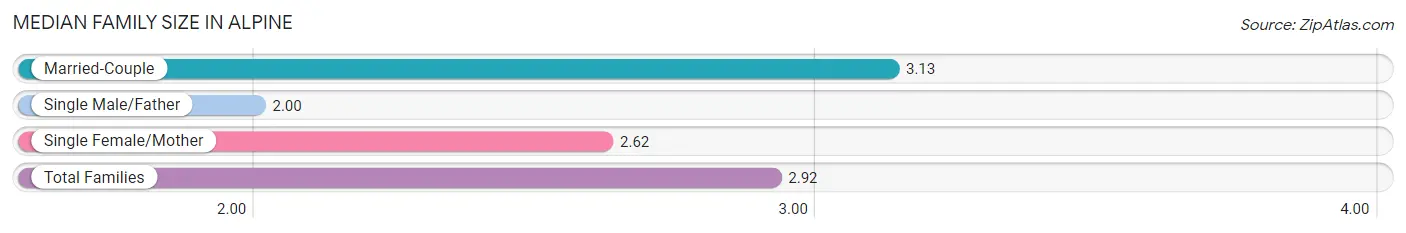
| Family Type | # Families | Family Size |
| Married-Couple | 155 (72.1%) | 3.13 |
| Single Male/Father | 23 (10.7%) | 2.00 |
| Single Female/Mother | 37 (17.2%) | 2.62 |
| Total Families | 215 (100.0%) | 2.92 |
Median Household Size in Alpine
The median household size in Alpine is 2.25 persons per household, with married-couple households (155 | 39.1%) accounting for the largest median household size of 3.25 persons per household. non-family households (181 | 45.7%) represent the smallest median household size with 1.15 persons per household.
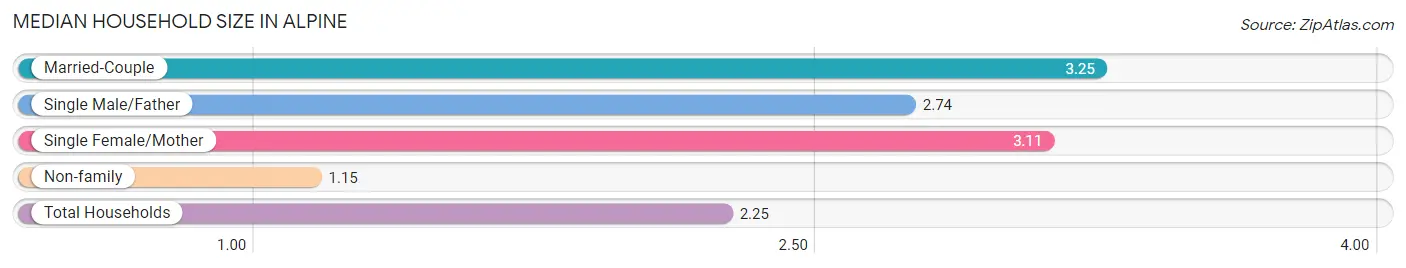
| Household Type | # Households | Household Size |
| Married-Couple | 155 (39.1%) | 3.25 |
| Single Male/Father | 23 (5.8%) | 2.74 |
| Single Female/Mother | 37 (9.3%) | 3.11 |
| Non-family | 181 (45.7%) | 1.15 |
| Total Households | 396 (100.0%) | 2.25 |
Household Size by Marriage Status in Alpine
Out of a total of 396 households in Alpine, 215 (54.3%) are family households, while 181 (45.7%) are nonfamily households. The most numerous type of family households are 2-person households, comprising 98, and the most common type of nonfamily households are 1-person households, comprising 158.
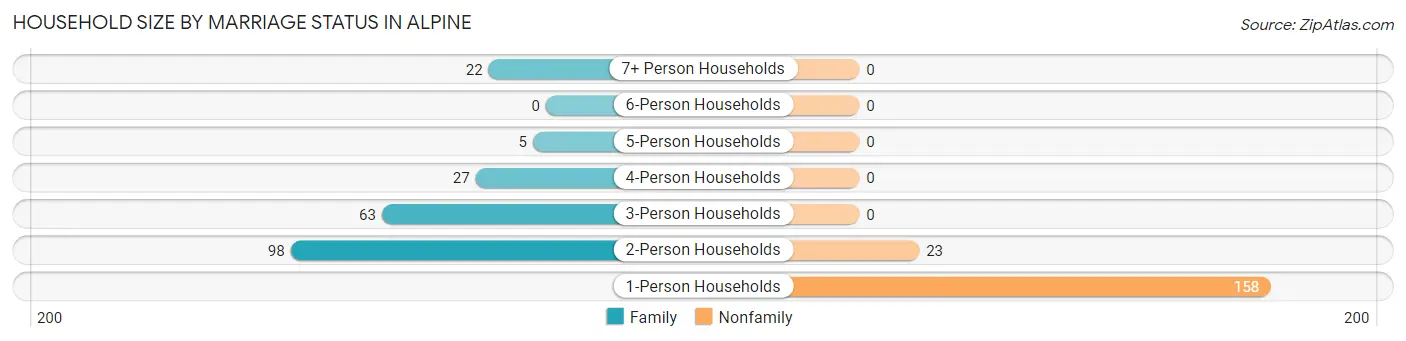
| Household Size | Family Households | Nonfamily Households |
| 1-Person Households | - | 158 (39.9%) |
| 2-Person Households | 98 (24.7%) | 23 (5.8%) |
| 3-Person Households | 63 (15.9%) | 0 (0.0%) |
| 4-Person Households | 27 (6.8%) | 0 (0.0%) |
| 5-Person Households | 5 (1.3%) | 0 (0.0%) |
| 6-Person Households | 0 (0.0%) | 0 (0.0%) |
| 7+ Person Households | 22 (5.6%) | 0 (0.0%) |
| Total | 215 (54.3%) | 181 (45.7%) |
Female Fertility in Alpine
Fertility by Age in Alpine
Average fertility rate in Alpine is 151.0 births per 1,000 women. Women in the age bracket of 35 to 50 years have the highest fertility rate with 296.0 births per 1,000 women. Women in the age bracket of 35 to 50 years acount for 94.1% of all women with births.
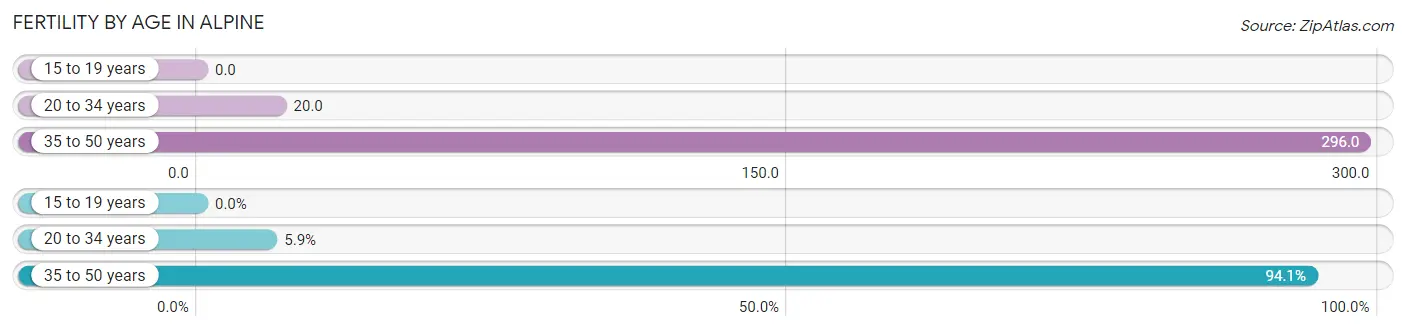
| Age Bracket | Women with Births | Births / 1,000 Women |
| 15 to 19 years | 0 (0.0%) | 0.0 |
| 20 to 34 years | 2 (5.9%) | 20.0 |
| 35 to 50 years | 32 (94.1%) | 296.0 |
| Total | 34 (100.0%) | 151.0 |
Fertility by Age by Marriage Status in Alpine
67.6% of women with births (34) in Alpine are married. The highest percentage of unmarried women with births falls into 35 to 50 years age bracket with 34.4% of them unmarried at the time of birth, while the lowest percentage of unmarried women with births belong to 20 to 34 years age bracket with 0.0% of them unmarried.
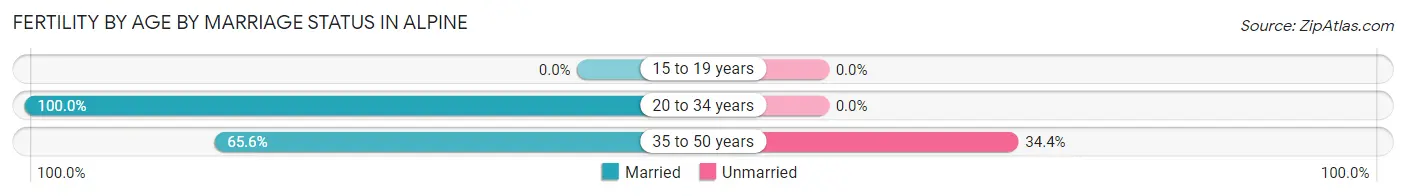
| Age Bracket | Married | Unmarried |
| 15 to 19 years | 0 (0.0%) | 0 (0.0%) |
| 20 to 34 years | 2 (100.0%) | 0 (0.0%) |
| 35 to 50 years | 21 (65.6%) | 11 (34.4%) |
| Total | 23 (67.6%) | 11 (32.4%) |
Fertility by Education in Alpine
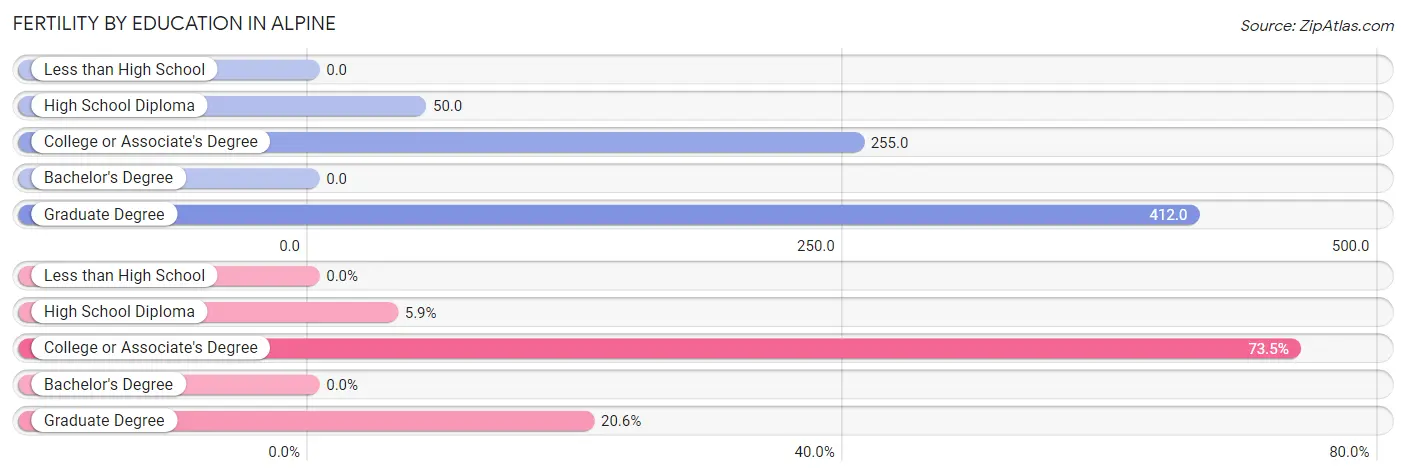
| Educational Attainment | Women with Births | Births / 1,000 Women |
| Less than High School | 0 (0.0%) | 0.0 |
| High School Diploma | 2 (5.9%) | 50.0 |
| College or Associate's Degree | 25 (73.5%) | 255.0 |
| Bachelor's Degree | 0 (0.0%) | 0.0 |
| Graduate Degree | 7 (20.6%) | 412.0 |
| Total | 34 (100.0%) | 151.0 |
Fertility by Education by Marriage Status in Alpine
32.4% of women with births in Alpine are unmarried. Women with the educational attainment of high school diploma are most likely to be married with 100.0% of them married at childbirth, while women with the educational attainment of college or associate's degree are least likely to be married with 44.0% of them unmarried at childbirth.
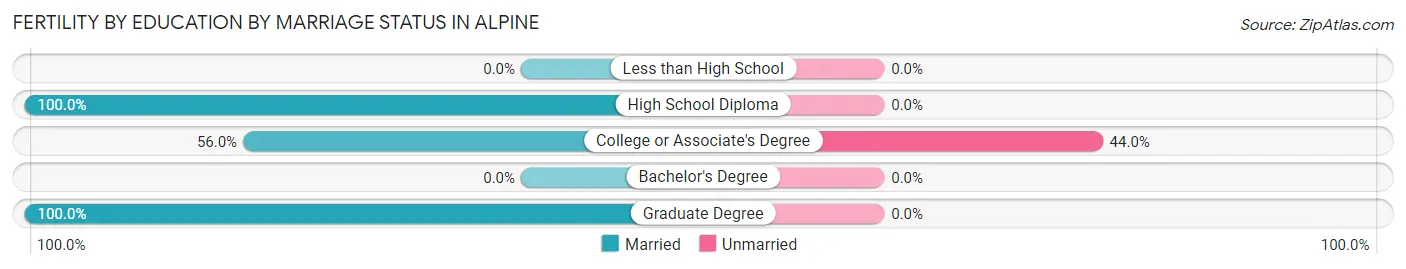
| Educational Attainment | Married | Unmarried |
| Less than High School | 0 (0.0%) | 0 (0.0%) |
| High School Diploma | 2 (100.0%) | 0 (0.0%) |
| College or Associate's Degree | 14 (56.0%) | 11 (44.0%) |
| Bachelor's Degree | 0 (0.0%) | 0 (0.0%) |
| Graduate Degree | 7 (100.0%) | 0 (0.0%) |
| Total | 23 (67.6%) | 11 (32.4%) |
Employment Characteristics in Alpine
Employment by Class of Employer in Alpine
Among the 572 employed individuals in Alpine, private company employees (459 | 80.2%), not-for-profit organizations (44 | 7.7%), and local government employees (33 | 5.8%) make up the most common classes of employment.
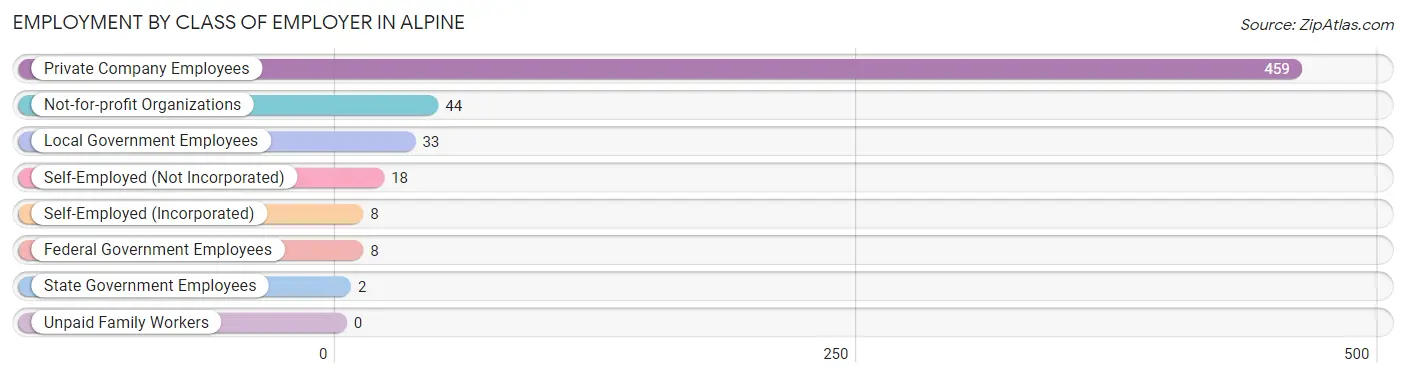
| Employer Class | # Employees | % Employees |
| Private Company Employees | 459 | 80.2% |
| Self-Employed (Incorporated) | 8 | 1.4% |
| Self-Employed (Not Incorporated) | 18 | 3.2% |
| Not-for-profit Organizations | 44 | 7.7% |
| Local Government Employees | 33 | 5.8% |
| State Government Employees | 2 | 0.4% |
| Federal Government Employees | 8 | 1.4% |
| Unpaid Family Workers | 0 | 0.0% |
| Total | 572 | 100.0% |
Employment Status by Age in Alpine
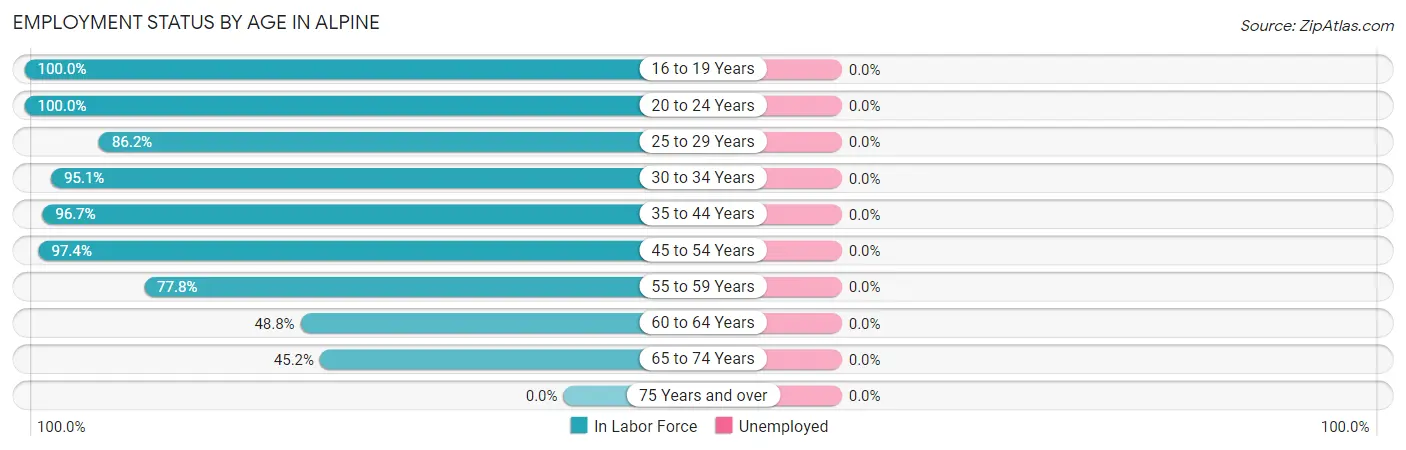
| Age Bracket | In Labor Force | Unemployed |
| 16 to 19 Years | 15 (100.0%) | 0 (0.0%) |
| 20 to 24 Years | 72 (100.0%) | 0 (0.0%) |
| 25 to 29 Years | 94 (86.2%) | 0 (0.0%) |
| 30 to 34 Years | 77 (95.1%) | 0 (0.0%) |
| 35 to 44 Years | 117 (96.7%) | 0 (0.0%) |
| 45 to 54 Years | 114 (97.4%) | 0 (0.0%) |
| 55 to 59 Years | 63 (77.8%) | 0 (0.0%) |
| 60 to 64 Years | 20 (48.8%) | 0 (0.0%) |
| 65 to 74 Years | 19 (45.2%) | 0 (0.0%) |
| 75 Years and over | 0 (0.0%) | 0 (0.0%) |
| Total | 591 (83.5%) | 0 (0.0%) |
Employment Status by Educational Attainment in Alpine
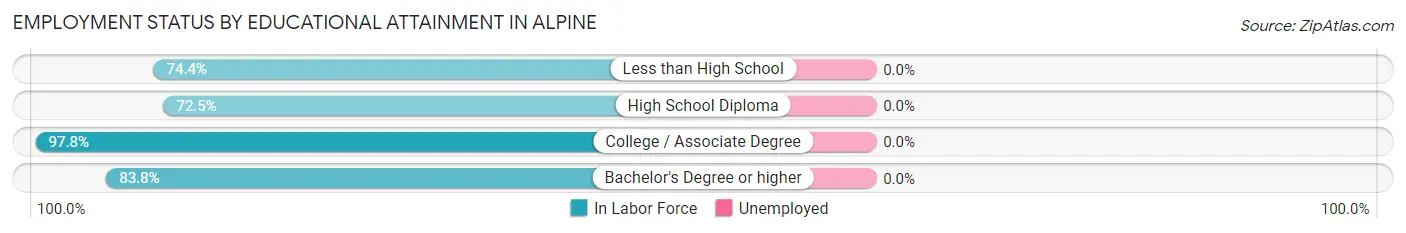
| Educational Attainment | In Labor Force | Unemployed |
| Less than High School | 32 (74.4%) | 0 (0.0%) |
| High School Diploma | 58 (72.5%) | 0 (0.0%) |
| College / Associate Degree | 261 (97.8%) | 0 (0.0%) |
| Bachelor's Degree or higher | 134 (83.8%) | 0 (0.0%) |
| Total | 485 (88.2%) | 0 (0.0%) |
Employment Occupations by Sex in Alpine
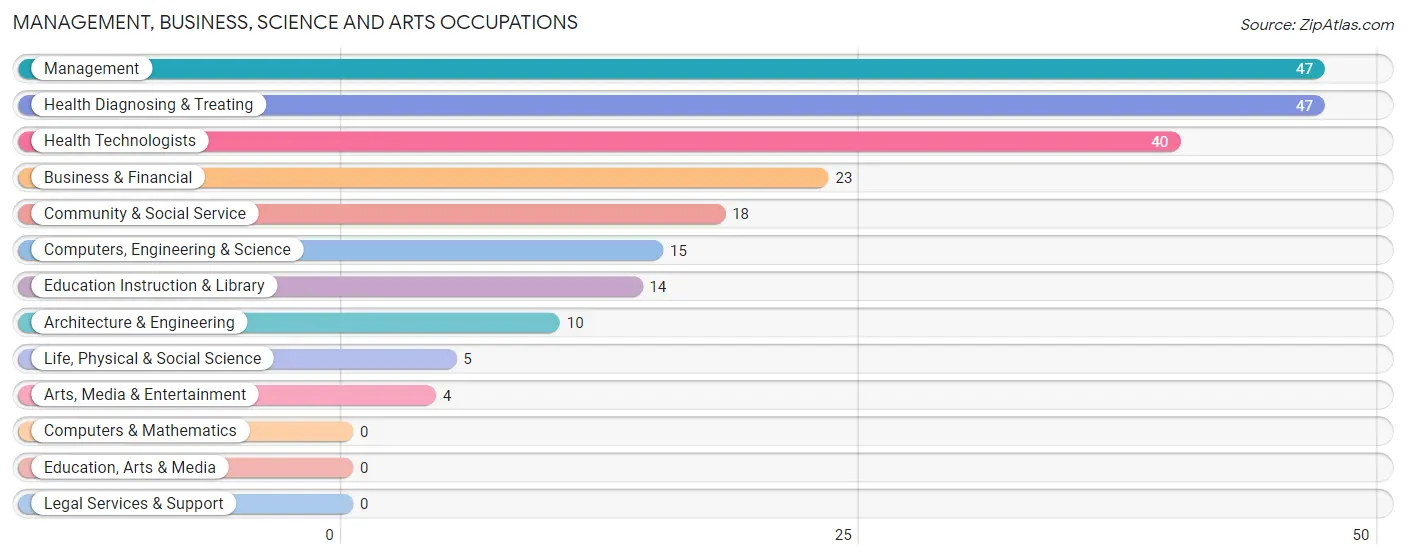
Management, Business, Science and Arts Occupations
The most common Management, Business, Science and Arts occupations in Alpine are Management (47 | 8.0%), Health Diagnosing & Treating (47 | 8.0%), Health Technologists (40 | 6.8%), Business & Financial (23 | 3.9%), and Community & Social Service (18 | 3.0%).
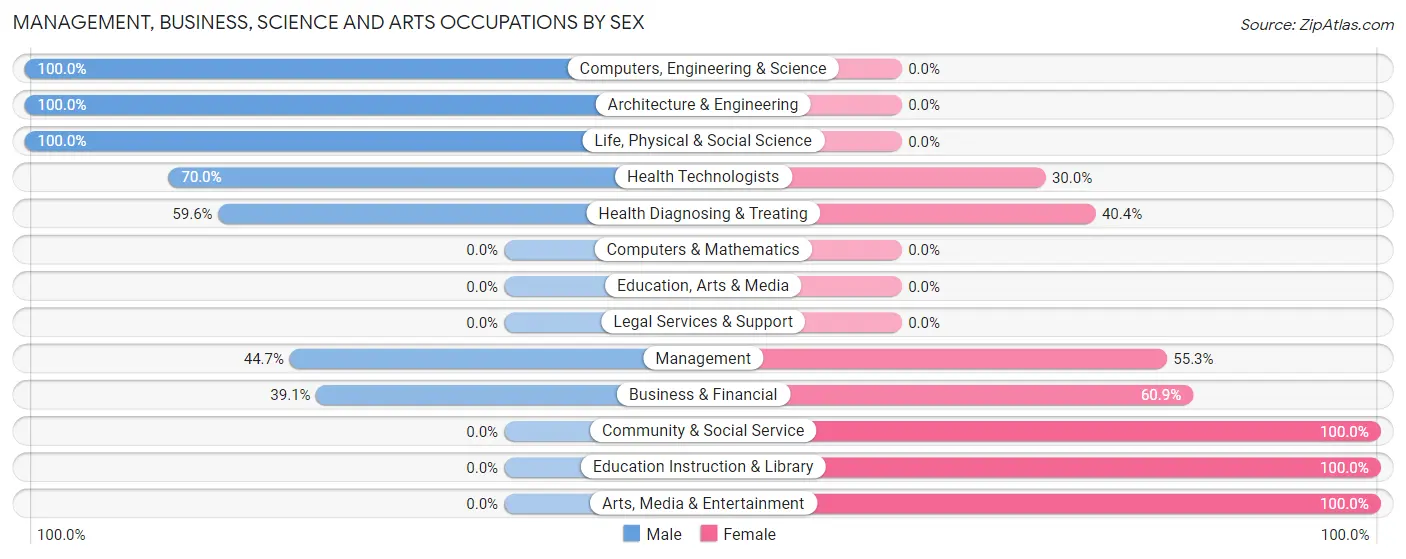
Management, Business, Science and Arts Occupations by Sex
Within the Management, Business, Science and Arts occupations in Alpine, the most male-oriented occupations are Computers, Engineering & Science (100.0%), Architecture & Engineering (100.0%), and Life, Physical & Social Science (100.0%), while the most female-oriented occupations are Community & Social Service (100.0%), Education Instruction & Library (100.0%), and Arts, Media & Entertainment (100.0%).
| Occupation | Male | Female |
| Management | 21 (44.7%) | 26 (55.3%) |
| Business & Financial | 9 (39.1%) | 14 (60.9%) |
| Computers, Engineering & Science | 15 (100.0%) | 0 (0.0%) |
| Computers & Mathematics | 0 (0.0%) | 0 (0.0%) |
| Architecture & Engineering | 10 (100.0%) | 0 (0.0%) |
| Life, Physical & Social Science | 5 (100.0%) | 0 (0.0%) |
| Community & Social Service | 0 (0.0%) | 18 (100.0%) |
| Education, Arts & Media | 0 (0.0%) | 0 (0.0%) |
| Legal Services & Support | 0 (0.0%) | 0 (0.0%) |
| Education Instruction & Library | 0 (0.0%) | 14 (100.0%) |
| Arts, Media & Entertainment | 0 (0.0%) | 4 (100.0%) |
| Health Diagnosing & Treating | 28 (59.6%) | 19 (40.4%) |
| Health Technologists | 28 (70.0%) | 12 (30.0%) |
| Total (Category) | 73 (48.7%) | 77 (51.3%) |
| Total (Overall) | 340 (57.5%) | 251 (42.5%) |
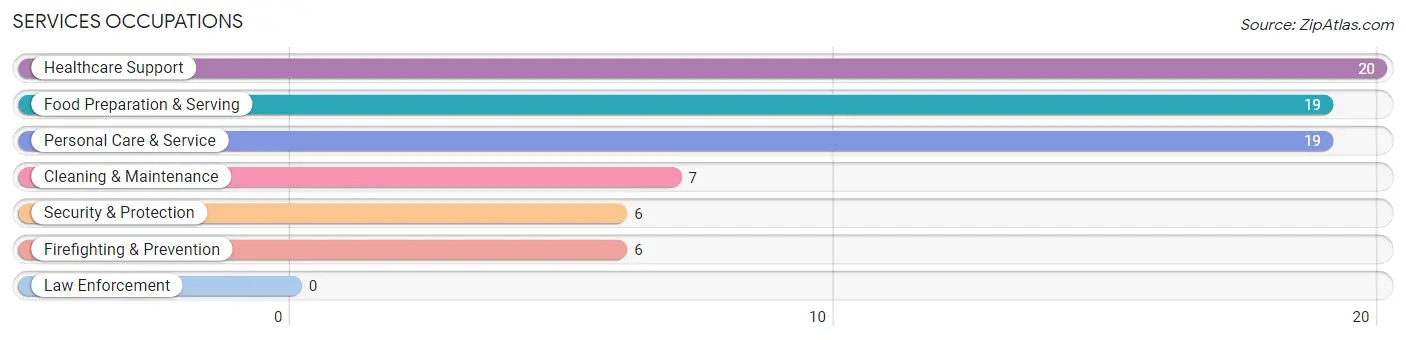
Services Occupations
The most common Services occupations in Alpine are Healthcare Support (20 | 3.4%), Food Preparation & Serving (19 | 3.2%), Personal Care & Service (19 | 3.2%), Cleaning & Maintenance (7 | 1.2%), and Security & Protection (6 | 1.0%).
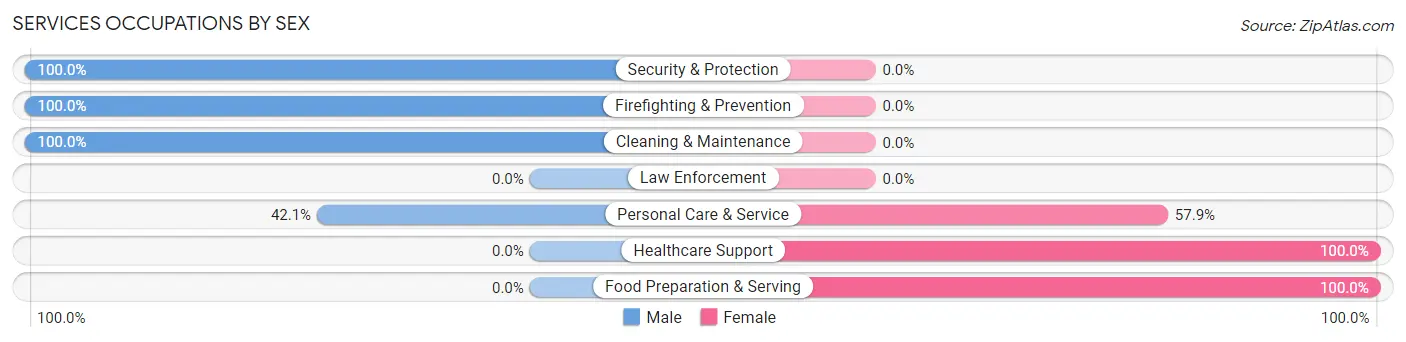
Services Occupations by Sex
Within the Services occupations in Alpine, the most male-oriented occupations are Security & Protection (100.0%), Firefighting & Prevention (100.0%), and Cleaning & Maintenance (100.0%), while the most female-oriented occupations are Healthcare Support (100.0%), Food Preparation & Serving (100.0%), and Personal Care & Service (57.9%).
| Occupation | Male | Female |
| Healthcare Support | 0 (0.0%) | 20 (100.0%) |
| Security & Protection | 6 (100.0%) | 0 (0.0%) |
| Firefighting & Prevention | 6 (100.0%) | 0 (0.0%) |
| Law Enforcement | 0 (0.0%) | 0 (0.0%) |
| Food Preparation & Serving | 0 (0.0%) | 19 (100.0%) |
| Cleaning & Maintenance | 7 (100.0%) | 0 (0.0%) |
| Personal Care & Service | 8 (42.1%) | 11 (57.9%) |
| Total (Category) | 21 (29.6%) | 50 (70.4%) |
| Total (Overall) | 340 (57.5%) | 251 (42.5%) |
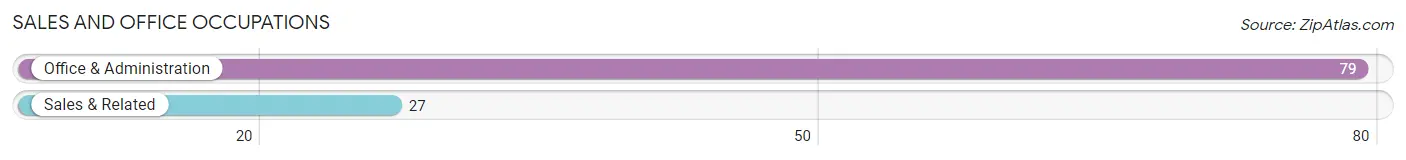
Sales and Office Occupations
The most common Sales and Office occupations in Alpine are Office & Administration (79 | 13.4%), and Sales & Related (27 | 4.6%).
Sales and Office Occupations by Sex
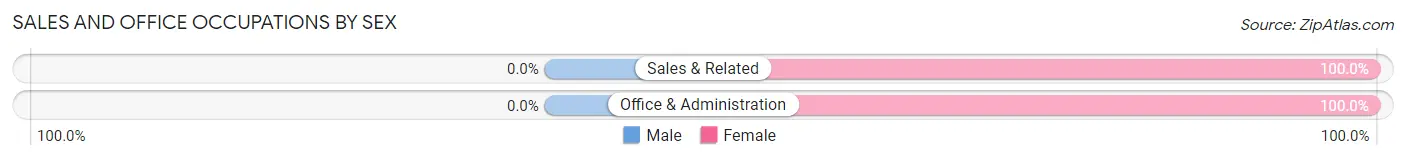
| Occupation | Male | Female |
| Sales & Related | 0 (0.0%) | 27 (100.0%) |
| Office & Administration | 0 (0.0%) | 79 (100.0%) |
| Total (Category) | 0 (0.0%) | 106 (100.0%) |
| Total (Overall) | 340 (57.5%) | 251 (42.5%) |
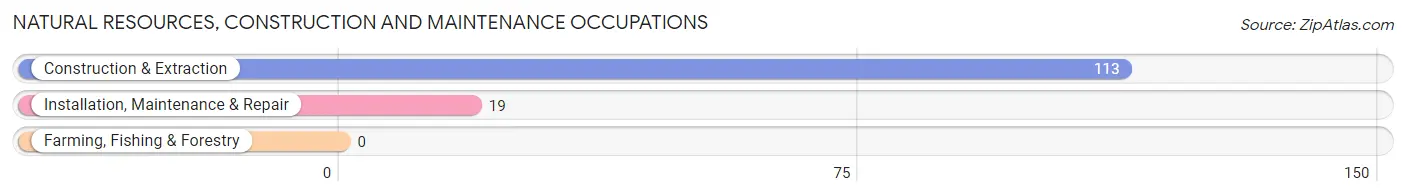
Natural Resources, Construction and Maintenance Occupations
The most common Natural Resources, Construction and Maintenance occupations in Alpine are Construction & Extraction (113 | 19.1%), and Installation, Maintenance & Repair (19 | 3.2%).
Natural Resources, Construction and Maintenance Occupations by Sex
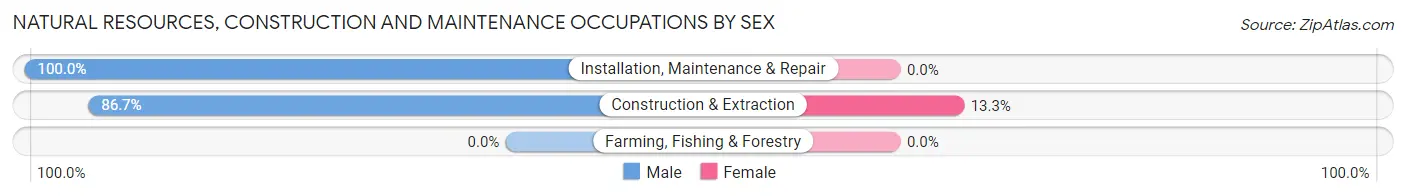
| Occupation | Male | Female |
| Farming, Fishing & Forestry | 0 (0.0%) | 0 (0.0%) |
| Construction & Extraction | 98 (86.7%) | 15 (13.3%) |
| Installation, Maintenance & Repair | 19 (100.0%) | 0 (0.0%) |
| Total (Category) | 117 (88.6%) | 15 (11.4%) |
| Total (Overall) | 340 (57.5%) | 251 (42.5%) |
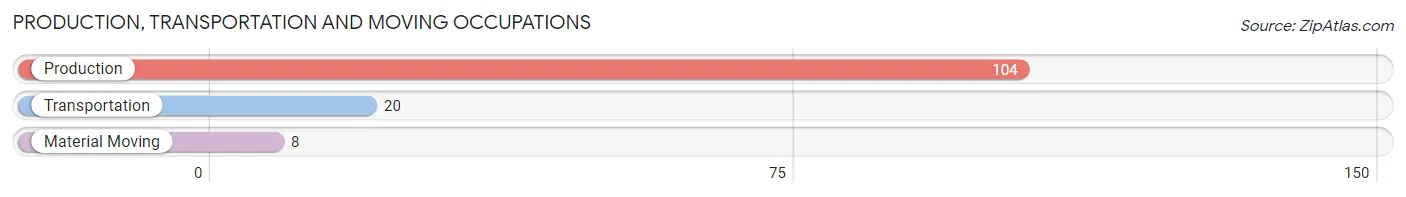
Production, Transportation and Moving Occupations
The most common Production, Transportation and Moving occupations in Alpine are Production (104 | 17.6%), Transportation (20 | 3.4%), and Material Moving (8 | 1.3%).
Production, Transportation and Moving Occupations by Sex
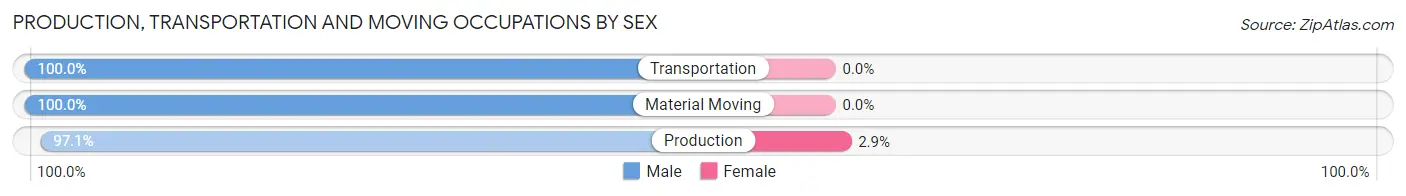
| Occupation | Male | Female |
| Production | 101 (97.1%) | 3 (2.9%) |
| Transportation | 20 (100.0%) | 0 (0.0%) |
| Material Moving | 8 (100.0%) | 0 (0.0%) |
| Total (Category) | 129 (97.7%) | 3 (2.3%) |
| Total (Overall) | 340 (57.5%) | 251 (42.5%) |
Employment Industries by Sex in Alpine
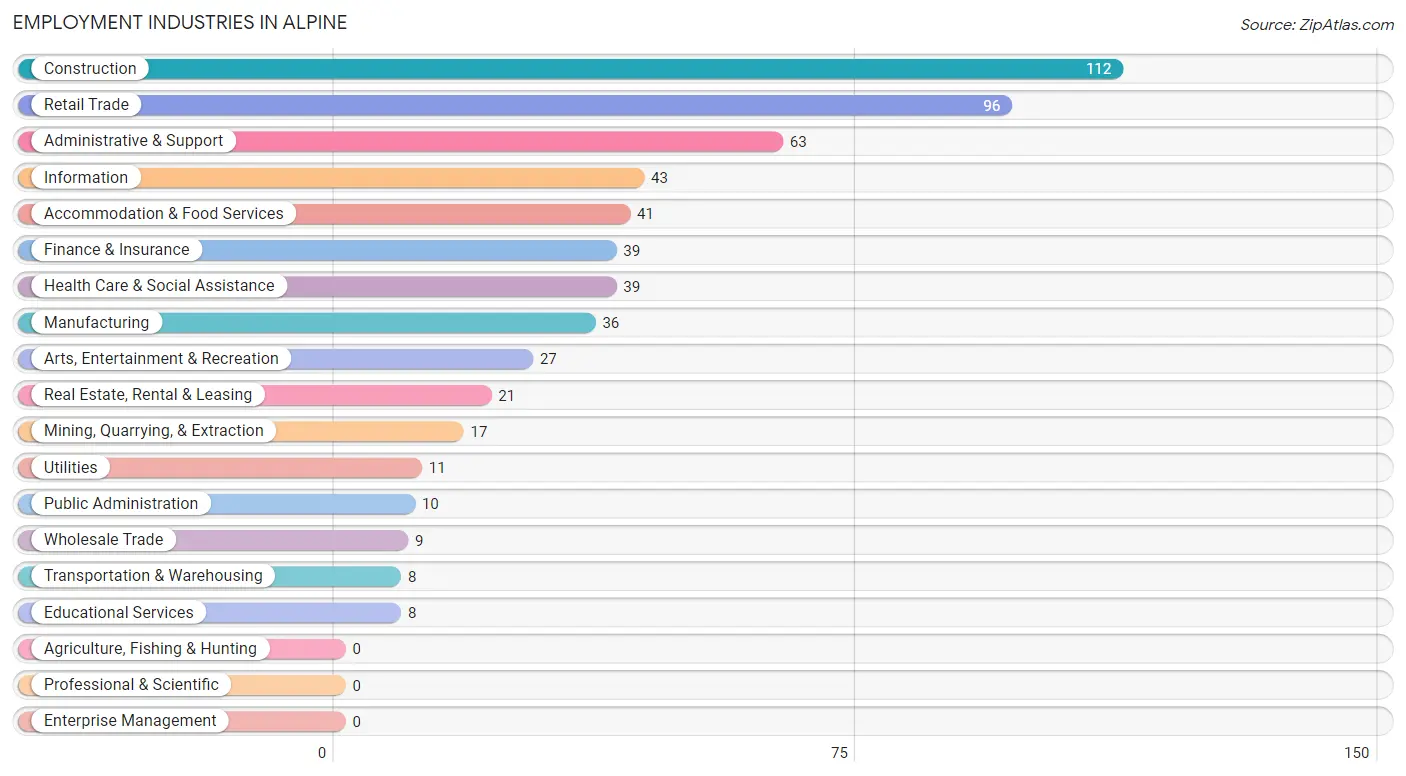
Employment Industries in Alpine
The major employment industries in Alpine include Construction (112 | 19.0%), Retail Trade (96 | 16.2%), Administrative & Support (63 | 10.7%), Information (43 | 7.3%), and Accommodation & Food Services (41 | 6.9%).
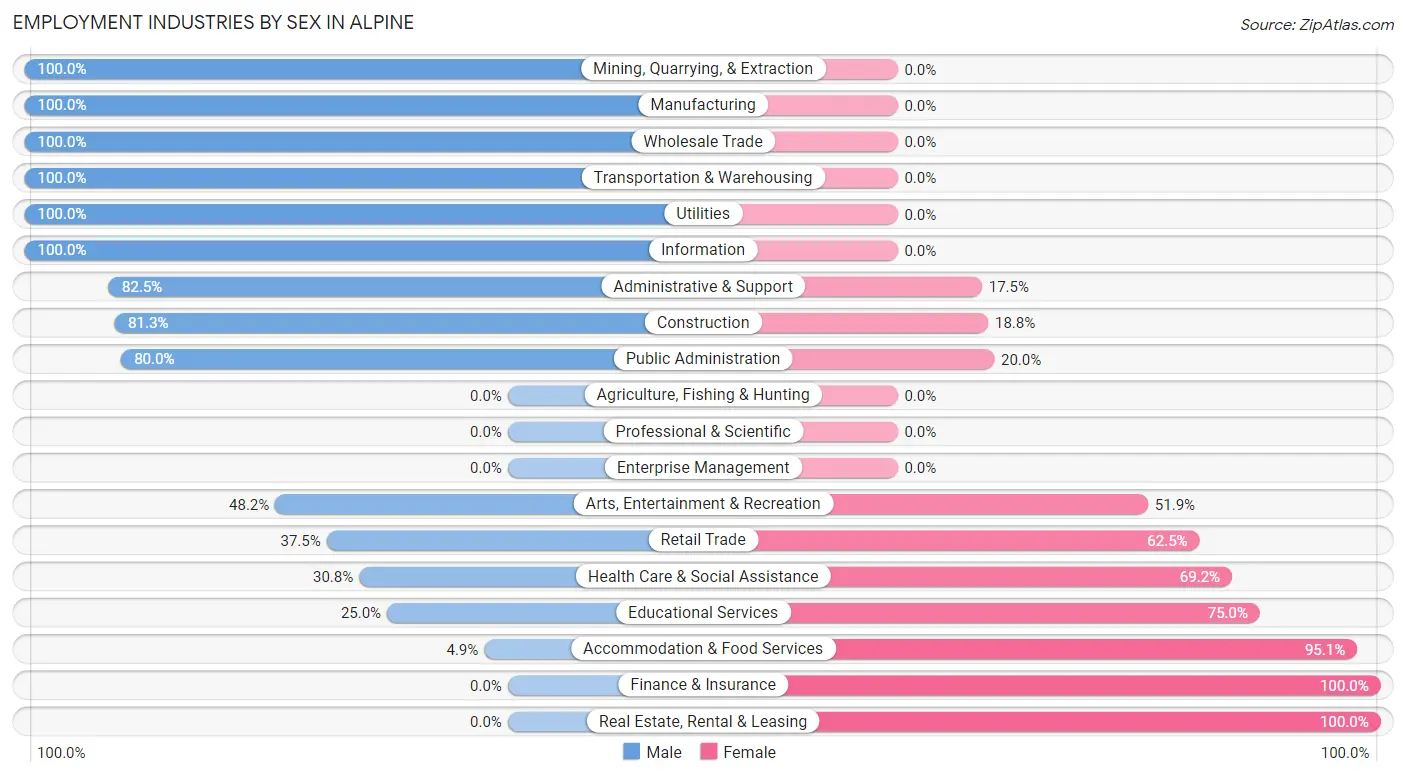
Employment Industries by Sex in Alpine
The Alpine industries that see more men than women are Mining, Quarrying, & Extraction (100.0%), Manufacturing (100.0%), and Wholesale Trade (100.0%), whereas the industries that tend to have a higher number of women are Finance & Insurance (100.0%), Real Estate, Rental & Leasing (100.0%), and Accommodation & Food Services (95.1%).
| Industry | Male | Female |
| Agriculture, Fishing & Hunting | 0 (0.0%) | 0 (0.0%) |
| Mining, Quarrying, & Extraction | 17 (100.0%) | 0 (0.0%) |
| Construction | 91 (81.2%) | 21 (18.8%) |
| Manufacturing | 36 (100.0%) | 0 (0.0%) |
| Wholesale Trade | 9 (100.0%) | 0 (0.0%) |
| Retail Trade | 36 (37.5%) | 60 (62.5%) |
| Transportation & Warehousing | 8 (100.0%) | 0 (0.0%) |
| Utilities | 11 (100.0%) | 0 (0.0%) |
| Information | 43 (100.0%) | 0 (0.0%) |
| Finance & Insurance | 0 (0.0%) | 39 (100.0%) |
| Real Estate, Rental & Leasing | 0 (0.0%) | 21 (100.0%) |
| Professional & Scientific | 0 (0.0%) | 0 (0.0%) |
| Enterprise Management | 0 (0.0%) | 0 (0.0%) |
| Administrative & Support | 52 (82.5%) | 11 (17.5%) |
| Educational Services | 2 (25.0%) | 6 (75.0%) |
| Health Care & Social Assistance | 12 (30.8%) | 27 (69.2%) |
| Arts, Entertainment & Recreation | 13 (48.1%) | 14 (51.8%) |
| Accommodation & Food Services | 2 (4.9%) | 39 (95.1%) |
| Public Administration | 8 (80.0%) | 2 (20.0%) |
| Total | 340 (57.5%) | 251 (42.5%) |
Education in Alpine
School Enrollment in Alpine
The most common levels of schooling among the 108 students in Alpine are high school (31 | 28.7%), middle school (23 | 21.3%), and graduate / professional (16 | 14.8%).
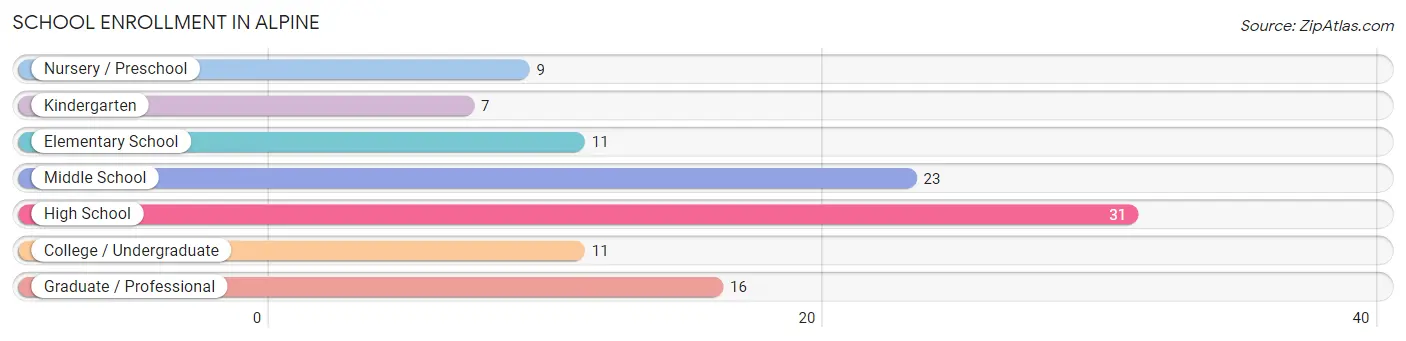
| School Level | # Students | % Students |
| Nursery / Preschool | 9 | 8.3% |
| Kindergarten | 7 | 6.5% |
| Elementary School | 11 | 10.2% |
| Middle School | 23 | 21.3% |
| High School | 31 | 28.7% |
| College / Undergraduate | 11 | 10.2% |
| Graduate / Professional | 16 | 14.8% |
| Total | 108 | 100.0% |
School Enrollment by Age by Funding Source in Alpine
Out of a total of 108 students who are enrolled in schools in Alpine, 20 (18.5%) attend a private institution, while the remaining 88 (81.5%) are enrolled in public schools. The age group of 3 to 4 year olds has the highest likelihood of being enrolled in private schools, with 9 (100.0% in the age bracket) enrolled. Conversely, the age group of 5 to 9 year old has the lowest likelihood of being enrolled in a private school, with 18 (100.0% in the age bracket) attending a public institution.
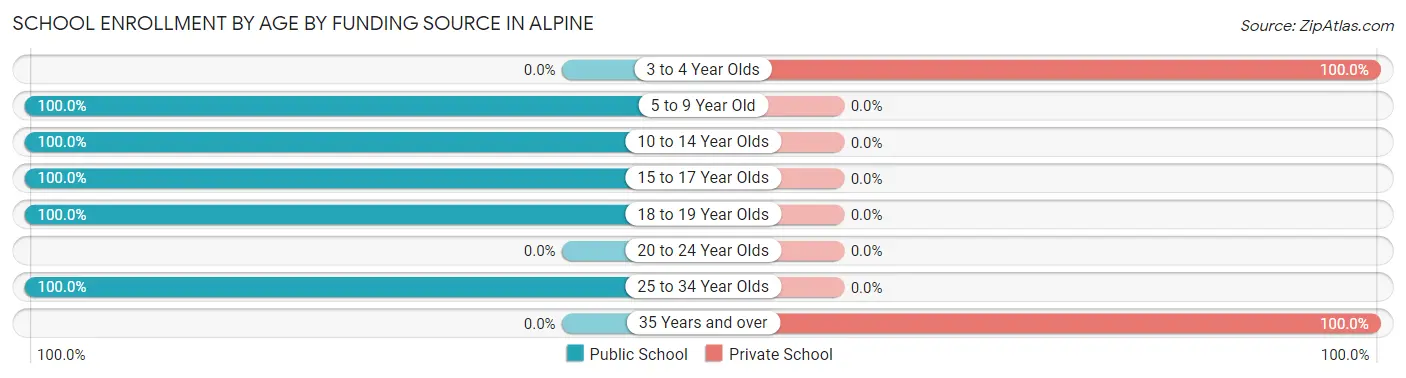
| Age Bracket | Public School | Private School |
| 3 to 4 Year Olds | 0 (0.0%) | 9 (100.0%) |
| 5 to 9 Year Old | 18 (100.0%) | 0 (0.0%) |
| 10 to 14 Year Olds | 23 (100.0%) | 0 (0.0%) |
| 15 to 17 Year Olds | 26 (100.0%) | 0 (0.0%) |
| 18 to 19 Year Olds | 5 (100.0%) | 0 (0.0%) |
| 20 to 24 Year Olds | 0 (0.0%) | 0 (0.0%) |
| 25 to 34 Year Olds | 16 (100.0%) | 0 (0.0%) |
| 35 Years and over | 0 (0.0%) | 11 (100.0%) |
| Total | 88 (81.5%) | 20 (18.5%) |
Educational Attainment by Field of Study in Alpine
Business (40 | 19.9%), arts & humanities (32 | 15.9%), bio, nature & agricultural (23 | 11.4%), education (18 | 9.0%), and liberal arts & history (18 | 9.0%) are the most common fields of study among 201 individuals in Alpine who have obtained a bachelor's degree or higher.
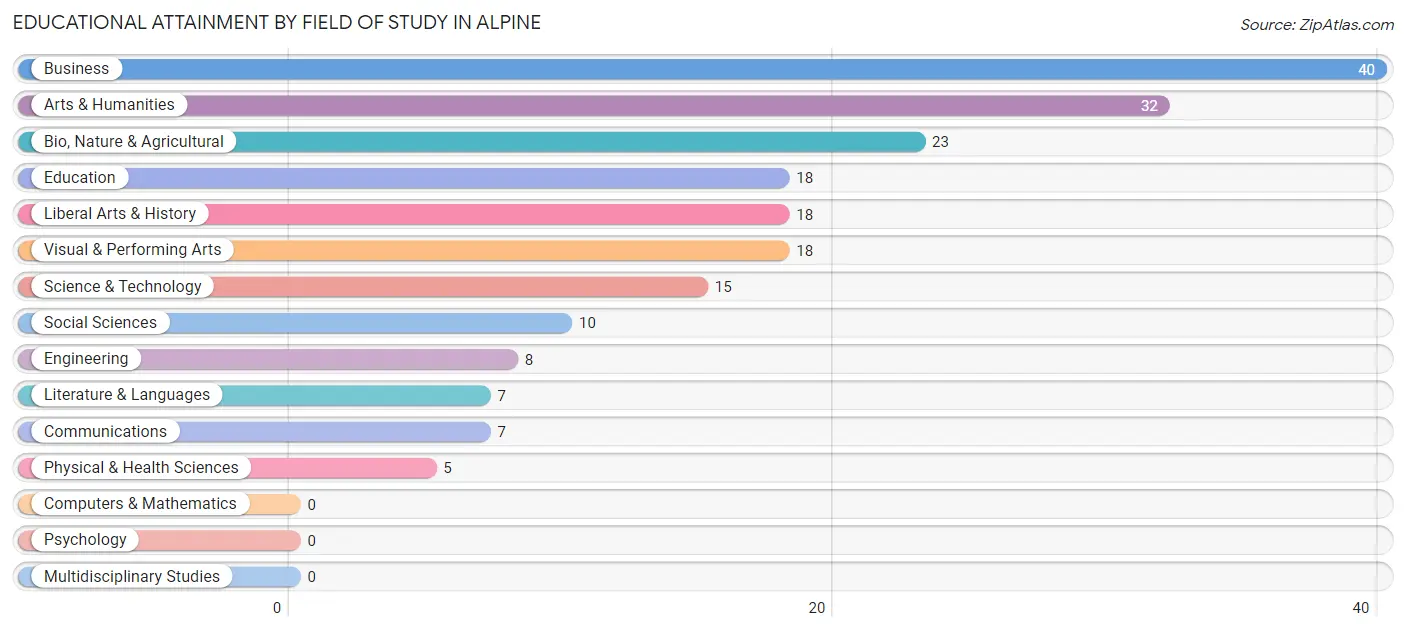
| Field of Study | # Graduates | % Graduates |
| Computers & Mathematics | 0 | 0.0% |
| Bio, Nature & Agricultural | 23 | 11.4% |
| Physical & Health Sciences | 5 | 2.5% |
| Psychology | 0 | 0.0% |
| Social Sciences | 10 | 5.0% |
| Engineering | 8 | 4.0% |
| Multidisciplinary Studies | 0 | 0.0% |
| Science & Technology | 15 | 7.5% |
| Business | 40 | 19.9% |
| Education | 18 | 9.0% |
| Literature & Languages | 7 | 3.5% |
| Liberal Arts & History | 18 | 9.0% |
| Visual & Performing Arts | 18 | 9.0% |
| Communications | 7 | 3.5% |
| Arts & Humanities | 32 | 15.9% |
| Total | 201 | 100.0% |
Transportation & Commute in Alpine
Vehicle Availability by Sex in Alpine
The most prevalent vehicle ownership categories in Alpine are males with 2 vehicles (87, accounting for 26.2%) and females with 2 vehicles (81, making up 36.2%).
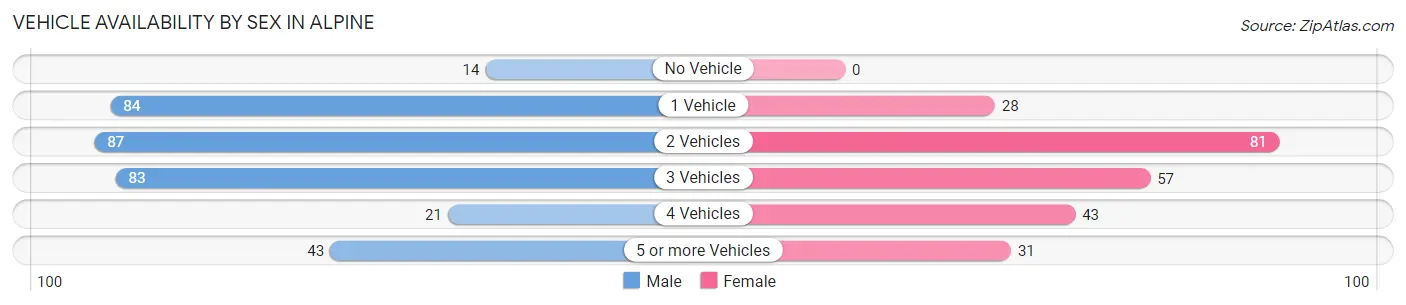
| Vehicles Available | Male | Female |
| No Vehicle | 14 (4.2%) | 0 (0.0%) |
| 1 Vehicle | 84 (25.3%) | 28 (11.7%) |
| 2 Vehicles | 87 (26.2%) | 81 (33.8%) |
| 3 Vehicles | 83 (25.0%) | 57 (23.7%) |
| 4 Vehicles | 21 (6.3%) | 43 (17.9%) |
| 5 or more Vehicles | 43 (13.0%) | 31 (12.9%) |
| Total | 332 (100.0%) | 240 (100.0%) |
Commute Time in Alpine
The most frequently occuring commute durations in Alpine are 45 to 59 minutes (226 commuters, 44.1%), 40 to 44 minutes (81 commuters, 15.8%), and 60 to 89 minutes (80 commuters, 15.6%).
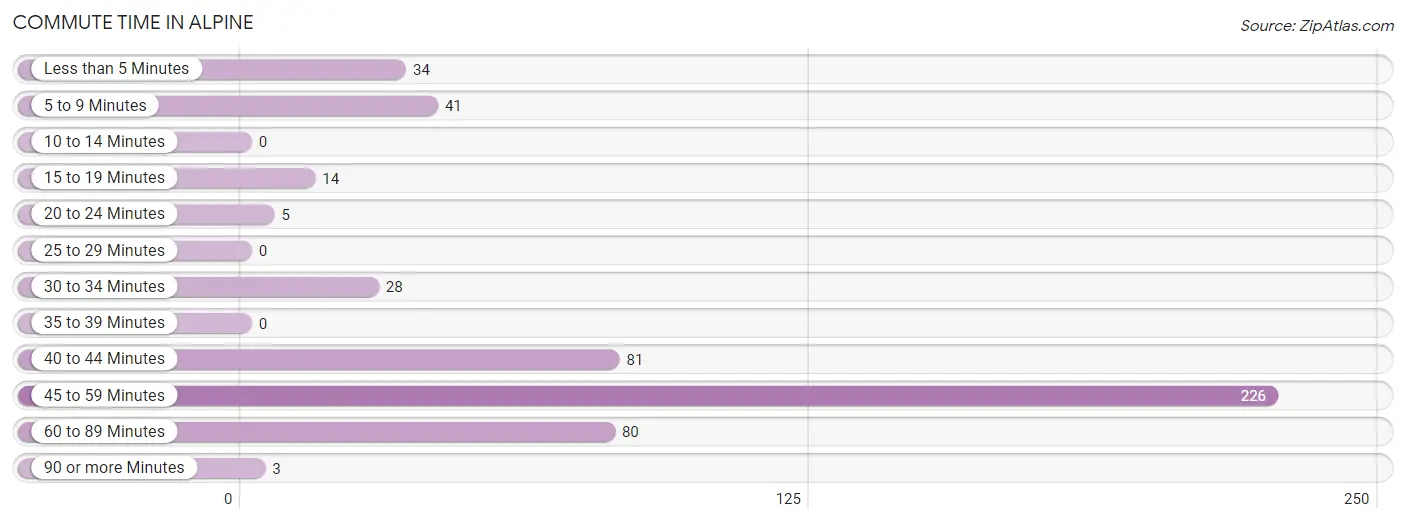
| Commute Time | # Commuters | % Commuters |
| Less than 5 Minutes | 34 | 6.6% |
| 5 to 9 Minutes | 41 | 8.0% |
| 10 to 14 Minutes | 0 | 0.0% |
| 15 to 19 Minutes | 14 | 2.7% |
| 20 to 24 Minutes | 5 | 1.0% |
| 25 to 29 Minutes | 0 | 0.0% |
| 30 to 34 Minutes | 28 | 5.5% |
| 35 to 39 Minutes | 0 | 0.0% |
| 40 to 44 Minutes | 81 | 15.8% |
| 45 to 59 Minutes | 226 | 44.1% |
| 60 to 89 Minutes | 80 | 15.6% |
| 90 or more Minutes | 3 | 0.6% |
Commute Time by Sex in Alpine
The most common commute times in Alpine are 45 to 59 minutes (153 commuters, 47.5%) for males and 45 to 59 minutes (73 commuters, 38.4%) for females.
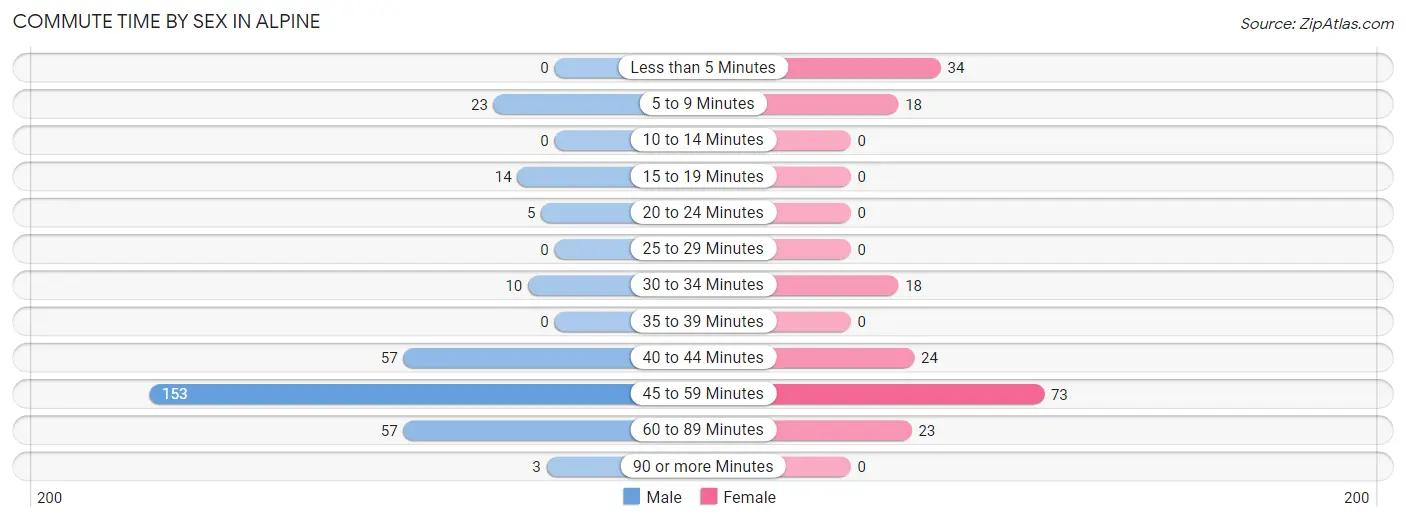
| Commute Time | Male | Female |
| Less than 5 Minutes | 0 (0.0%) | 34 (17.9%) |
| 5 to 9 Minutes | 23 (7.1%) | 18 (9.5%) |
| 10 to 14 Minutes | 0 (0.0%) | 0 (0.0%) |
| 15 to 19 Minutes | 14 (4.3%) | 0 (0.0%) |
| 20 to 24 Minutes | 5 (1.5%) | 0 (0.0%) |
| 25 to 29 Minutes | 0 (0.0%) | 0 (0.0%) |
| 30 to 34 Minutes | 10 (3.1%) | 18 (9.5%) |
| 35 to 39 Minutes | 0 (0.0%) | 0 (0.0%) |
| 40 to 44 Minutes | 57 (17.7%) | 24 (12.6%) |
| 45 to 59 Minutes | 153 (47.5%) | 73 (38.4%) |
| 60 to 89 Minutes | 57 (17.7%) | 23 (12.1%) |
| 90 or more Minutes | 3 (0.9%) | 0 (0.0%) |
Time of Departure to Work by Sex in Alpine
The most frequent times of departure to work in Alpine are 6:00 AM to 6:29 AM (90, 28.0%) for males and 8:30 AM to 8:59 AM (38, 20.0%) for females.
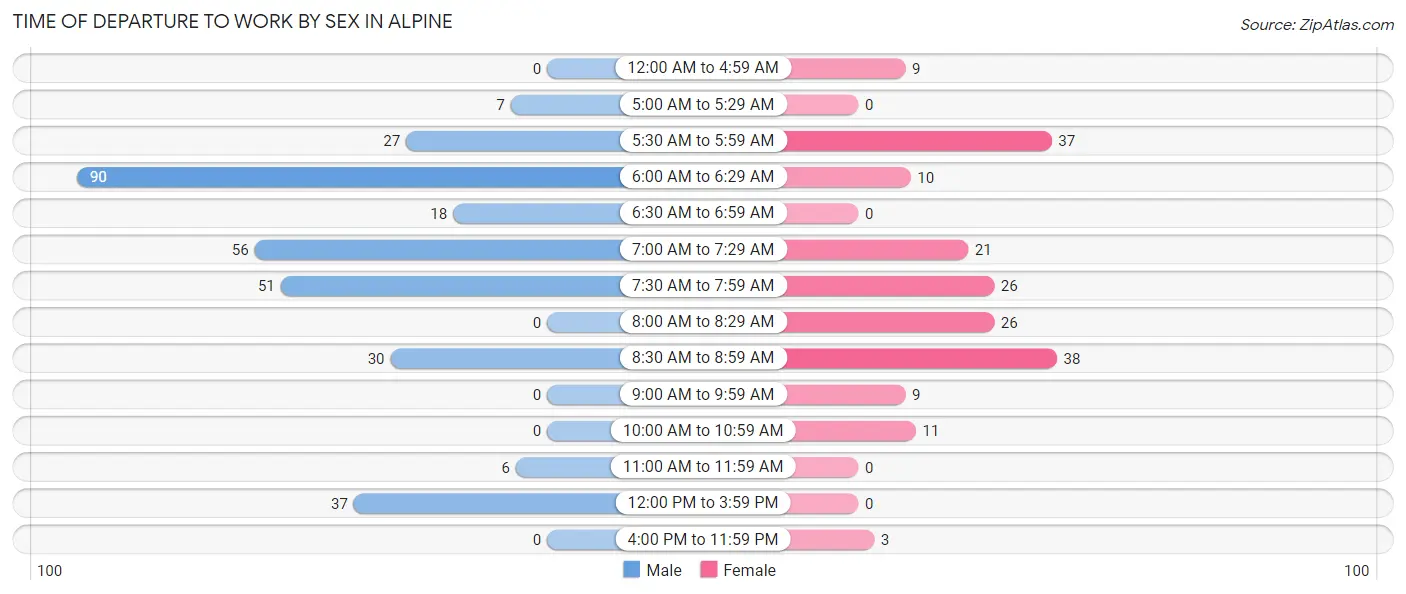
| Time of Departure | Male | Female |
| 12:00 AM to 4:59 AM | 0 (0.0%) | 9 (4.7%) |
| 5:00 AM to 5:29 AM | 7 (2.2%) | 0 (0.0%) |
| 5:30 AM to 5:59 AM | 27 (8.4%) | 37 (19.5%) |
| 6:00 AM to 6:29 AM | 90 (28.0%) | 10 (5.3%) |
| 6:30 AM to 6:59 AM | 18 (5.6%) | 0 (0.0%) |
| 7:00 AM to 7:29 AM | 56 (17.4%) | 21 (11.1%) |
| 7:30 AM to 7:59 AM | 51 (15.8%) | 26 (13.7%) |
| 8:00 AM to 8:29 AM | 0 (0.0%) | 26 (13.7%) |
| 8:30 AM to 8:59 AM | 30 (9.3%) | 38 (20.0%) |
| 9:00 AM to 9:59 AM | 0 (0.0%) | 9 (4.7%) |
| 10:00 AM to 10:59 AM | 0 (0.0%) | 11 (5.8%) |
| 11:00 AM to 11:59 AM | 6 (1.9%) | 0 (0.0%) |
| 12:00 PM to 3:59 PM | 37 (11.5%) | 0 (0.0%) |
| 4:00 PM to 11:59 PM | 0 (0.0%) | 3 (1.6%) |
| Total | 322 (100.0%) | 190 (100.0%) |
Housing Occupancy in Alpine
Occupancy by Ownership in Alpine
Of the total 396 dwellings in Alpine, owner-occupied units account for 194 (49.0%), while renter-occupied units make up 202 (51.0%).
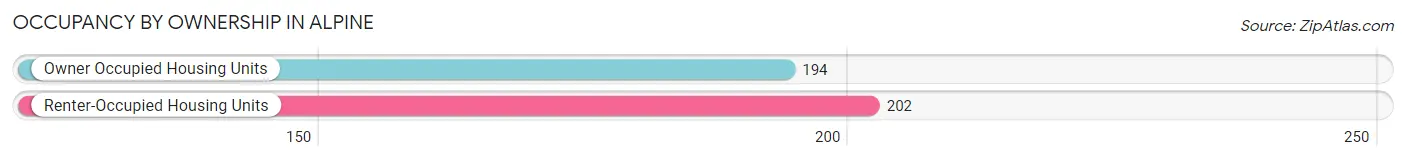
| Occupancy | # Housing Units | % Housing Units |
| Owner Occupied Housing Units | 194 | 49.0% |
| Renter-Occupied Housing Units | 202 | 51.0% |
| Total Occupied Housing Units | 396 | 100.0% |
Occupancy by Household Size in Alpine
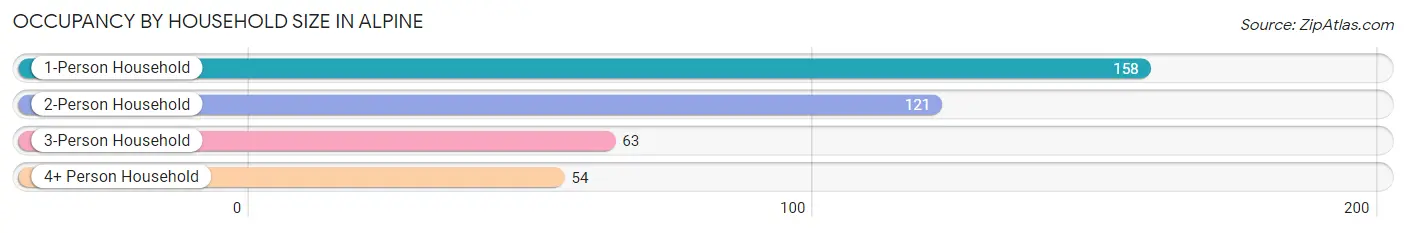
| Household Size | # Housing Units | % Housing Units |
| 1-Person Household | 158 | 39.9% |
| 2-Person Household | 121 | 30.6% |
| 3-Person Household | 63 | 15.9% |
| 4+ Person Household | 54 | 13.6% |
| Total Housing Units | 396 | 100.0% |
Occupancy by Ownership by Household Size in Alpine
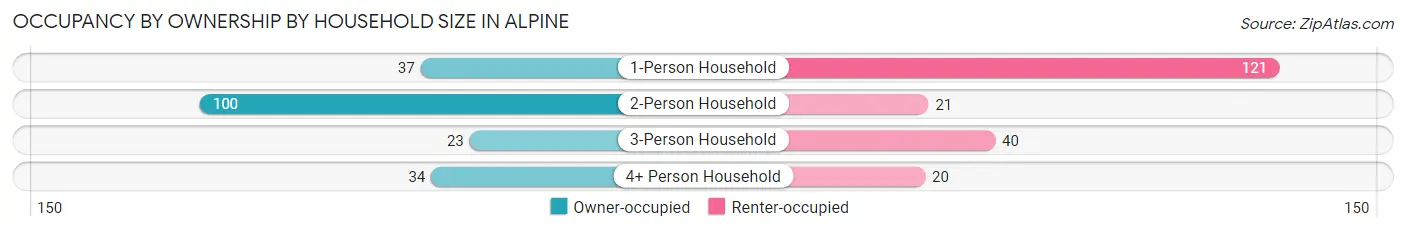
| Household Size | Owner-occupied | Renter-occupied |
| 1-Person Household | 37 (23.4%) | 121 (76.6%) |
| 2-Person Household | 100 (82.6%) | 21 (17.4%) |
| 3-Person Household | 23 (36.5%) | 40 (63.5%) |
| 4+ Person Household | 34 (63.0%) | 20 (37.0%) |
| Total Housing Units | 194 (49.0%) | 202 (51.0%) |
Occupancy by Educational Attainment in Alpine
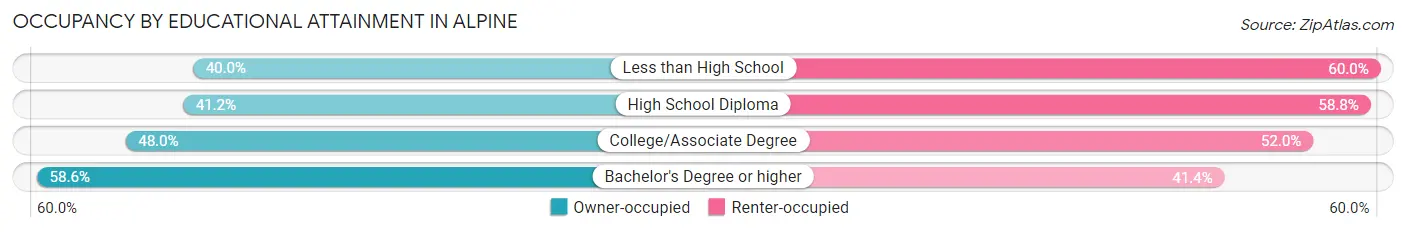
| Household Size | Owner-occupied | Renter-occupied |
| Less than High School | 16 (40.0%) | 24 (60.0%) |
| High School Diploma | 28 (41.2%) | 40 (58.8%) |
| College/Associate Degree | 85 (48.0%) | 92 (52.0%) |
| Bachelor's Degree or higher | 65 (58.6%) | 46 (41.4%) |
Occupancy by Age of Householder in Alpine
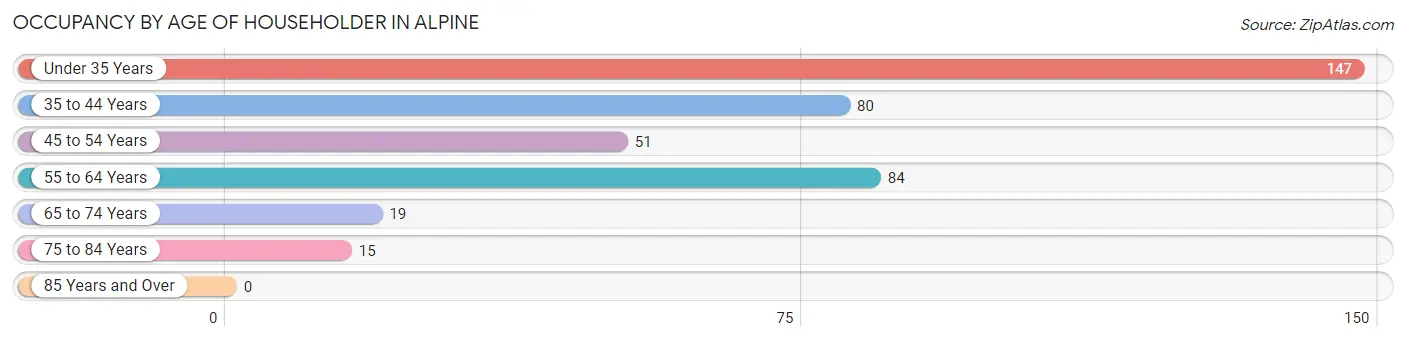
| Age Bracket | # Households | % Households |
| Under 35 Years | 147 | 37.1% |
| 35 to 44 Years | 80 | 20.2% |
| 45 to 54 Years | 51 | 12.9% |
| 55 to 64 Years | 84 | 21.2% |
| 65 to 74 Years | 19 | 4.8% |
| 75 to 84 Years | 15 | 3.8% |
| 85 Years and Over | 0 | 0.0% |
| Total | 396 | 100.0% |
Housing Finances in Alpine
Median Income by Occupancy in Alpine
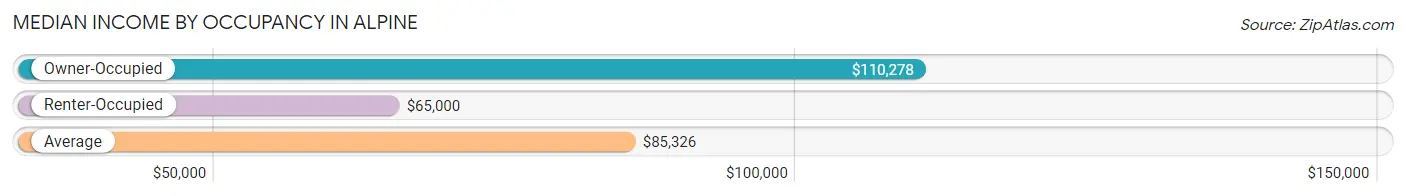
| Occupancy Type | # Households | Median Income |
| Owner-Occupied | 194 (49.0%) | $110,278 |
| Renter-Occupied | 202 (51.0%) | $65,000 |
| Average | 396 (100.0%) | $85,326 |
Occupancy by Householder Income Bracket in Alpine
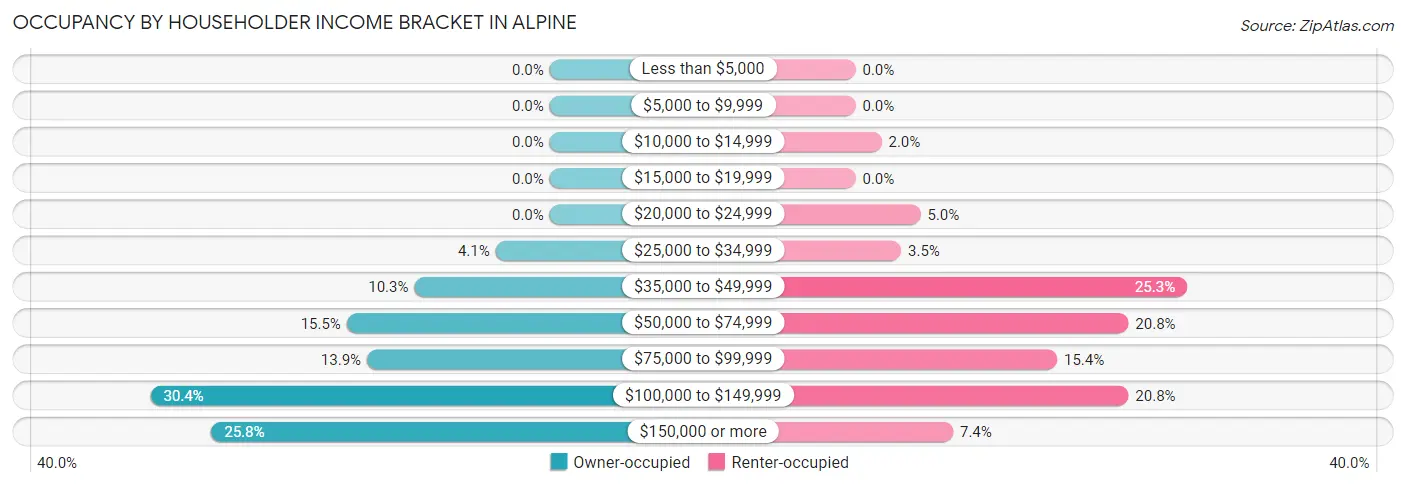
| Income Bracket | Owner-occupied | Renter-occupied |
| Less than $5,000 | 0 (0.0%) | 0 (0.0%) |
| $5,000 to $9,999 | 0 (0.0%) | 0 (0.0%) |
| $10,000 to $14,999 | 0 (0.0%) | 4 (2.0%) |
| $15,000 to $19,999 | 0 (0.0%) | 0 (0.0%) |
| $20,000 to $24,999 | 0 (0.0%) | 10 (5.0%) |
| $25,000 to $34,999 | 8 (4.1%) | 7 (3.5%) |
| $35,000 to $49,999 | 20 (10.3%) | 51 (25.3%) |
| $50,000 to $74,999 | 30 (15.5%) | 42 (20.8%) |
| $75,000 to $99,999 | 27 (13.9%) | 31 (15.3%) |
| $100,000 to $149,999 | 59 (30.4%) | 42 (20.8%) |
| $150,000 or more | 50 (25.8%) | 15 (7.4%) |
| Total | 194 (100.0%) | 202 (100.0%) |
Monthly Housing Cost Tiers in Alpine
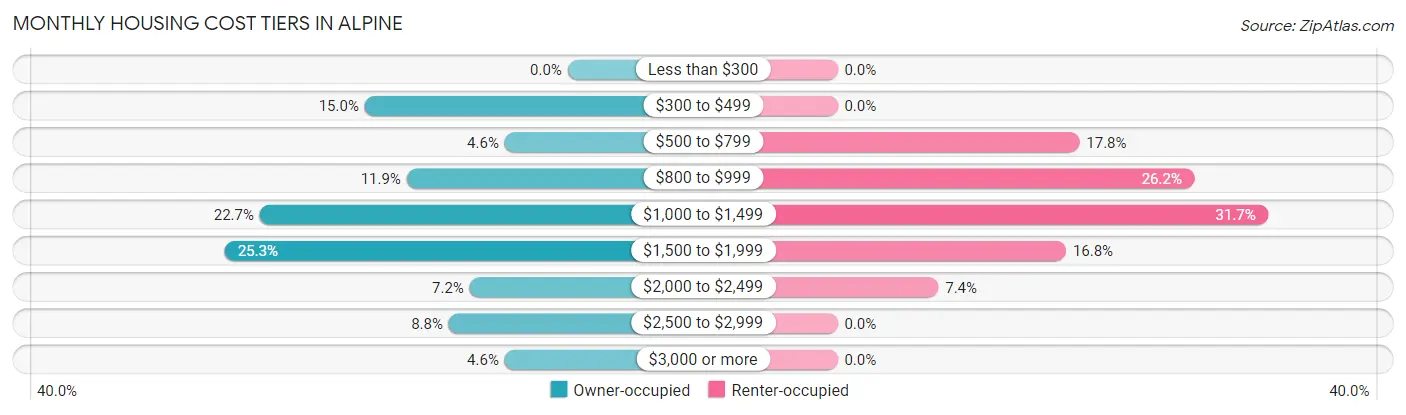
| Monthly Cost | Owner-occupied | Renter-occupied |
| Less than $300 | 0 (0.0%) | 0 (0.0%) |
| $300 to $499 | 29 (14.9%) | 0 (0.0%) |
| $500 to $799 | 9 (4.6%) | 36 (17.8%) |
| $800 to $999 | 23 (11.9%) | 53 (26.2%) |
| $1,000 to $1,499 | 44 (22.7%) | 64 (31.7%) |
| $1,500 to $1,999 | 49 (25.3%) | 34 (16.8%) |
| $2,000 to $2,499 | 14 (7.2%) | 15 (7.4%) |
| $2,500 to $2,999 | 17 (8.8%) | 0 (0.0%) |
| $3,000 or more | 9 (4.6%) | 0 (0.0%) |
| Total | 194 (100.0%) | 202 (100.0%) |
Physical Housing Characteristics in Alpine
Housing Structures in Alpine
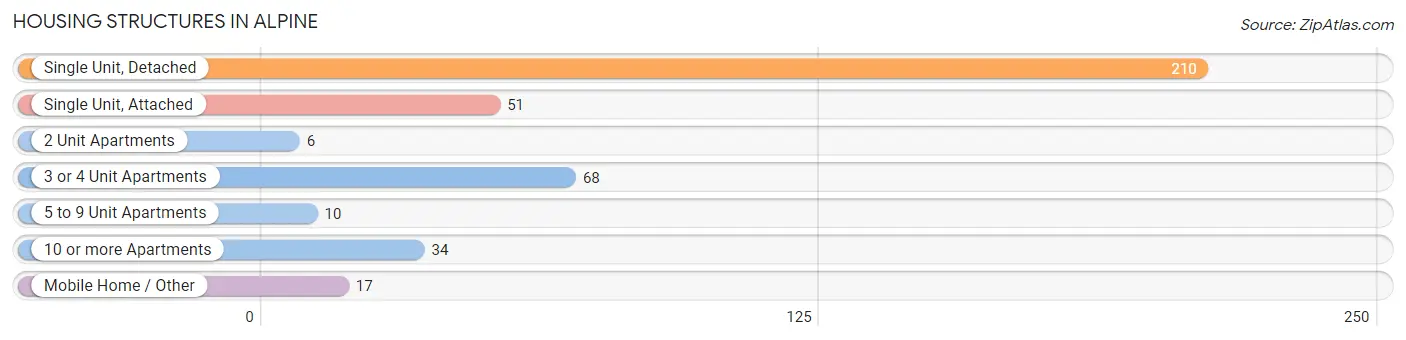
| Structure Type | # Housing Units | % Housing Units |
| Single Unit, Detached | 210 | 53.0% |
| Single Unit, Attached | 51 | 12.9% |
| 2 Unit Apartments | 6 | 1.5% |
| 3 or 4 Unit Apartments | 68 | 17.2% |
| 5 to 9 Unit Apartments | 10 | 2.5% |
| 10 or more Apartments | 34 | 8.6% |
| Mobile Home / Other | 17 | 4.3% |
| Total | 396 | 100.0% |
Housing Structures by Occupancy in Alpine
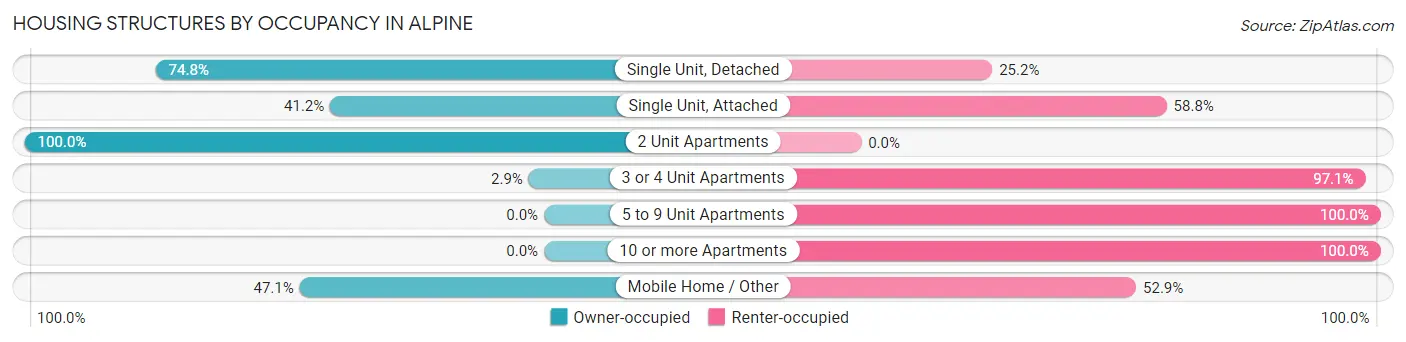
| Structure Type | Owner-occupied | Renter-occupied |
| Single Unit, Detached | 157 (74.8%) | 53 (25.2%) |
| Single Unit, Attached | 21 (41.2%) | 30 (58.8%) |
| 2 Unit Apartments | 6 (100.0%) | 0 (0.0%) |
| 3 or 4 Unit Apartments | 2 (2.9%) | 66 (97.1%) |
| 5 to 9 Unit Apartments | 0 (0.0%) | 10 (100.0%) |
| 10 or more Apartments | 0 (0.0%) | 34 (100.0%) |
| Mobile Home / Other | 8 (47.1%) | 9 (52.9%) |
| Total | 194 (49.0%) | 202 (51.0%) |
Housing Structures by Number of Rooms in Alpine
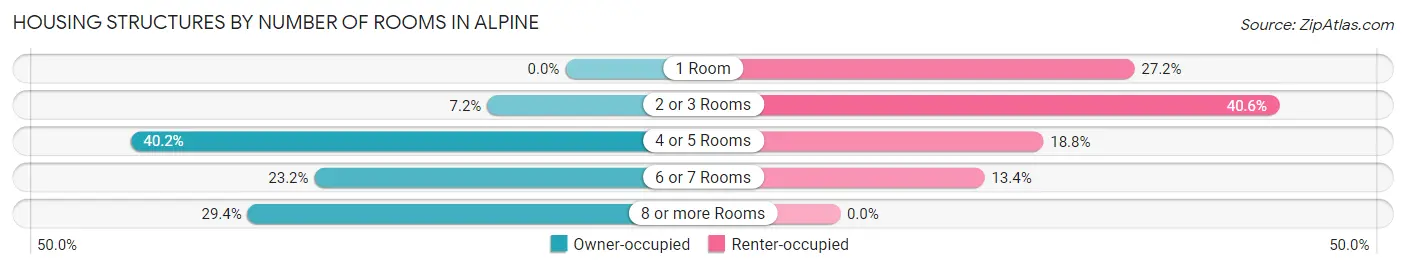
| Number of Rooms | Owner-occupied | Renter-occupied |
| 1 Room | 0 (0.0%) | 55 (27.2%) |
| 2 or 3 Rooms | 14 (7.2%) | 82 (40.6%) |
| 4 or 5 Rooms | 78 (40.2%) | 38 (18.8%) |
| 6 or 7 Rooms | 45 (23.2%) | 27 (13.4%) |
| 8 or more Rooms | 57 (29.4%) | 0 (0.0%) |
| Total | 194 (100.0%) | 202 (100.0%) |
Housing Structure by Heating Type in Alpine
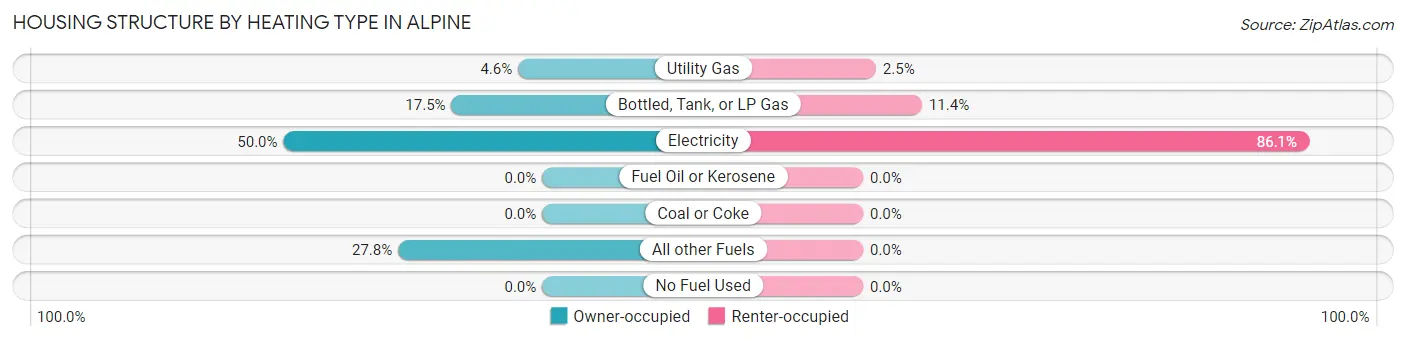
| Heating Type | Owner-occupied | Renter-occupied |
| Utility Gas | 9 (4.6%) | 5 (2.5%) |
| Bottled, Tank, or LP Gas | 34 (17.5%) | 23 (11.4%) |
| Electricity | 97 (50.0%) | 174 (86.1%) |
| Fuel Oil or Kerosene | 0 (0.0%) | 0 (0.0%) |
| Coal or Coke | 0 (0.0%) | 0 (0.0%) |
| All other Fuels | 54 (27.8%) | 0 (0.0%) |
| No Fuel Used | 0 (0.0%) | 0 (0.0%) |
| Total | 194 (100.0%) | 202 (100.0%) |
Household Vehicle Usage in Alpine
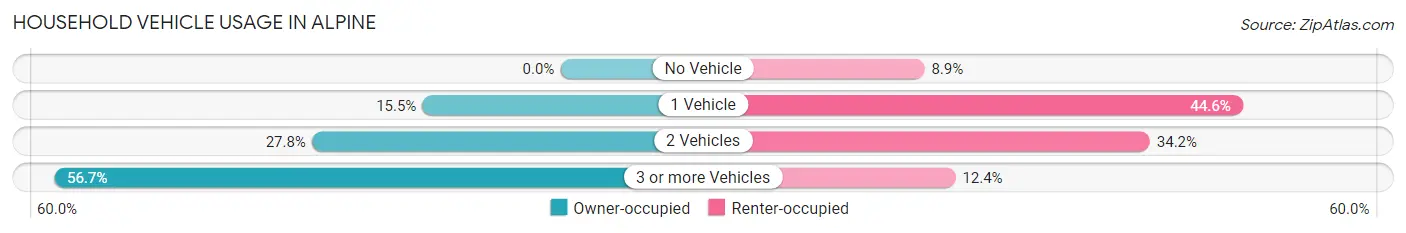
| Vehicles per Household | Owner-occupied | Renter-occupied |
| No Vehicle | 0 (0.0%) | 18 (8.9%) |
| 1 Vehicle | 30 (15.5%) | 90 (44.6%) |
| 2 Vehicles | 54 (27.8%) | 69 (34.2%) |
| 3 or more Vehicles | 110 (56.7%) | 25 (12.4%) |
| Total | 194 (100.0%) | 202 (100.0%) |
Real Estate & Mortgages in Alpine
Real Estate and Mortgage Overview in Alpine
| Characteristic | Without Mortgage | With Mortgage |
| Housing Units | 45 | 149 |
| Median Property Value | $402,400 | $463,000 |
| Median Household Income | $82,750 | $48 |
| Monthly Housing Costs | $470 | $9 |
| Real Estate Taxes | $1,594 | $0 |
Property Value by Mortgage Status in Alpine
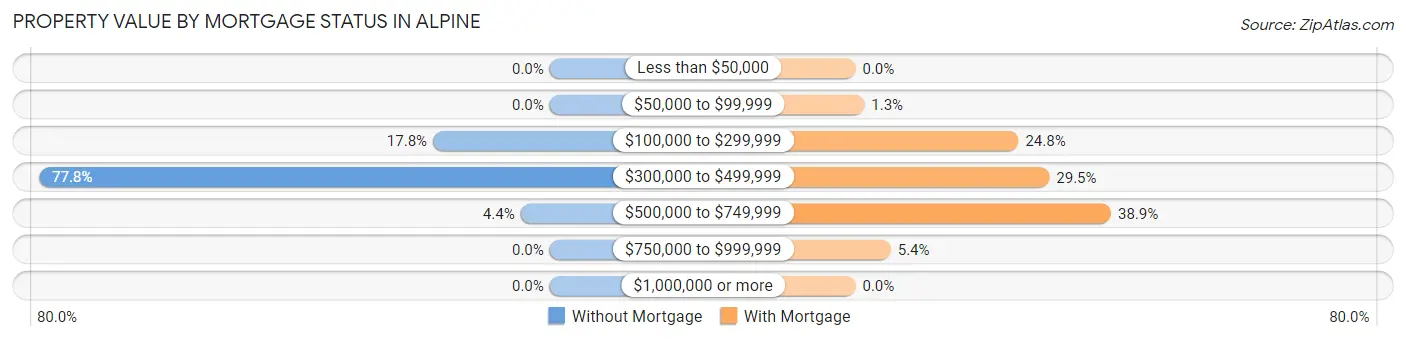
| Property Value | Without Mortgage | With Mortgage |
| Less than $50,000 | 0 (0.0%) | 0 (0.0%) |
| $50,000 to $99,999 | 0 (0.0%) | 2 (1.3%) |
| $100,000 to $299,999 | 8 (17.8%) | 37 (24.8%) |
| $300,000 to $499,999 | 35 (77.8%) | 44 (29.5%) |
| $500,000 to $749,999 | 2 (4.4%) | 58 (38.9%) |
| $750,000 to $999,999 | 0 (0.0%) | 8 (5.4%) |
| $1,000,000 or more | 0 (0.0%) | 0 (0.0%) |
| Total | 45 (100.0%) | 149 (100.0%) |
Household Income by Mortgage Status in Alpine
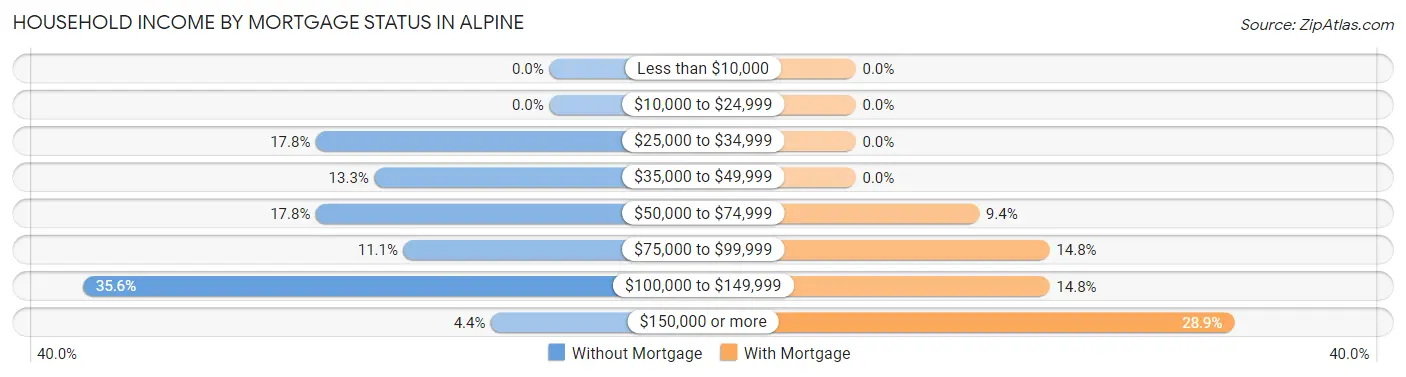
| Household Income | Without Mortgage | With Mortgage |
| Less than $10,000 | 0 (0.0%) | 0 (0.0%) |
| $10,000 to $24,999 | 0 (0.0%) | 0 (0.0%) |
| $25,000 to $34,999 | 8 (17.8%) | 0 (0.0%) |
| $35,000 to $49,999 | 6 (13.3%) | 0 (0.0%) |
| $50,000 to $74,999 | 8 (17.8%) | 14 (9.4%) |
| $75,000 to $99,999 | 5 (11.1%) | 22 (14.8%) |
| $100,000 to $149,999 | 16 (35.6%) | 22 (14.8%) |
| $150,000 or more | 2 (4.4%) | 43 (28.9%) |
| Total | 45 (100.0%) | 149 (100.0%) |
Property Value to Household Income Ratio in Alpine
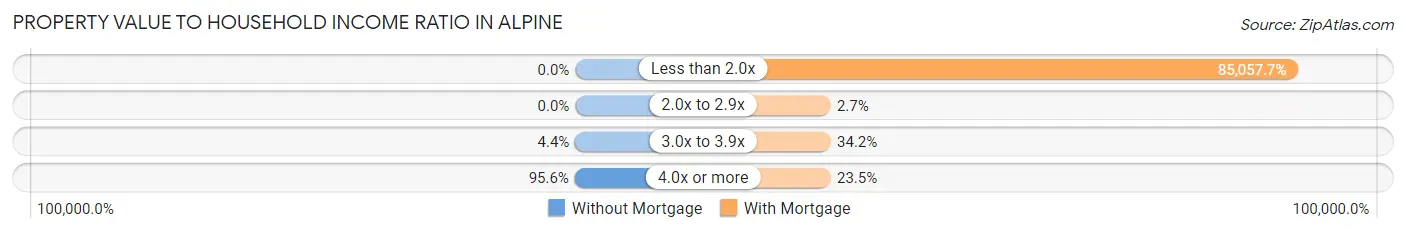
| Value-to-Income Ratio | Without Mortgage | With Mortgage |
| Less than 2.0x | 0 (0.0%) | 126,736 (85,057.7%) |
| 2.0x to 2.9x | 0 (0.0%) | 4 (2.7%) |
| 3.0x to 3.9x | 2 (4.4%) | 51 (34.2%) |
| 4.0x or more | 43 (95.6%) | 35 (23.5%) |
| Total | 45 (100.0%) | 149 (100.0%) |
Real Estate Taxes by Mortgage Status in Alpine
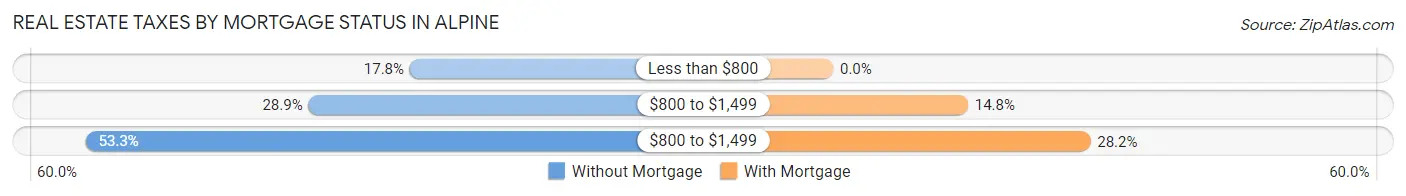
| Property Taxes | Without Mortgage | With Mortgage |
| Less than $800 | 8 (17.8%) | 0 (0.0%) |
| $800 to $1,499 | 13 (28.9%) | 22 (14.8%) |
| $800 to $1,499 | 24 (53.3%) | 42 (28.2%) |
| Total | 45 (100.0%) | 149 (100.0%) |
Health & Disability in Alpine
Health Insurance Coverage by Age in Alpine
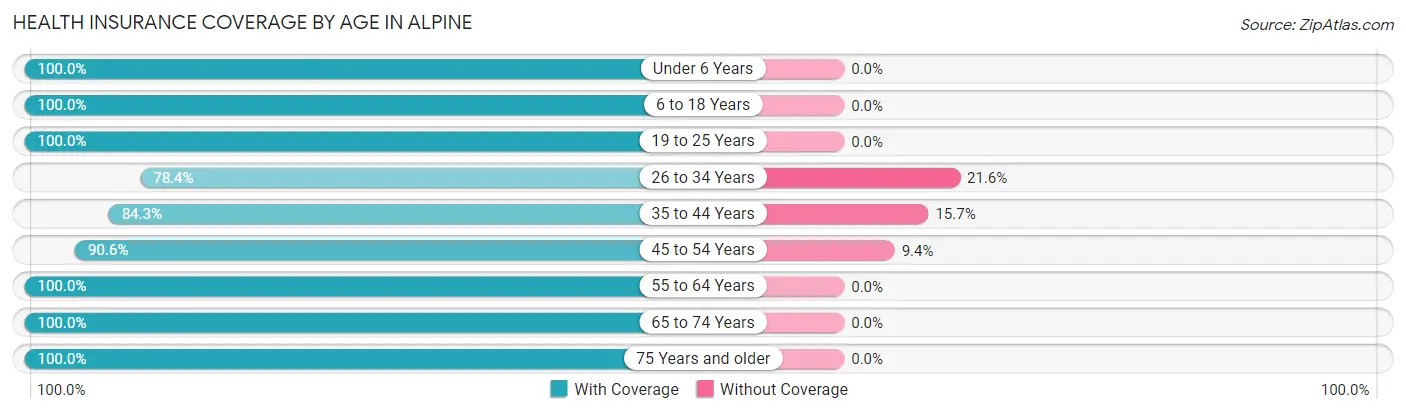
| Age Bracket | With Coverage | Without Coverage |
| Under 6 Years | 133 (100.0%) | 0 (0.0%) |
| 6 to 18 Years | 65 (100.0%) | 0 (0.0%) |
| 19 to 25 Years | 72 (100.0%) | 0 (0.0%) |
| 26 to 34 Years | 149 (78.4%) | 41 (21.6%) |
| 35 to 44 Years | 102 (84.3%) | 19 (15.7%) |
| 45 to 54 Years | 106 (90.6%) | 11 (9.4%) |
| 55 to 64 Years | 122 (100.0%) | 0 (0.0%) |
| 65 to 74 Years | 42 (100.0%) | 0 (0.0%) |
| 75 Years and older | 29 (100.0%) | 0 (0.0%) |
| Total | 820 (92.0%) | 71 (8.0%) |
Health Insurance Coverage by Citizenship Status in Alpine
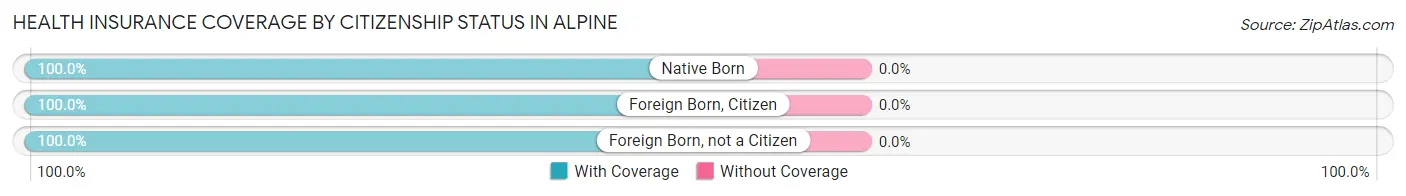
| Citizenship Status | With Coverage | Without Coverage |
| Native Born | 133 (100.0%) | 0 (0.0%) |
| Foreign Born, Citizen | 65 (100.0%) | 0 (0.0%) |
| Foreign Born, not a Citizen | 72 (100.0%) | 0 (0.0%) |
Health Insurance Coverage by Household Income in Alpine
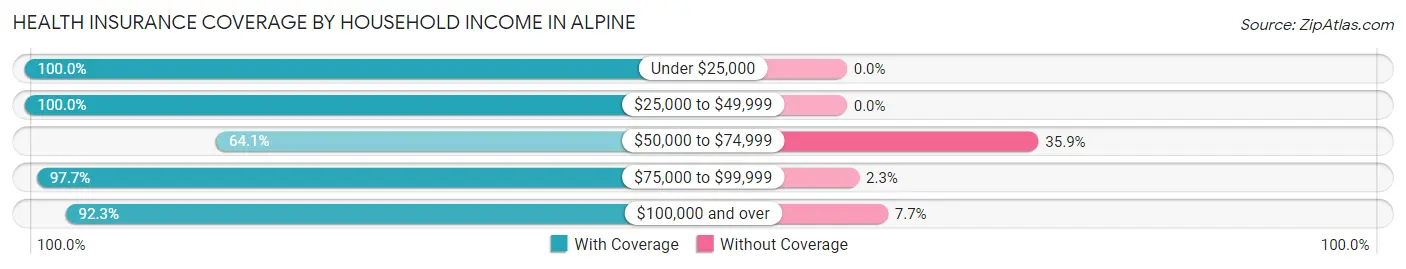
| Household Income | With Coverage | Without Coverage |
| Under $25,000 | 19 (100.0%) | 0 (0.0%) |
| $25,000 to $49,999 | 114 (100.0%) | 0 (0.0%) |
| $50,000 to $74,999 | 50 (64.1%) | 28 (35.9%) |
| $75,000 to $99,999 | 169 (97.7%) | 4 (2.3%) |
| $100,000 and over | 468 (92.3%) | 39 (7.7%) |
Public vs Private Health Insurance Coverage by Age in Alpine
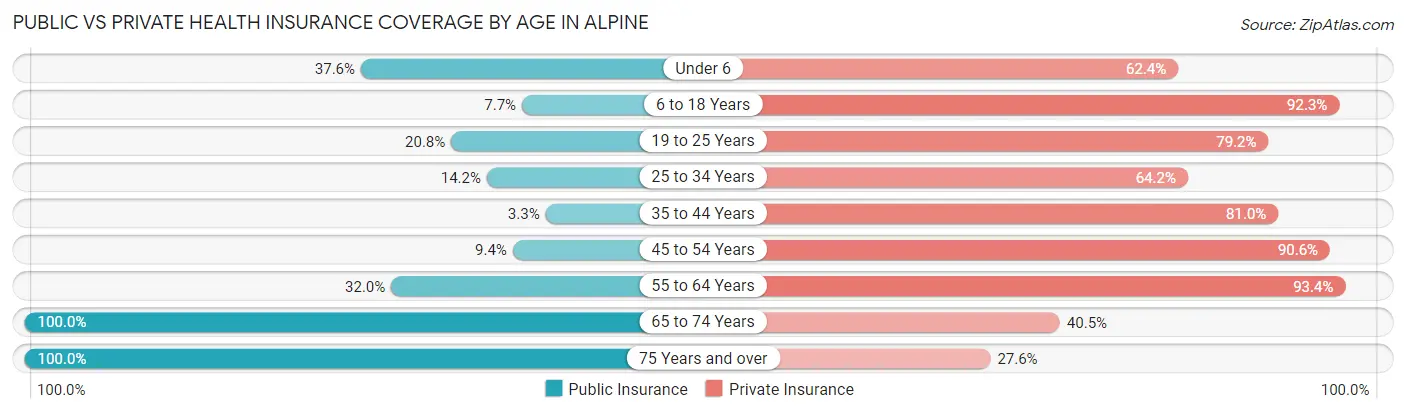
| Age Bracket | Public Insurance | Private Insurance |
| Under 6 | 50 (37.6%) | 83 (62.4%) |
| 6 to 18 Years | 5 (7.7%) | 60 (92.3%) |
| 19 to 25 Years | 15 (20.8%) | 57 (79.2%) |
| 25 to 34 Years | 27 (14.2%) | 122 (64.2%) |
| 35 to 44 Years | 4 (3.3%) | 98 (81.0%) |
| 45 to 54 Years | 11 (9.4%) | 106 (90.6%) |
| 55 to 64 Years | 39 (32.0%) | 114 (93.4%) |
| 65 to 74 Years | 42 (100.0%) | 17 (40.5%) |
| 75 Years and over | 29 (100.0%) | 8 (27.6%) |
| Total | 222 (24.9%) | 665 (74.6%) |
Disability Status by Sex by Age in Alpine
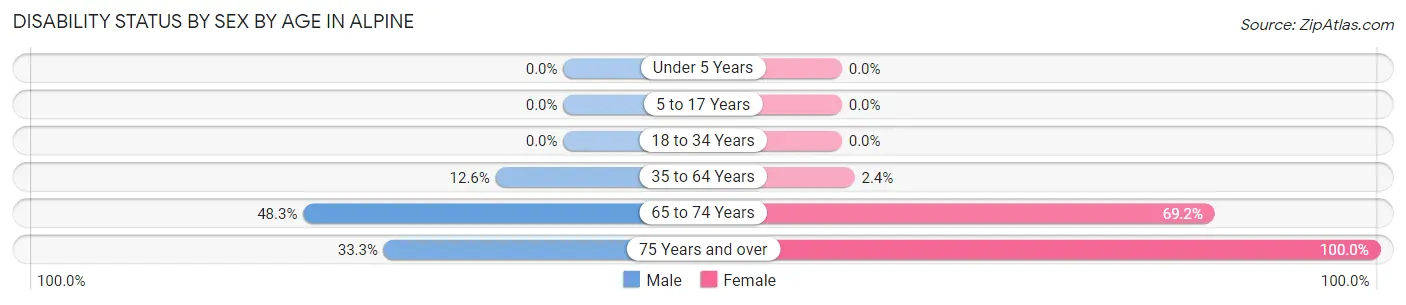
| Age Bracket | Male | Female |
| Under 5 Years | 0 (0.0%) | 0 (0.0%) |
| 5 to 17 Years | 0 (0.0%) | 0 (0.0%) |
| 18 to 34 Years | 0 (0.0%) | 0 (0.0%) |
| 35 to 64 Years | 24 (12.6%) | 4 (2.4%) |
| 65 to 74 Years | 14 (48.3%) | 9 (69.2%) |
| 75 Years and over | 5 (33.3%) | 14 (100.0%) |
Disability Class by Sex by Age in Alpine
Disability Class: Hearing Difficulty
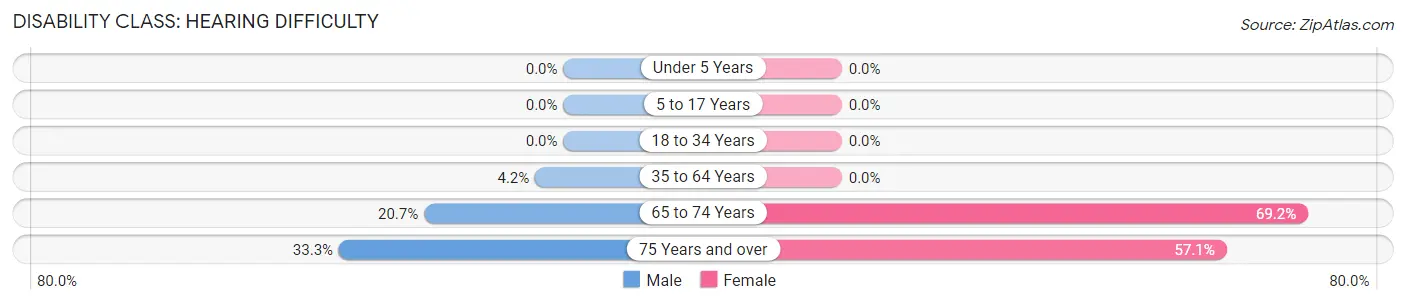
| Age Bracket | Male | Female |
| Under 5 Years | 0 (0.0%) | 0 (0.0%) |
| 5 to 17 Years | 0 (0.0%) | 0 (0.0%) |
| 18 to 34 Years | 0 (0.0%) | 0 (0.0%) |
| 35 to 64 Years | 8 (4.2%) | 0 (0.0%) |
| 65 to 74 Years | 6 (20.7%) | 9 (69.2%) |
| 75 Years and over | 5 (33.3%) | 8 (57.1%) |
Disability Class: Vision Difficulty
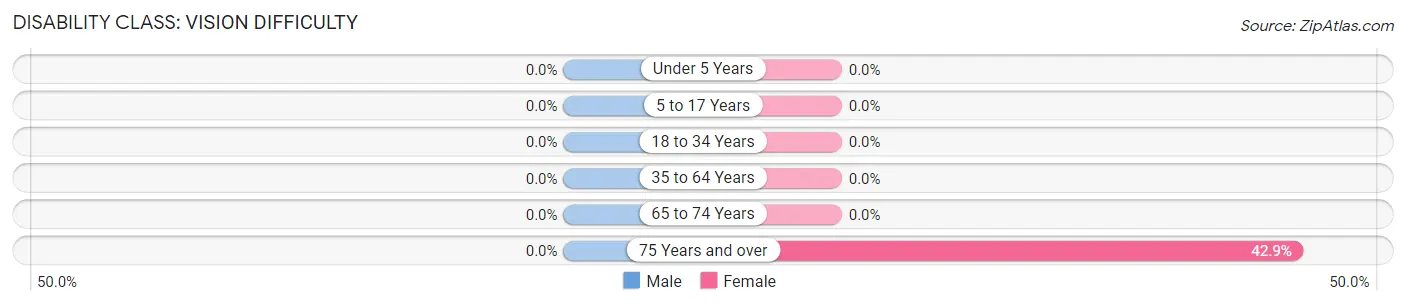
| Age Bracket | Male | Female |
| Under 5 Years | 0 (0.0%) | 0 (0.0%) |
| 5 to 17 Years | 0 (0.0%) | 0 (0.0%) |
| 18 to 34 Years | 0 (0.0%) | 0 (0.0%) |
| 35 to 64 Years | 0 (0.0%) | 0 (0.0%) |
| 65 to 74 Years | 0 (0.0%) | 0 (0.0%) |
| 75 Years and over | 0 (0.0%) | 6 (42.9%) |
Disability Class: Cognitive Difficulty
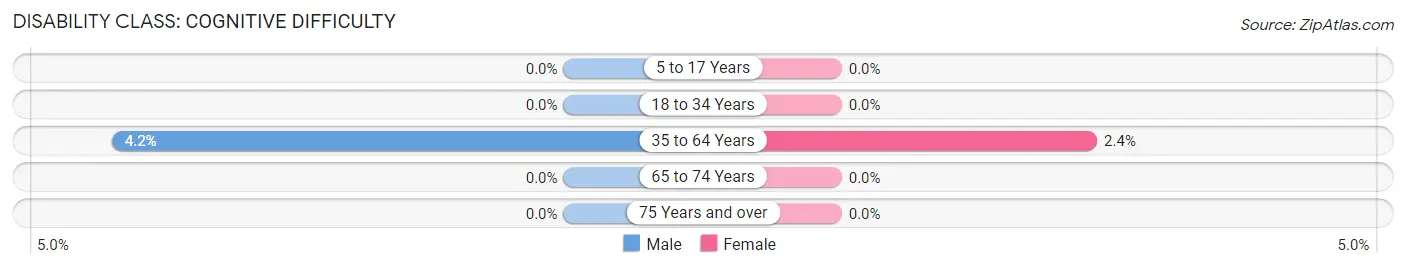
| Age Bracket | Male | Female |
| 5 to 17 Years | 0 (0.0%) | 0 (0.0%) |
| 18 to 34 Years | 0 (0.0%) | 0 (0.0%) |
| 35 to 64 Years | 8 (4.2%) | 4 (2.4%) |
| 65 to 74 Years | 0 (0.0%) | 0 (0.0%) |
| 75 Years and over | 0 (0.0%) | 0 (0.0%) |
Disability Class: Ambulatory Difficulty
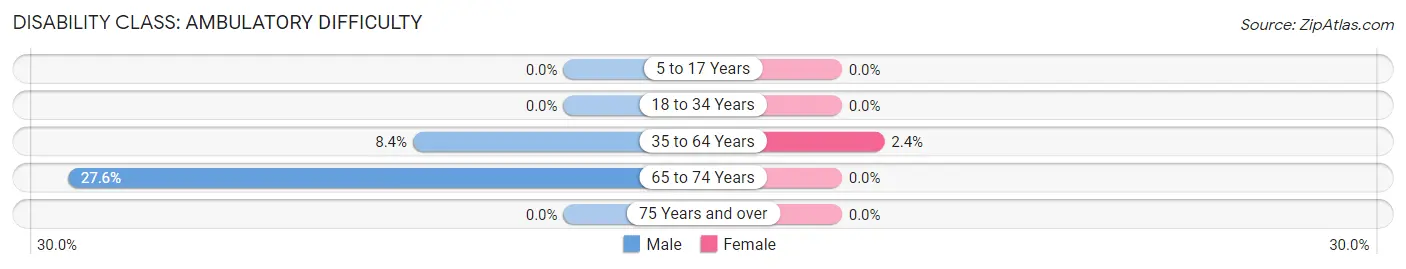
| Age Bracket | Male | Female |
| 5 to 17 Years | 0 (0.0%) | 0 (0.0%) |
| 18 to 34 Years | 0 (0.0%) | 0 (0.0%) |
| 35 to 64 Years | 16 (8.4%) | 4 (2.4%) |
| 65 to 74 Years | 8 (27.6%) | 0 (0.0%) |
| 75 Years and over | 0 (0.0%) | 0 (0.0%) |
Disability Class: Self-Care Difficulty
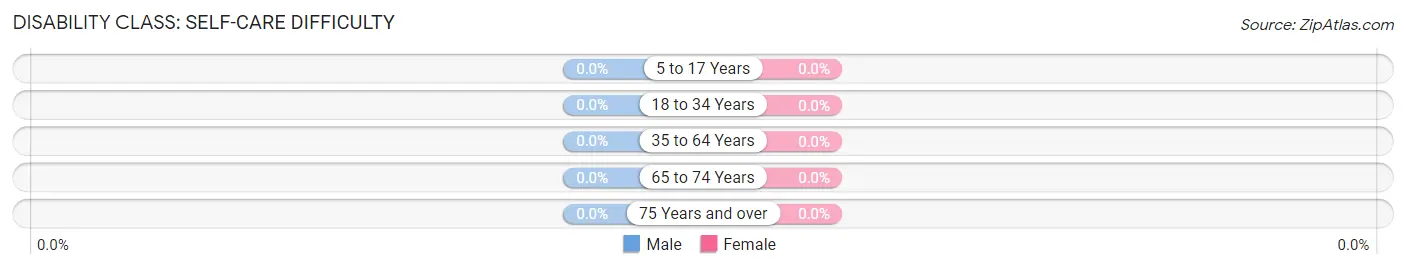
| Age Bracket | Male | Female |
| 5 to 17 Years | 0 (0.0%) | 0 (0.0%) |
| 18 to 34 Years | 0 (0.0%) | 0 (0.0%) |
| 35 to 64 Years | 0 (0.0%) | 0 (0.0%) |
| 65 to 74 Years | 0 (0.0%) | 0 (0.0%) |
| 75 Years and over | 0 (0.0%) | 0 (0.0%) |
Technology Access in Alpine
Computing Device Access in Alpine
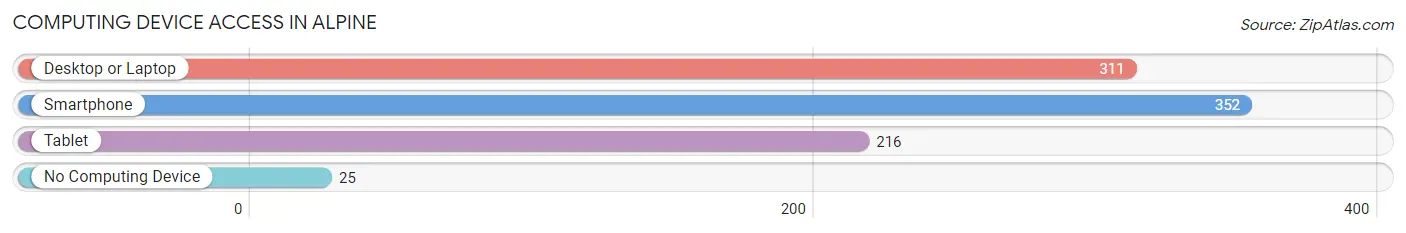
| Device Type | # Households | % Households |
| Desktop or Laptop | 311 | 78.5% |
| Smartphone | 352 | 88.9% |
| Tablet | 216 | 54.5% |
| No Computing Device | 25 | 6.3% |
| Total | 396 | 100.0% |
Internet Access in Alpine
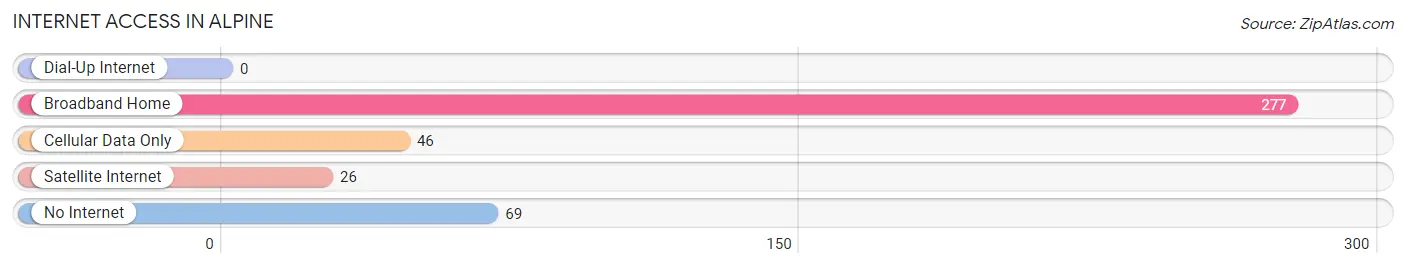
| Internet Type | # Households | % Households |
| Dial-Up Internet | 0 | 0.0% |
| Broadband Home | 277 | 70.0% |
| Cellular Data Only | 46 | 11.6% |
| Satellite Internet | 26 | 6.6% |
| No Internet | 69 | 17.4% |
| Total | 396 | 100.0% |
Alpine Summary
Alpine, Wyoming is a small town located in the southwestern corner of the state, near the Utah border. It is situated in the foothills of the Uinta Mountains, and is surrounded by the Bridger-Teton National Forest. The town has a population of approximately 1,000 people, and is the county seat of Lincoln County.
History
Alpine was first settled in the late 1800s by Mormon pioneers, who were drawn to the area by its abundant natural resources. The town was originally known as “Little Denmark”, due to the large number of Danish immigrants who settled in the area. In 1891, the town was officially incorporated as Alpine, and the name was changed to reflect the mountainous terrain of the area.
In the early 1900s, Alpine was a thriving agricultural community, with many of the residents working in the local dairy and sheep industries. The town also had a thriving lumber industry, and was home to several sawmills.
In the 1950s, Alpine began to experience a decline in population as many of the residents moved away in search of better economic opportunities. However, the town has experienced a resurgence in recent years, as many people have moved to the area to take advantage of the outdoor recreation opportunities.
Geography
Alpine is located in the southwestern corner of Wyoming, near the Utah border. It is situated in the foothills of the Uinta Mountains, and is surrounded by the Bridger-Teton National Forest. The town is located at an elevation of 6,400 feet, and has a total area of 1.2 square miles.
The climate in Alpine is semi-arid, with hot summers and cold winters. The average annual temperature is 44 degrees Fahrenheit, and the average annual precipitation is 12 inches.
Economy
Alpine’s economy is largely based on tourism and outdoor recreation. The town is home to several ski resorts, and is a popular destination for snowmobiling, fishing, and hunting. The town also has a thriving arts and crafts scene, and is home to several galleries and studios.
In addition to tourism, Alpine is also home to several small businesses, including restaurants, retail stores, and service providers. The town is also home to a small manufacturing sector, which produces a variety of products, including furniture and clothing.
Demographics
As of the 2010 census, Alpine had a population of 1,000 people. The racial makeup of the town was 95.2% White, 0.7% Native American, 0.3% Asian, 0.2% African American, and 3.6% from other races. The median household income was $41,250, and the median family income was $50,000.
The town is home to a large number of retirees, and the median age of the population is 44. The town also has a large number of young families, and the median age of the population is 32.
Conclusion
Alpine, Wyoming is a small town located in the southwestern corner of the state, near the Utah border. It is situated in the foothills of the Uinta Mountains, and is surrounded by the Bridger-Teton National Forest. The town has a population of approximately 1,000 people, and is the county seat of Lincoln County. The town’s economy is largely based on tourism and outdoor recreation, and it is home to several ski resorts, galleries, and small businesses. The town has a diverse population, with a median age of 44 and a median household income of $41,250.
Common Questions
What is Per Capita Income in Alpine?
Per Capita income in Alpine is $43,942.
What is the Median Family Income in Alpine?
Median Family Income in Alpine is $111,953.
What is the Median Household income in Alpine?
Median Household Income in Alpine is $85,326.
What is Income or Wage Gap in Alpine?
Income or Wage Gap in Alpine is 8.5%.
Women in Alpine earn 91.5 cents for every dollar earned by a man.
What is Inequality or Gini Index in Alpine?
Inequality or Gini Index in Alpine is 0.33.
What is the Total Population of Alpine?
Total Population of Alpine is 891.
What is the Total Male Population of Alpine?
Total Male Population of Alpine is 526.
What is the Total Female Population of Alpine?
Total Female Population of Alpine is 365.
What is the Ratio of Males per 100 Females in Alpine?
There are 144.11 Males per 100 Females in Alpine.
What is the Ratio of Females per 100 Males in Alpine?
There are 69.39 Females per 100 Males in Alpine.
What is the Median Population Age in Alpine?
Median Population Age in Alpine is 33.7 Years.
What is the Average Family Size in Alpine
Average Family Size in Alpine is 2.9 People.
What is the Average Household Size in Alpine
Average Household Size in Alpine is 2.2 People.
How Large is the Labor Force in Alpine?
There are 591 People in the Labor Forcein in Alpine.
What is the Percentage of People in the Labor Force in Alpine?
83.5% of People are in the Labor Force in Alpine.