Ranchester, WY Map & Demographics
Ranchester Map
Ranchester Overview
$28,502
PER CAPITA INCOME
$76,094
AVG FAMILY INCOME
$63,083
AVG HOUSEHOLD INCOME
37.3%
WAGE / INCOME GAP [ % ]
62.7¢/ $1
WAGE / INCOME GAP [ $ ]
$11,538
FAMILY INCOME DEFICIT
0.35
INEQUALITY / GINI INDEX
967
TOTAL POPULATION
537
MALE POPULATION
430
FEMALE POPULATION
124.88
MALES / 100 FEMALES
80.07
FEMALES / 100 MALES
34.2
MEDIAN AGE
3.5
AVG FAMILY SIZE
3.0
AVG HOUSEHOLD SIZE
512
LABOR FORCE [ PEOPLE ]
75.7%
PERCENT IN LABOR FORCE
1.6%
UNEMPLOYMENT RATE
Ranchester Zip Codes
Ranchester Area Codes
Income in Ranchester
Income Overview in Ranchester
Per Capita Income in Ranchester is $28,502, while median incomes of families and households are $76,094 and $63,083 respectively.
| Characteristic | Number | Measure |
| Per Capita Income | 967 | $28,502 |
| Median Family Income | 241 | $76,094 |
| Mean Family Income | 241 | $86,557 |
| Median Household Income | 327 | $63,083 |
| Mean Household Income | 327 | $78,914 |
| Income Deficit | 241 | $11,538 |
| Wage / Income Gap (%) | 967 | 37.35% |
| Wage / Income Gap ($) | 967 | 62.65¢ per $1 |
| Gini / Inequality Index | 967 | 0.35 |
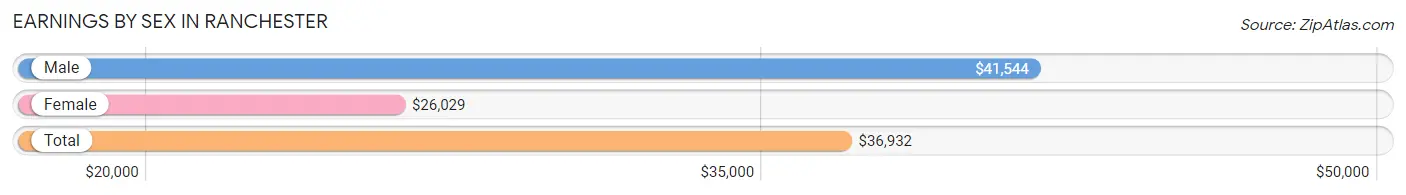
Earnings by Sex in Ranchester
Average Earnings in Ranchester are $36,932, $41,544 for men and $26,029 for women, a difference of 37.3%.
| Sex | Number | Average Earnings |
| Male | 311 (59.0%) | $41,544 |
| Female | 216 (41.0%) | $26,029 |
| Total | 527 (100.0%) | $36,932 |
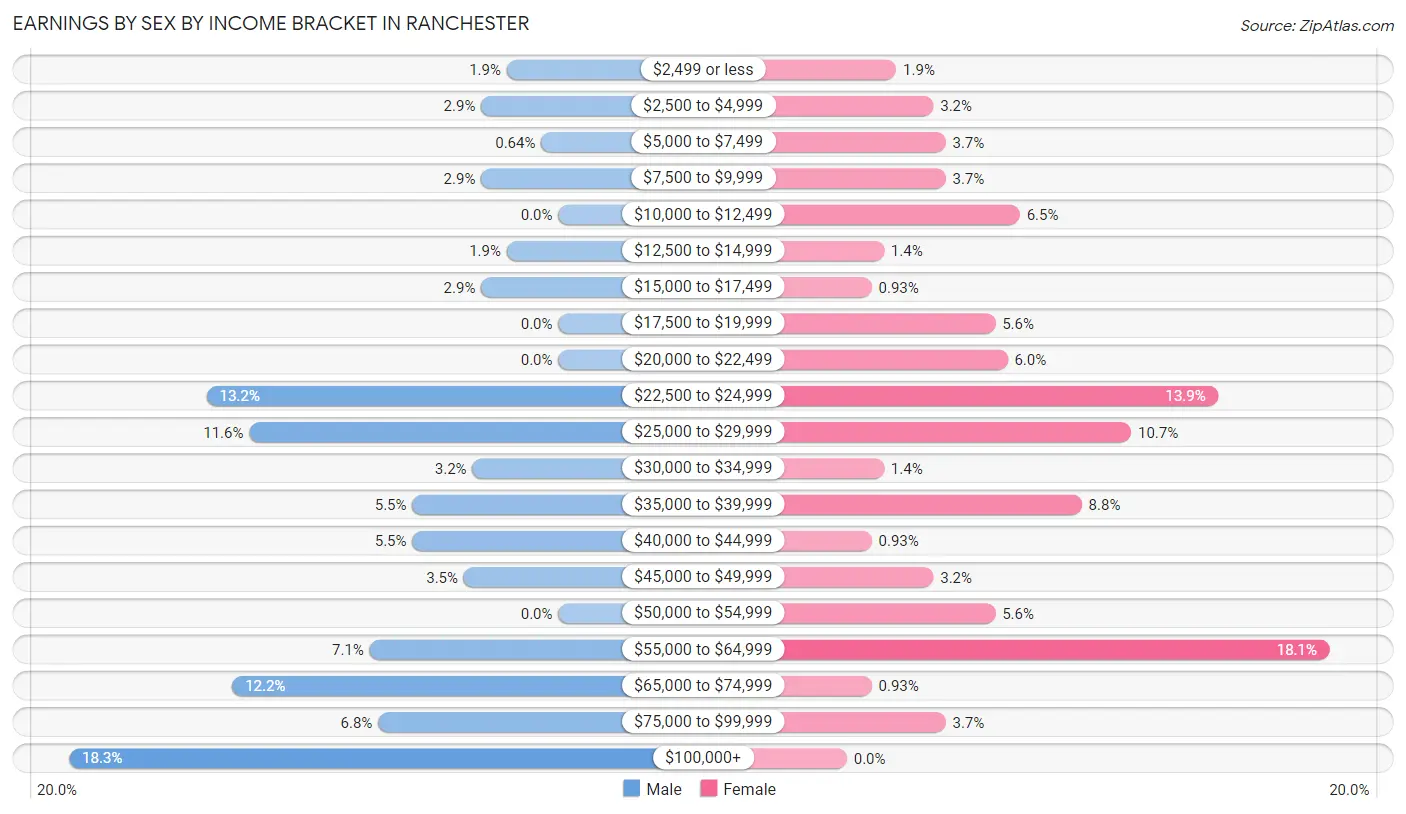
Earnings by Sex by Income Bracket in Ranchester
The most common earnings brackets in Ranchester are $100,000+ for men (57 | 18.3%) and $55,000 to $64,999 for women (39 | 18.1%).
| Income | Male | Female |
| $2,499 or less | 6 (1.9%) | 4 (1.8%) |
| $2,500 to $4,999 | 9 (2.9%) | 7 (3.2%) |
| $5,000 to $7,499 | 2 (0.6%) | 8 (3.7%) |
| $7,500 to $9,999 | 9 (2.9%) | 8 (3.7%) |
| $10,000 to $12,499 | 0 (0.0%) | 14 (6.5%) |
| $12,500 to $14,999 | 6 (1.9%) | 3 (1.4%) |
| $15,000 to $17,499 | 9 (2.9%) | 2 (0.9%) |
| $17,500 to $19,999 | 0 (0.0%) | 12 (5.6%) |
| $20,000 to $22,499 | 0 (0.0%) | 13 (6.0%) |
| $22,500 to $24,999 | 41 (13.2%) | 30 (13.9%) |
| $25,000 to $29,999 | 36 (11.6%) | 23 (10.6%) |
| $30,000 to $34,999 | 10 (3.2%) | 3 (1.4%) |
| $35,000 to $39,999 | 17 (5.5%) | 19 (8.8%) |
| $40,000 to $44,999 | 17 (5.5%) | 2 (0.9%) |
| $45,000 to $49,999 | 11 (3.5%) | 7 (3.2%) |
| $50,000 to $54,999 | 0 (0.0%) | 12 (5.6%) |
| $55,000 to $64,999 | 22 (7.1%) | 39 (18.1%) |
| $65,000 to $74,999 | 38 (12.2%) | 2 (0.9%) |
| $75,000 to $99,999 | 21 (6.8%) | 8 (3.7%) |
| $100,000+ | 57 (18.3%) | 0 (0.0%) |
| Total | 311 (100.0%) | 216 (100.0%) |
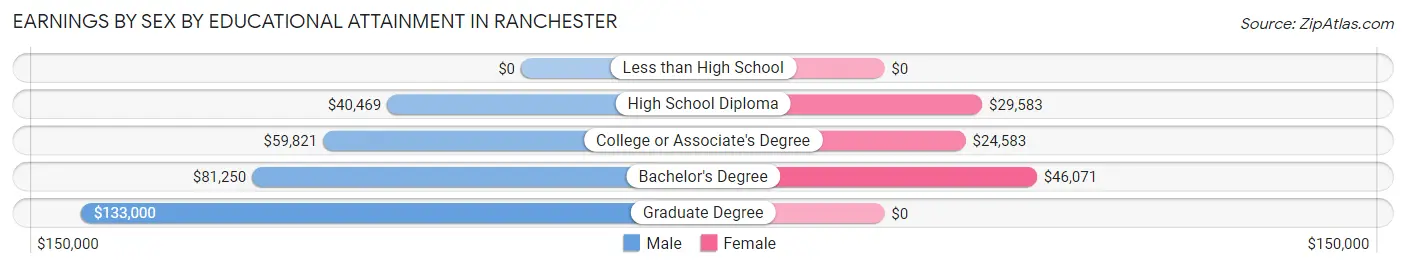
Earnings by Sex by Educational Attainment in Ranchester
Average earnings in Ranchester are $59,250 for men and $26,985 for women, a difference of 54.5%. Men with an educational attainment of graduate degree enjoy the highest average annual earnings of $133,000, while those with high school diploma education earn the least with $40,469. Women with an educational attainment of bachelor's degree earn the most with the average annual earnings of $46,071, while those with college or associate's degree education have the smallest earnings of $24,583.
| Educational Attainment | Male Income | Female Income |
| Less than High School | - | - |
| High School Diploma | $40,469 | $29,583 |
| College or Associate's Degree | $59,821 | $24,583 |
| Bachelor's Degree | $81,250 | $46,071 |
| Graduate Degree | $133,000 | $0 |
| Total | $59,250 | $26,985 |
Family Income in Ranchester
Family Income Brackets in Ranchester
According to the Ranchester family income data, there are 83 families falling into the $100,000 to $149,999 income range, which is the most common income bracket and makes up 34.4% of all families.
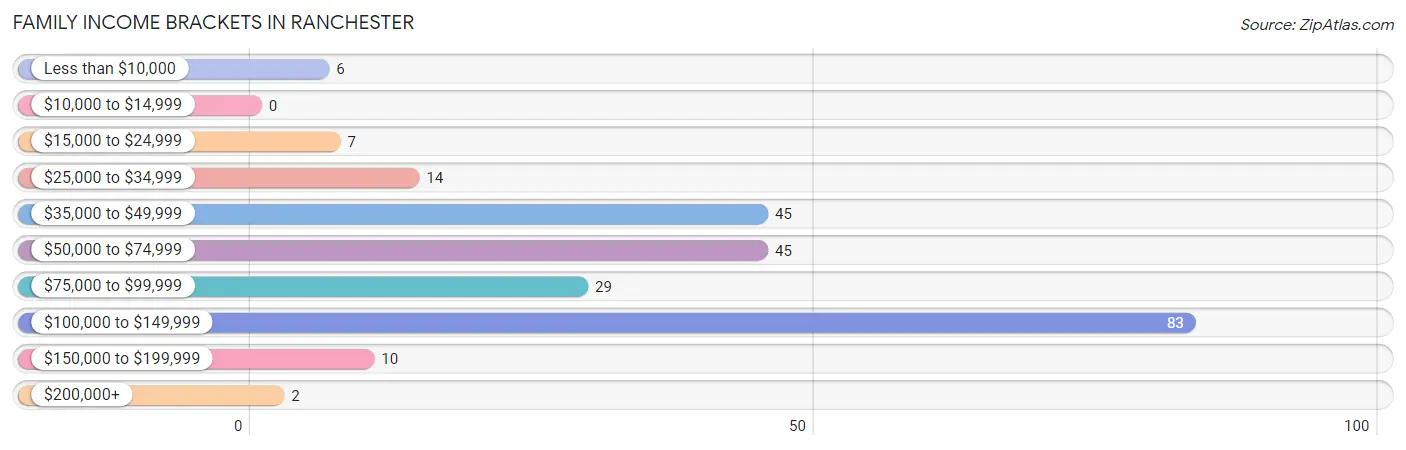
| Income Bracket | # Families | % Families |
| Less than $10,000 | 6 | 2.5% |
| $10,000 to $14,999 | 0 | 0.0% |
| $15,000 to $24,999 | 7 | 2.9% |
| $25,000 to $34,999 | 14 | 5.8% |
| $35,000 to $49,999 | 45 | 18.7% |
| $50,000 to $74,999 | 45 | 18.7% |
| $75,000 to $99,999 | 29 | 12.0% |
| $100,000 to $149,999 | 83 | 34.4% |
| $150,000 to $199,999 | 10 | 4.1% |
| $200,000+ | 2 | 0.8% |
Family Income by Famaliy Size in Ranchester
4-person families (21 | 8.7%) account for the highest median family income in Ranchester with $121,250 per family, while 2-person families (139 | 57.7%) have the highest median income of $30,860 per family member.
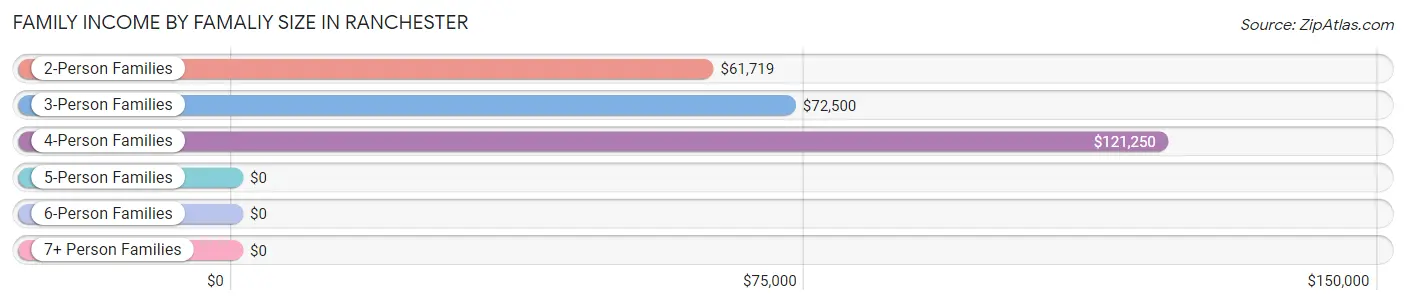
| Income Bracket | # Families | Median Income |
| 2-Person Families | 139 (57.7%) | $61,719 |
| 3-Person Families | 50 (20.7%) | $72,500 |
| 4-Person Families | 21 (8.7%) | $121,250 |
| 5-Person Families | 7 (2.9%) | $0 |
| 6-Person Families | 7 (2.9%) | $0 |
| 7+ Person Families | 17 (7.0%) | $0 |
| Total | 241 (100.0%) | $76,094 |
Family Income by Number of Earners in Ranchester
The median family income in Ranchester is $76,094, with families comprising 3+ earners (21) having the highest median family income of $143,438, while families with no earners (23) have the lowest median family income of $46,518, accounting for 8.7% and 9.5% of families, respectively.
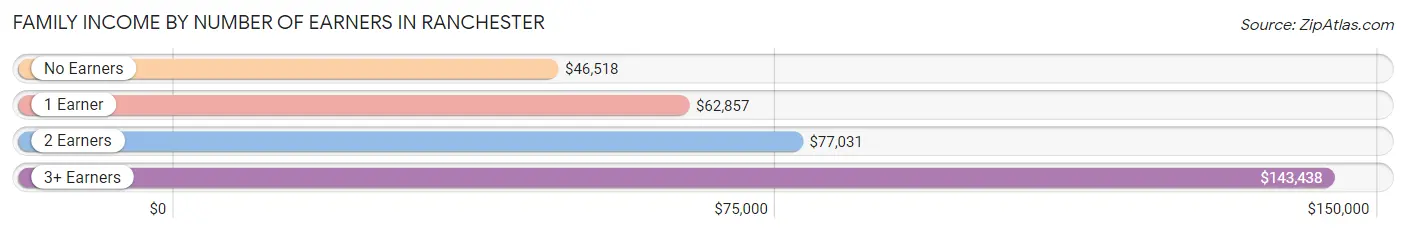
| Number of Earners | # Families | Median Income |
| No Earners | 23 (9.5%) | $46,518 |
| 1 Earner | 66 (27.4%) | $62,857 |
| 2 Earners | 131 (54.4%) | $77,031 |
| 3+ Earners | 21 (8.7%) | $143,438 |
| Total | 241 (100.0%) | $76,094 |
Household Income in Ranchester
Household Income Brackets in Ranchester
With 108 households falling in the category, the $100,000 to $149,999 income range is the most frequent in Ranchester, accounting for 33.0% of all households.
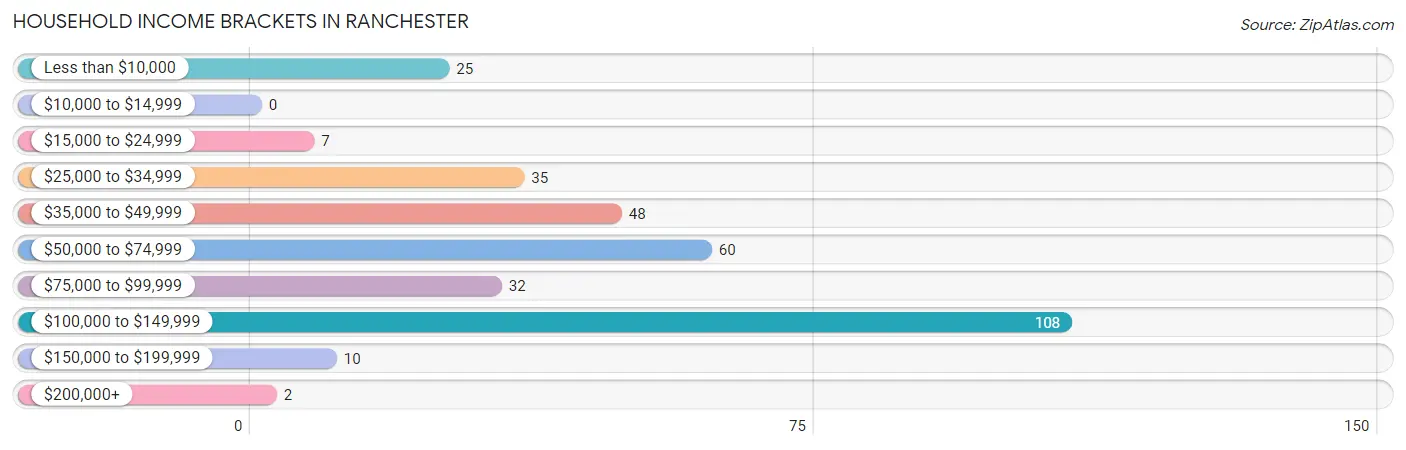
| Income Bracket | # Households | % Households |
| Less than $10,000 | 25 | 7.6% |
| $10,000 to $14,999 | 0 | 0.0% |
| $15,000 to $24,999 | 7 | 2.1% |
| $25,000 to $34,999 | 35 | 10.7% |
| $35,000 to $49,999 | 48 | 14.7% |
| $50,000 to $74,999 | 60 | 18.3% |
| $75,000 to $99,999 | 32 | 9.8% |
| $100,000 to $149,999 | 108 | 33.0% |
| $150,000 to $199,999 | 10 | 3.1% |
| $200,000+ | 2 | 0.6% |
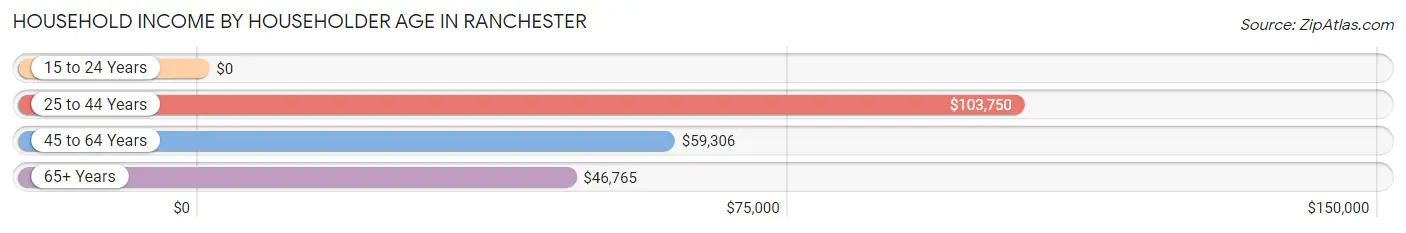
Household Income by Householder Age in Ranchester
The median household income in Ranchester is $63,083, with the highest median household income of $103,750 found in the 25 to 44 years age bracket for the primary householder. A total of 132 households (40.4%) fall into this category.
| Income Bracket | # Households | Median Income |
| 15 to 24 Years | 0 (0.0%) | $0 |
| 25 to 44 Years | 132 (40.4%) | $103,750 |
| 45 to 64 Years | 133 (40.7%) | $59,306 |
| 65+ Years | 62 (19.0%) | $46,765 |
| Total | 327 (100.0%) | $63,083 |
Poverty in Ranchester
Income Below Poverty by Sex and Age in Ranchester
With 10.1% poverty level for males and 6.5% for females among the residents of Ranchester, 5 year old males and 12 to 14 year old females are the most vulnerable to poverty, with 8 males (100.0%) and 2 females (25.0%) in their respective age groups living below the poverty level.
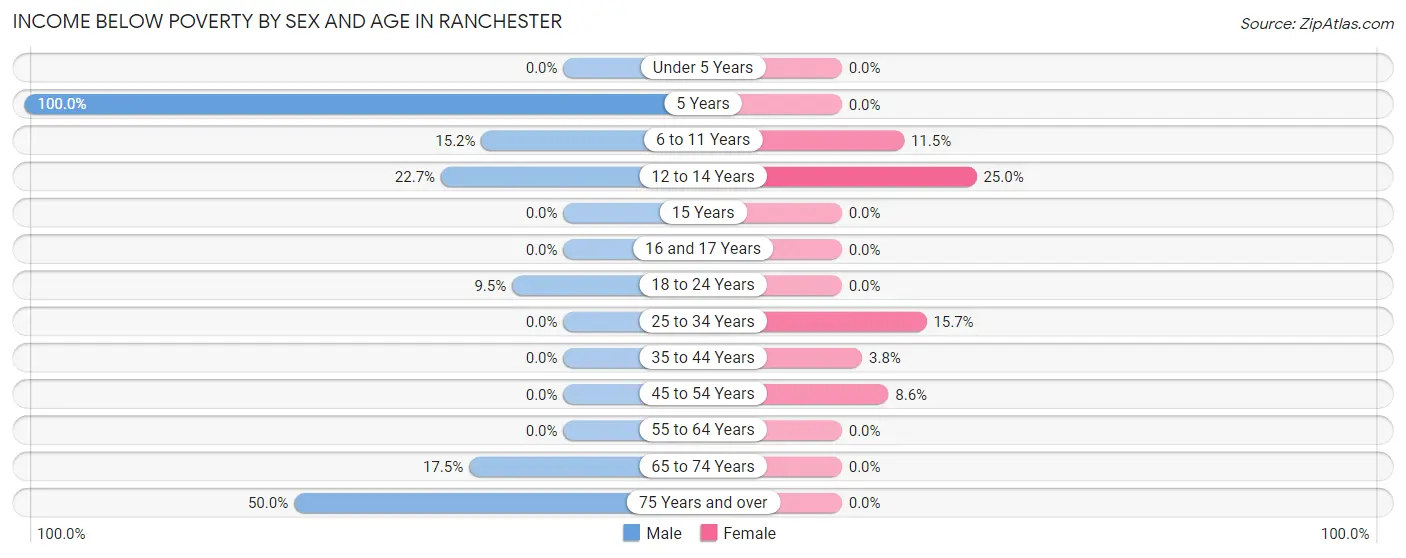
| Age Bracket | Male | Female |
| Under 5 Years | 0 (0.0%) | 0 (0.0%) |
| 5 Years | 8 (100.0%) | 0 (0.0%) |
| 6 to 11 Years | 14 (15.2%) | 6 (11.5%) |
| 12 to 14 Years | 10 (22.7%) | 2 (25.0%) |
| 15 Years | 0 (0.0%) | 0 (0.0%) |
| 16 and 17 Years | 0 (0.0%) | 0 (0.0%) |
| 18 to 24 Years | 6 (9.5%) | 0 (0.0%) |
| 25 to 34 Years | 0 (0.0%) | 11 (15.7%) |
| 35 to 44 Years | 0 (0.0%) | 2 (3.8%) |
| 45 to 54 Years | 0 (0.0%) | 7 (8.6%) |
| 55 to 64 Years | 0 (0.0%) | 0 (0.0%) |
| 65 to 74 Years | 7 (17.5%) | 0 (0.0%) |
| 75 Years and over | 9 (50.0%) | 0 (0.0%) |
| Total | 54 (10.1%) | 28 (6.5%) |
Income Above Poverty by Sex and Age in Ranchester
According to the poverty statistics in Ranchester, males aged under 5 years and females aged under 5 years are the age groups that are most secure financially, with 100.0% of males and 100.0% of females in these age groups living above the poverty line.
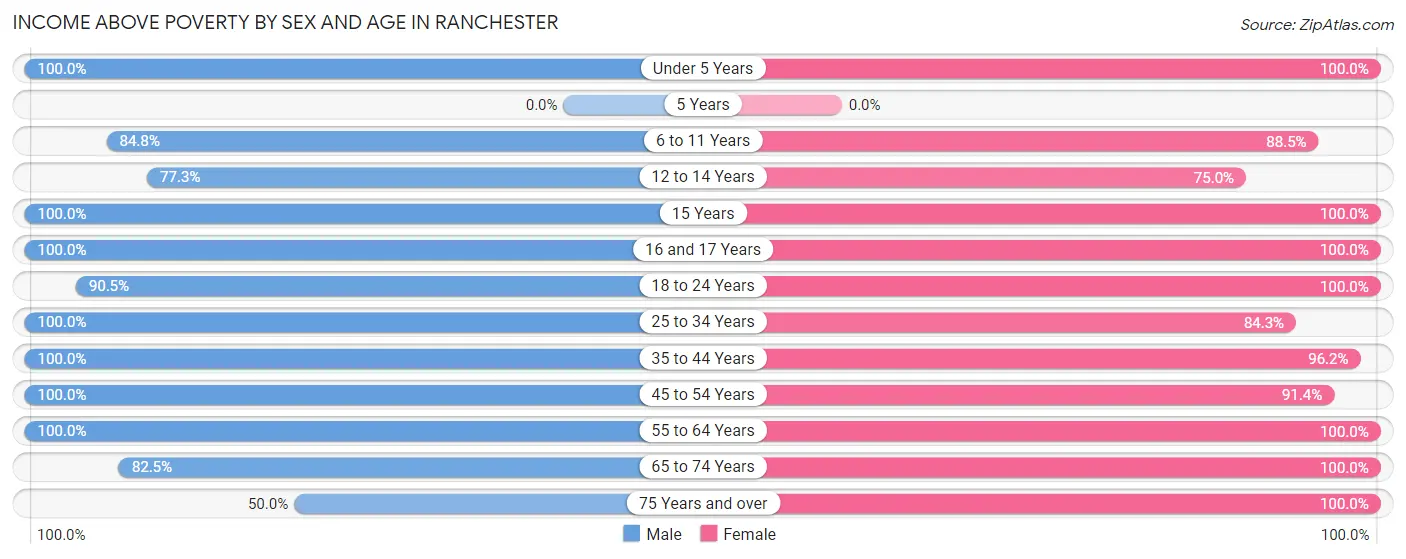
| Age Bracket | Male | Female |
| Under 5 Years | 10 (100.0%) | 58 (100.0%) |
| 5 Years | 0 (0.0%) | 0 (0.0%) |
| 6 to 11 Years | 78 (84.8%) | 46 (88.5%) |
| 12 to 14 Years | 34 (77.3%) | 6 (75.0%) |
| 15 Years | 15 (100.0%) | 4 (100.0%) |
| 16 and 17 Years | 18 (100.0%) | 21 (100.0%) |
| 18 to 24 Years | 57 (90.5%) | 13 (100.0%) |
| 25 to 34 Years | 54 (100.0%) | 59 (84.3%) |
| 35 to 44 Years | 65 (100.0%) | 51 (96.2%) |
| 45 to 54 Years | 53 (100.0%) | 74 (91.4%) |
| 55 to 64 Years | 57 (100.0%) | 32 (100.0%) |
| 65 to 74 Years | 33 (82.5%) | 28 (100.0%) |
| 75 Years and over | 9 (50.0%) | 10 (100.0%) |
| Total | 483 (89.9%) | 402 (93.5%) |
Income Below Poverty Among Married-Couple Families in Ranchester
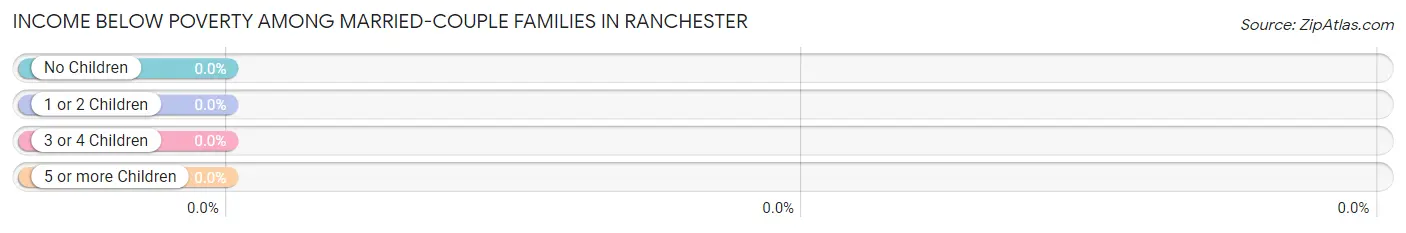
| Children | Above Poverty | Below Poverty |
| No Children | 139 (100.0%) | 0 (0.0%) |
| 1 or 2 Children | 38 (100.0%) | 0 (0.0%) |
| 3 or 4 Children | 8 (100.0%) | 0 (0.0%) |
| 5 or more Children | 17 (100.0%) | 0 (0.0%) |
| Total | 202 (100.0%) | 0 (0.0%) |
Income Below Poverty Among Single-Parent Households in Ranchester
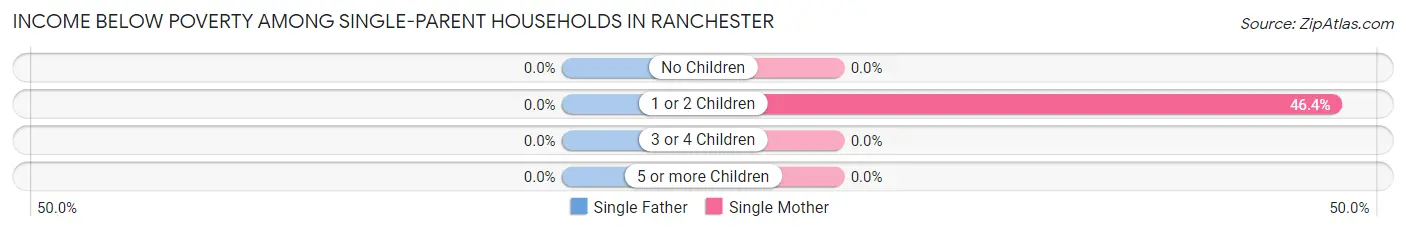
| Children | Single Father | Single Mother |
| No Children | 0 (0.0%) | 0 (0.0%) |
| 1 or 2 Children | 0 (0.0%) | 13 (46.4%) |
| 3 or 4 Children | 0 (0.0%) | 0 (0.0%) |
| 5 or more Children | 0 (0.0%) | 0 (0.0%) |
| Total | 0 (0.0%) | 13 (43.3%) |
Income Below Poverty Among Married-Couple vs Single-Parent Households in Ranchester
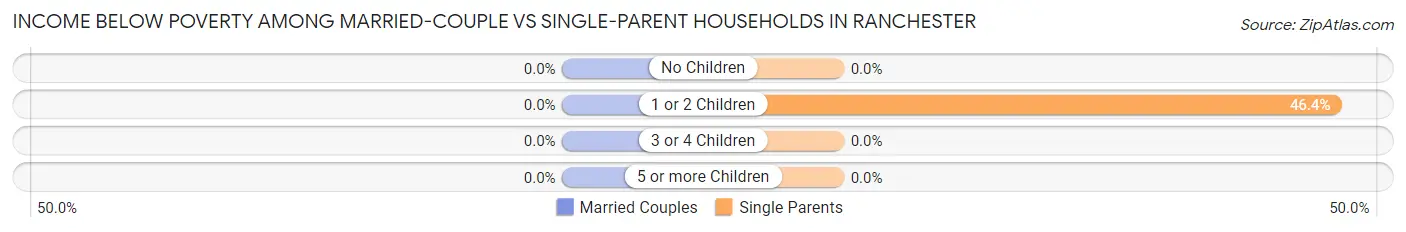
| Children | Married-Couple Families | Single-Parent Households |
| No Children | 0 (0.0%) | 0 (0.0%) |
| 1 or 2 Children | 0 (0.0%) | 13 (46.4%) |
| 3 or 4 Children | 0 (0.0%) | 0 (0.0%) |
| 5 or more Children | 0 (0.0%) | 0 (0.0%) |
| Total | 0 (0.0%) | 13 (33.3%) |
Race in Ranchester
The most populous races in Ranchester are White / Caucasian (930 | 96.2%), Native / Alaskan (37 | 3.8%), and Hispanic or Latino (21 | 2.2%).
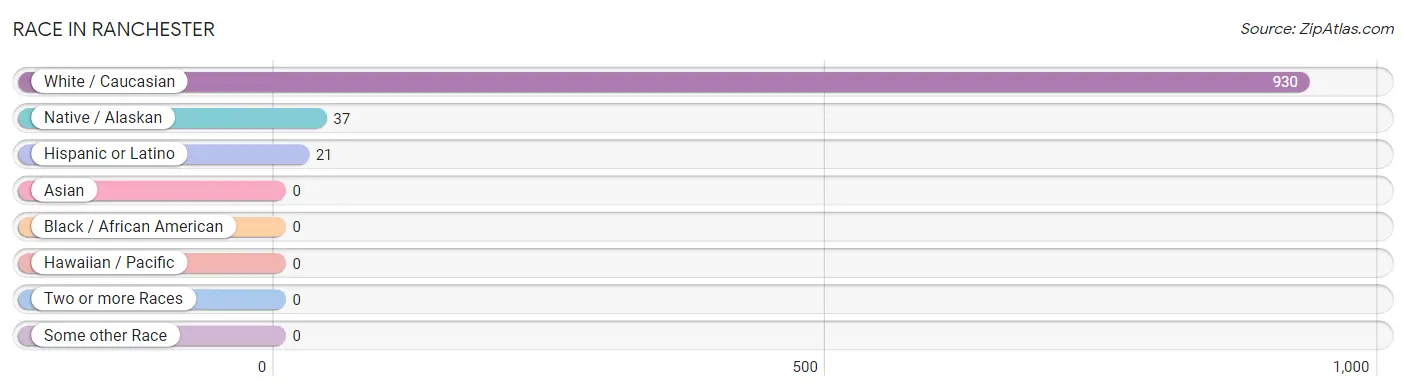
| Race | # Population | % Population |
| Asian | 0 | 0.0% |
| Black / African American | 0 | 0.0% |
| Hawaiian / Pacific | 0 | 0.0% |
| Hispanic or Latino | 21 | 2.2% |
| Native / Alaskan | 37 | 3.8% |
| White / Caucasian | 930 | 96.2% |
| Two or more Races | 0 | 0.0% |
| Some other Race | 0 | 0.0% |
| Total | 967 | 100.0% |
Ancestry in Ranchester
The most populous ancestries reported in Ranchester are German (107 | 11.1%), English (62 | 6.4%), Norwegian (49 | 5.1%), Sioux (37 | 3.8%), and Irish (36 | 3.7%), together accounting for 30.1% of all Ranchester residents.
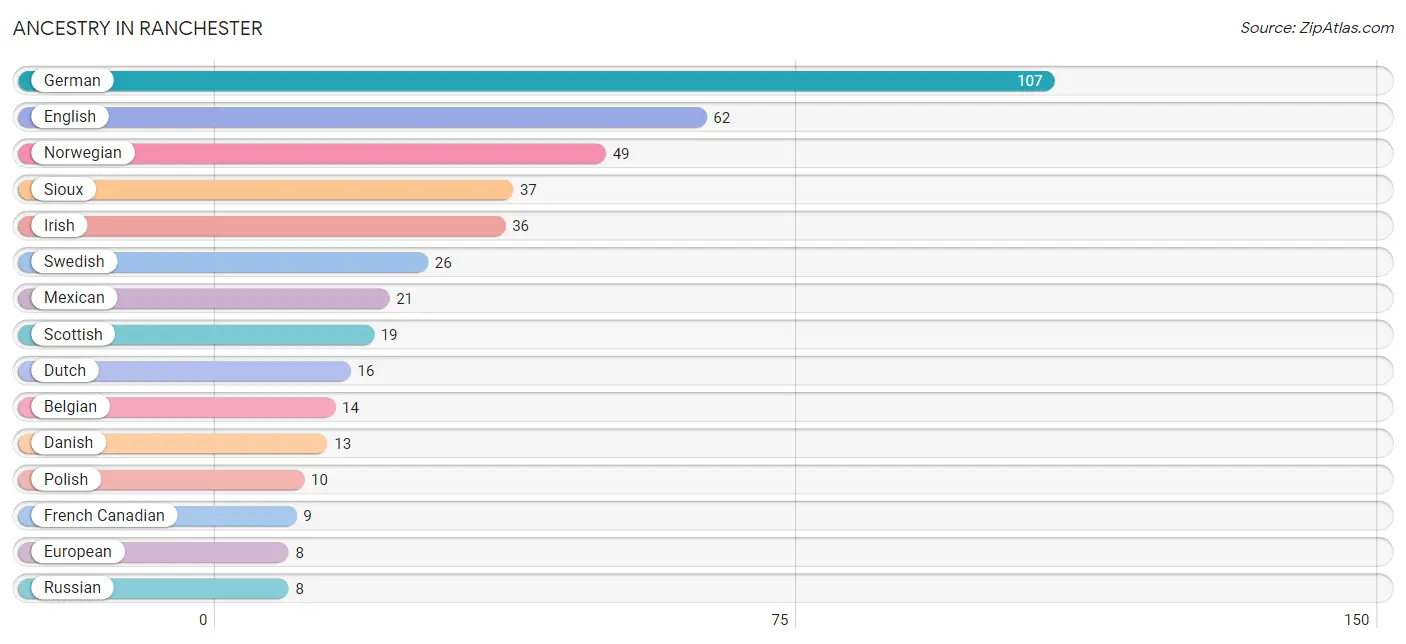
| Ancestry | # Population | % Population |
| American | 3 | 0.3% |
| Belgian | 14 | 1.5% |
| Danish | 13 | 1.3% |
| Dutch | 16 | 1.7% |
| English | 62 | 6.4% |
| European | 8 | 0.8% |
| French | 4 | 0.4% |
| French Canadian | 9 | 0.9% |
| German | 107 | 11.1% |
| Greek | 2 | 0.2% |
| Irish | 36 | 3.7% |
| Italian | 2 | 0.2% |
| Macedonian | 2 | 0.2% |
| Mexican | 21 | 2.2% |
| Norwegian | 49 | 5.1% |
| Polish | 10 | 1.0% |
| Russian | 8 | 0.8% |
| Scandinavian | 7 | 0.7% |
| Scotch-Irish | 8 | 0.8% |
| Scottish | 19 | 2.0% |
| Sioux | 37 | 3.8% |
| Swedish | 26 | 2.7% |
| Ukrainian | 2 | 0.2% | View All 23 Rows |
Immigrants in Ranchester
The most numerous immigrant groups reported in Ranchester came from Eastern Europe (2 | 0.2%), Europe (2 | 0.2%), and Russia (2 | 0.2%), together accounting for 0.6% of all Ranchester residents.
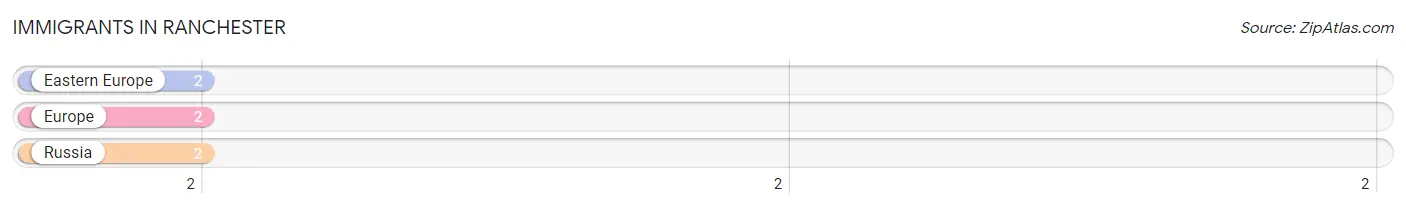
| Immigration Origin | # Population | % Population |
| Eastern Europe | 2 | 0.2% |
| Europe | 2 | 0.2% |
| Russia | 2 | 0.2% | View All 3 Rows |
Sex and Age in Ranchester
Sex and Age in Ranchester
The most populous age groups in Ranchester are 5 to 9 Years (94 | 17.5%) for men and 30 to 34 Years (68 | 15.8%) for women.
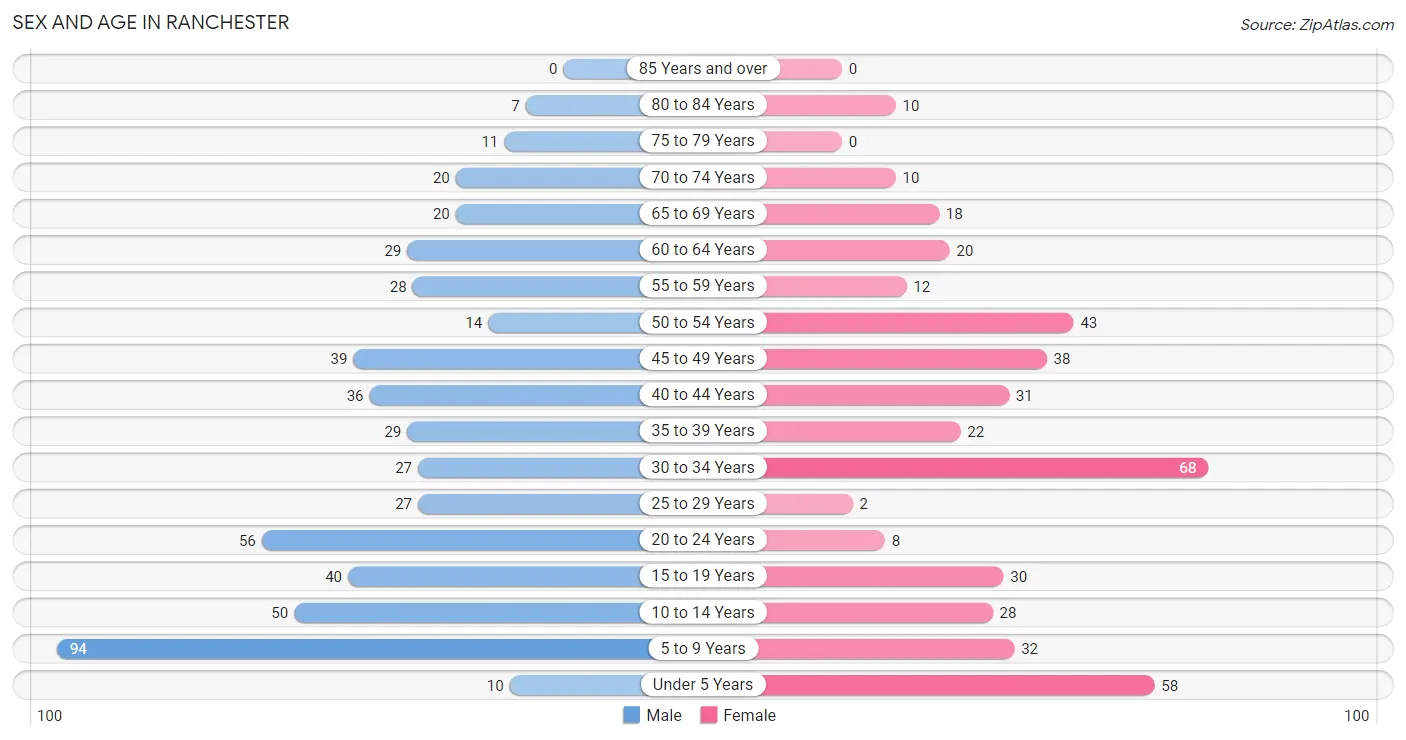
| Age Bracket | Male | Female |
| Under 5 Years | 10 (1.9%) | 58 (13.5%) |
| 5 to 9 Years | 94 (17.5%) | 32 (7.4%) |
| 10 to 14 Years | 50 (9.3%) | 28 (6.5%) |
| 15 to 19 Years | 40 (7.4%) | 30 (7.0%) |
| 20 to 24 Years | 56 (10.4%) | 8 (1.9%) |
| 25 to 29 Years | 27 (5.0%) | 2 (0.5%) |
| 30 to 34 Years | 27 (5.0%) | 68 (15.8%) |
| 35 to 39 Years | 29 (5.4%) | 22 (5.1%) |
| 40 to 44 Years | 36 (6.7%) | 31 (7.2%) |
| 45 to 49 Years | 39 (7.3%) | 38 (8.8%) |
| 50 to 54 Years | 14 (2.6%) | 43 (10.0%) |
| 55 to 59 Years | 28 (5.2%) | 12 (2.8%) |
| 60 to 64 Years | 29 (5.4%) | 20 (4.6%) |
| 65 to 69 Years | 20 (3.7%) | 18 (4.2%) |
| 70 to 74 Years | 20 (3.7%) | 10 (2.3%) |
| 75 to 79 Years | 11 (2.1%) | 0 (0.0%) |
| 80 to 84 Years | 7 (1.3%) | 10 (2.3%) |
| 85 Years and over | 0 (0.0%) | 0 (0.0%) |
| Total | 537 (100.0%) | 430 (100.0%) |
Families and Households in Ranchester
Median Family Size in Ranchester
The median family size in Ranchester is 3.54 persons per family, with single female/mother families (30 | 12.4%) accounting for the largest median family size of 5.9 persons per family. On the other hand, single male/father families (9 | 3.7%) represent the smallest median family size with 1.44 persons per family.
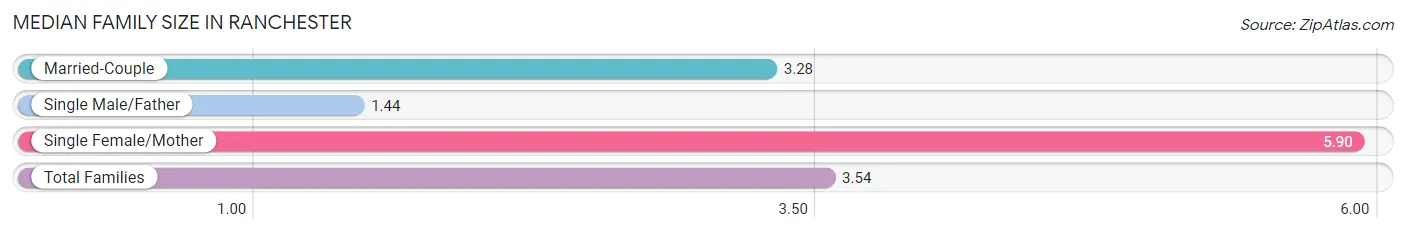
| Family Type | # Families | Family Size |
| Married-Couple | 202 (83.8%) | 3.28 |
| Single Male/Father | 9 (3.7%) | 1.44 |
| Single Female/Mother | 30 (12.4%) | 5.90 |
| Total Families | 241 (100.0%) | 3.54 |
Median Household Size in Ranchester
The median household size in Ranchester is 2.96 persons per household, with single female/mother households (30 | 9.2%) accounting for the largest median household size of 6.3 persons per household. non-family households (86 | 26.3%) represent the smallest median household size with 1.20 persons per household.
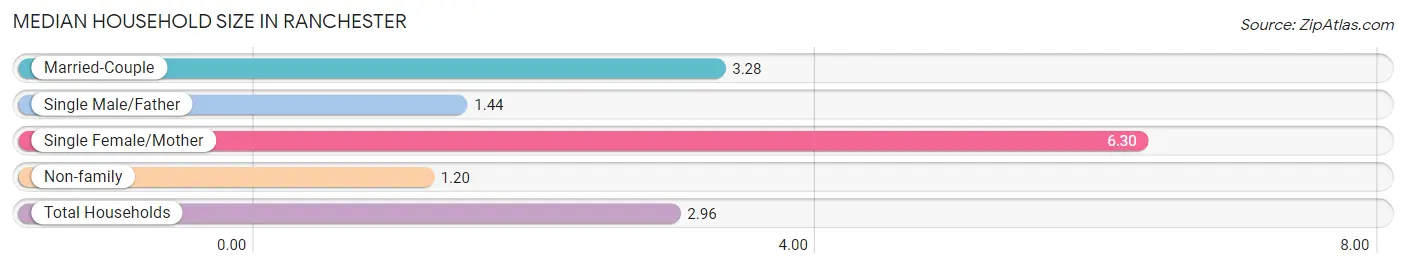
| Household Type | # Households | Household Size |
| Married-Couple | 202 (61.8%) | 3.28 |
| Single Male/Father | 9 (2.8%) | 1.44 |
| Single Female/Mother | 30 (9.2%) | 6.30 |
| Non-family | 86 (26.3%) | 1.20 |
| Total Households | 327 (100.0%) | 2.96 |
Household Size by Marriage Status in Ranchester
Out of a total of 327 households in Ranchester, 241 (73.7%) are family households, while 86 (26.3%) are nonfamily households. The most numerous type of family households are 2-person households, comprising 139, and the most common type of nonfamily households are 1-person households, comprising 74.
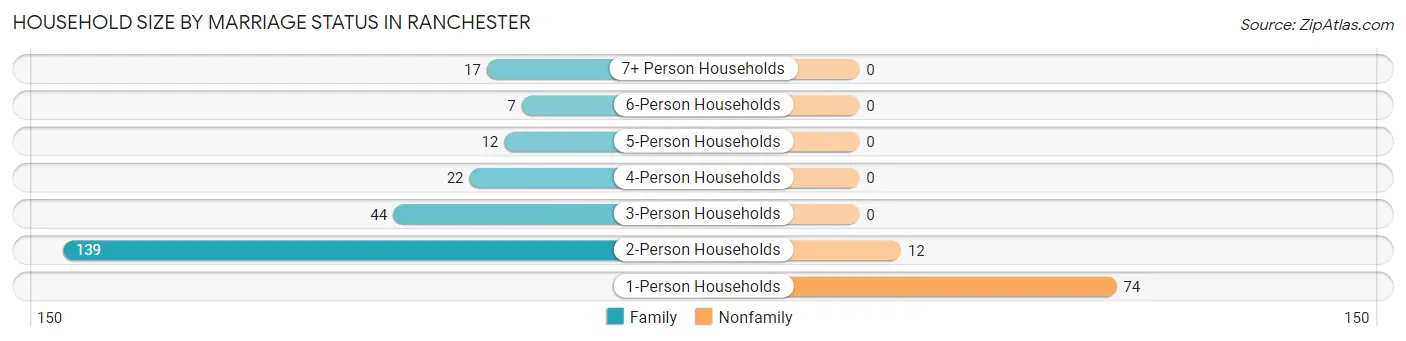
| Household Size | Family Households | Nonfamily Households |
| 1-Person Households | - | 74 (22.6%) |
| 2-Person Households | 139 (42.5%) | 12 (3.7%) |
| 3-Person Households | 44 (13.5%) | 0 (0.0%) |
| 4-Person Households | 22 (6.7%) | 0 (0.0%) |
| 5-Person Households | 12 (3.7%) | 0 (0.0%) |
| 6-Person Households | 7 (2.1%) | 0 (0.0%) |
| 7+ Person Households | 17 (5.2%) | 0 (0.0%) |
| Total | 241 (73.7%) | 86 (26.3%) |
Female Fertility in Ranchester
Fertility by Age in Ranchester
Average fertility rate in Ranchester is 25.0 births per 1,000 women. Women in the age bracket of 20 to 34 years have the highest fertility rate with 64.0 births per 1,000 women. Women in the age bracket of 20 to 34 years acount for 100.0% of all women with births.
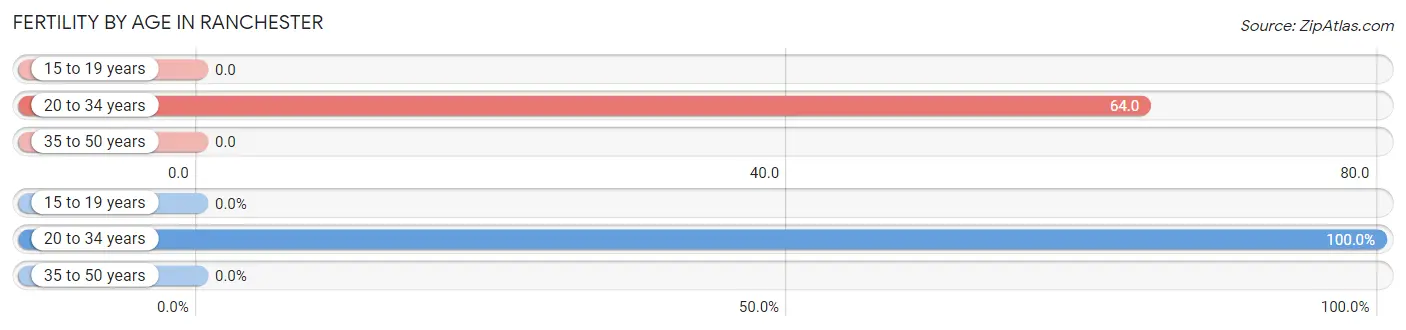
| Age Bracket | Women with Births | Births / 1,000 Women |
| 15 to 19 years | 0 (0.0%) | 0.0 |
| 20 to 34 years | 5 (100.0%) | 64.0 |
| 35 to 50 years | 0 (0.0%) | 0.0 |
| Total | 5 (100.0%) | 25.0 |
Fertility by Age by Marriage Status in Ranchester

| Age Bracket | Married | Unmarried |
| 15 to 19 years | 0 (0.0%) | 0 (0.0%) |
| 20 to 34 years | 5 (100.0%) | 0 (0.0%) |
| 35 to 50 years | 0 (0.0%) | 0 (0.0%) |
| Total | 5 (100.0%) | 0 (0.0%) |
Fertility by Education in Ranchester
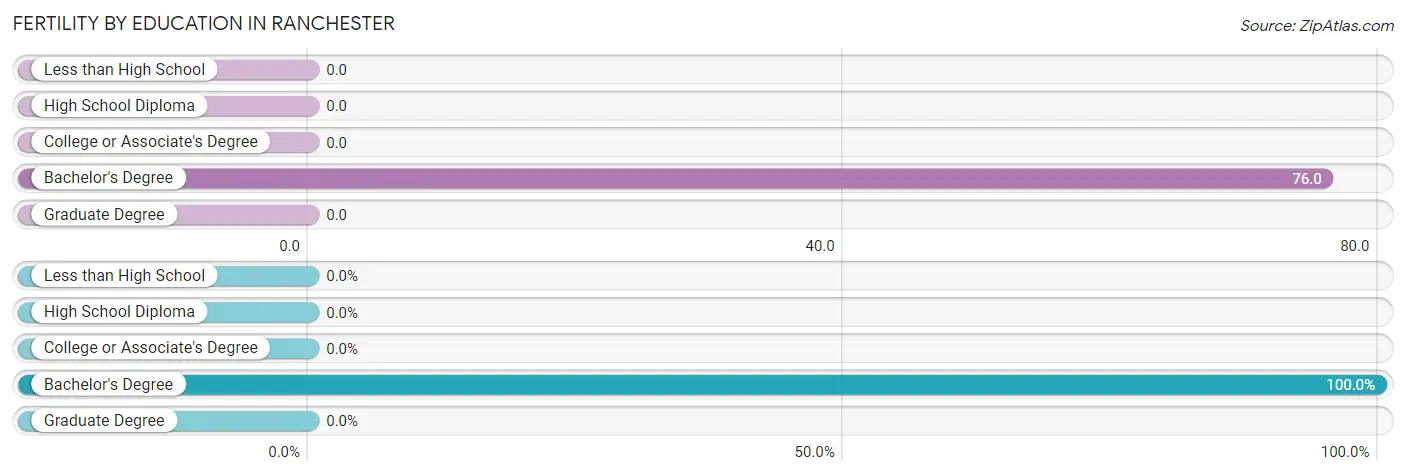
| Educational Attainment | Women with Births | Births / 1,000 Women |
| Less than High School | 0 (0.0%) | 0.0 |
| High School Diploma | 0 (0.0%) | 0.0 |
| College or Associate's Degree | 0 (0.0%) | 0.0 |
| Bachelor's Degree | 5 (100.0%) | 76.0 |
| Graduate Degree | 0 (0.0%) | 0.0 |
| Total | 5 (100.0%) | 25.0 |
Fertility by Education by Marriage Status in Ranchester
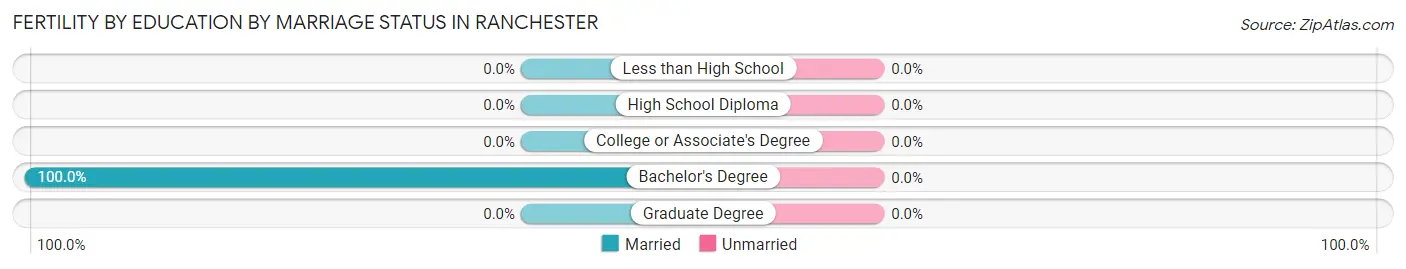
| Educational Attainment | Married | Unmarried |
| Less than High School | 0 (0.0%) | 0 (0.0%) |
| High School Diploma | 0 (0.0%) | 0 (0.0%) |
| College or Associate's Degree | 0 (0.0%) | 0 (0.0%) |
| Bachelor's Degree | 5 (100.0%) | 0 (0.0%) |
| Graduate Degree | 0 (0.0%) | 0 (0.0%) |
| Total | 5 (100.0%) | 0 (0.0%) |
Employment Characteristics in Ranchester
Employment by Class of Employer in Ranchester
Among the 500 employed individuals in Ranchester, private company employees (301 | 60.2%), local government employees (48 | 9.6%), and not-for-profit organizations (47 | 9.4%) make up the most common classes of employment.
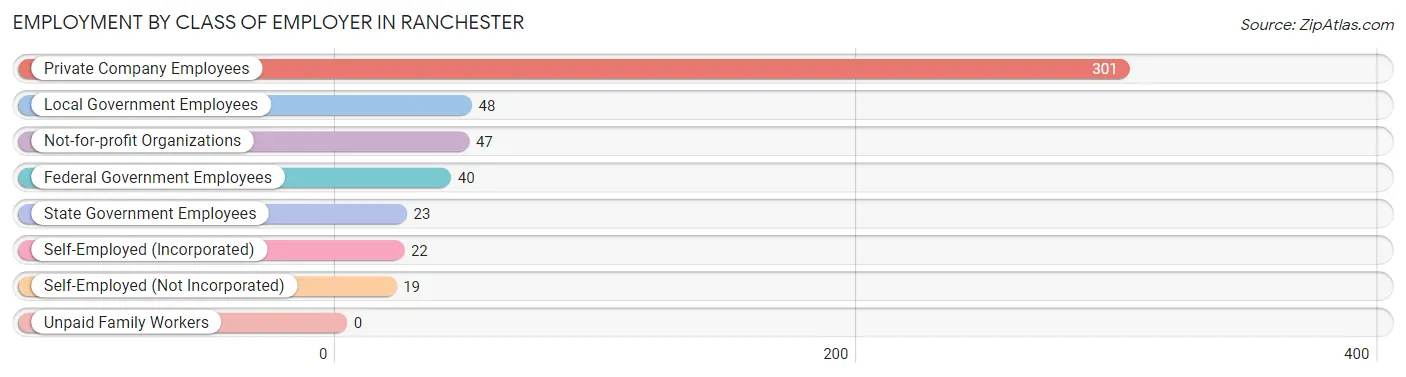
| Employer Class | # Employees | % Employees |
| Private Company Employees | 301 | 60.2% |
| Self-Employed (Incorporated) | 22 | 4.4% |
| Self-Employed (Not Incorporated) | 19 | 3.8% |
| Not-for-profit Organizations | 47 | 9.4% |
| Local Government Employees | 48 | 9.6% |
| State Government Employees | 23 | 4.6% |
| Federal Government Employees | 40 | 8.0% |
| Unpaid Family Workers | 0 | 0.0% |
| Total | 500 | 100.0% |
Employment Status by Age in Ranchester
According to the labor force statistics for Ranchester, out of the total population over 16 years of age (676), 75.7% or 512 individuals are in the labor force, with 1.6% or 8 of them unemployed. The age group with the highest labor force participation rate is 25 to 29 years, with 100.0% or 29 individuals in the labor force. Within the labor force, the 20 to 24 years age range has the highest percentage of unemployed individuals, with 10.7% or 6 of them being unemployed.
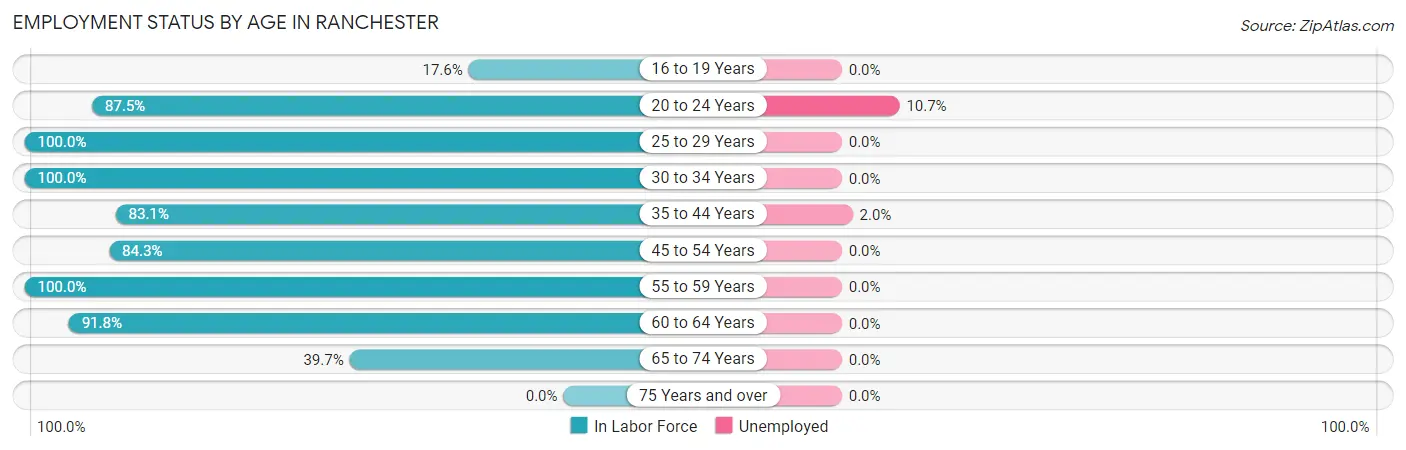
| Age Bracket | In Labor Force | Unemployed |
| 16 to 19 Years | 9 (17.6%) | 0 (0.0%) |
| 20 to 24 Years | 56 (87.5%) | 6 (10.7%) |
| 25 to 29 Years | 29 (100.0%) | 0 (0.0%) |
| 30 to 34 Years | 95 (100.0%) | 0 (0.0%) |
| 35 to 44 Years | 98 (83.1%) | 2 (2.0%) |
| 45 to 54 Years | 113 (84.3%) | 0 (0.0%) |
| 55 to 59 Years | 40 (100.0%) | 0 (0.0%) |
| 60 to 64 Years | 45 (91.8%) | 0 (0.0%) |
| 65 to 74 Years | 27 (39.7%) | 0 (0.0%) |
| 75 Years and over | 0 (0.0%) | 0 (0.0%) |
| Total | 512 (75.7%) | 8 (1.6%) |
Employment Status by Educational Attainment in Ranchester
According to labor force statistics for Ranchester, 90.3% of individuals (420) out of the total population between 25 and 64 years of age (465) are in the labor force, with 0.5% or 2 of them being unemployed. The group with the highest labor force participation rate are those with the educational attainment of less than high school, with 100.0% or 21 individuals in the labor force. Within the labor force, individuals with less than high school education have the highest percentage of unemployment, with 9.5% or 2 of them being unemployed.
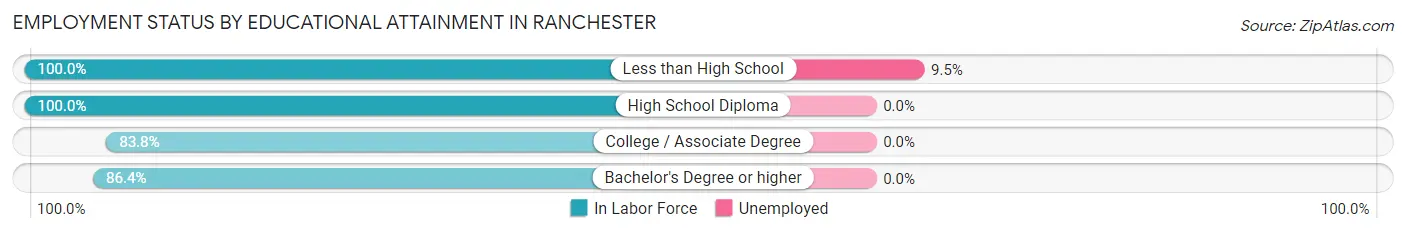
| Educational Attainment | In Labor Force | Unemployed |
| Less than High School | 21 (100.0%) | 2 (9.5%) |
| High School Diploma | 144 (100.0%) | 0 (0.0%) |
| College / Associate Degree | 134 (83.8%) | 0 (0.0%) |
| Bachelor's Degree or higher | 121 (86.4%) | 0 (0.0%) |
| Total | 420 (90.3%) | 2 (0.5%) |
Employment Occupations by Sex in Ranchester
Management, Business, Science and Arts Occupations
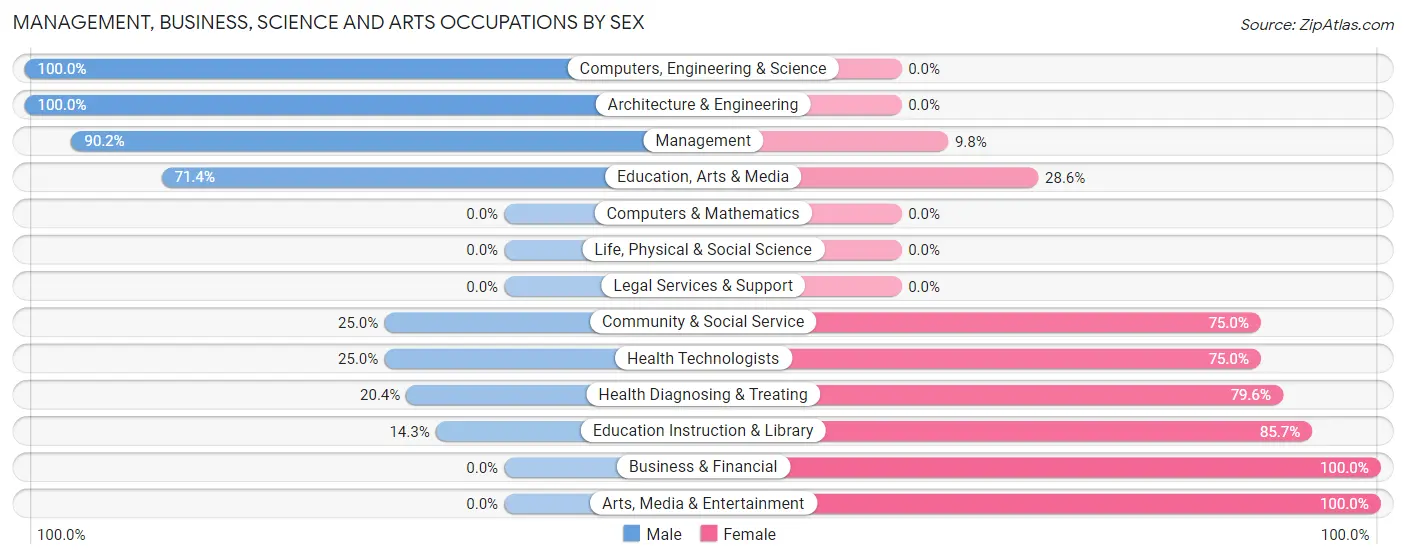
The most common Management, Business, Science and Arts occupations in Ranchester are Health Diagnosing & Treating (49 | 9.7%), Management (41 | 8.1%), Community & Social Service (32 | 6.4%), Education Instruction & Library (21 | 4.2%), and Business & Financial (15 | 3.0%).
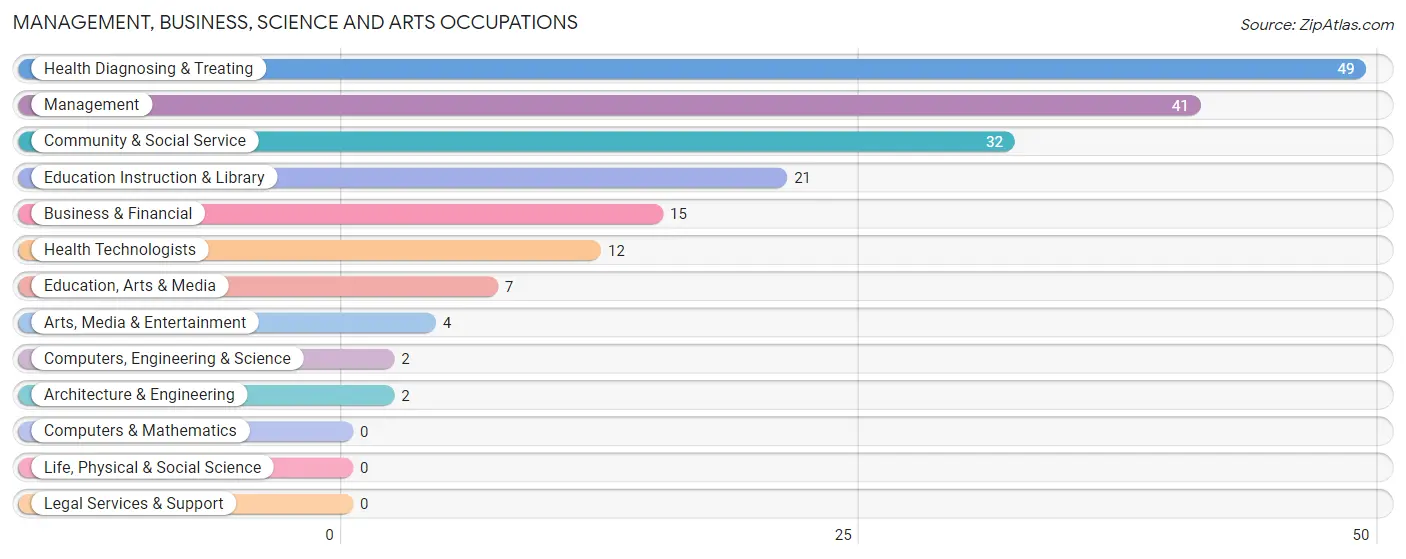
Management, Business, Science and Arts Occupations by Sex
Within the Management, Business, Science and Arts occupations in Ranchester, the most male-oriented occupations are Computers, Engineering & Science (100.0%), Architecture & Engineering (100.0%), and Management (90.2%), while the most female-oriented occupations are Business & Financial (100.0%), Arts, Media & Entertainment (100.0%), and Education Instruction & Library (85.7%).
| Occupation | Male | Female |
| Management | 37 (90.2%) | 4 (9.8%) |
| Business & Financial | 0 (0.0%) | 15 (100.0%) |
| Computers, Engineering & Science | 2 (100.0%) | 0 (0.0%) |
| Computers & Mathematics | 0 (0.0%) | 0 (0.0%) |
| Architecture & Engineering | 2 (100.0%) | 0 (0.0%) |
| Life, Physical & Social Science | 0 (0.0%) | 0 (0.0%) |
| Community & Social Service | 8 (25.0%) | 24 (75.0%) |
| Education, Arts & Media | 5 (71.4%) | 2 (28.6%) |
| Legal Services & Support | 0 (0.0%) | 0 (0.0%) |
| Education Instruction & Library | 3 (14.3%) | 18 (85.7%) |
| Arts, Media & Entertainment | 0 (0.0%) | 4 (100.0%) |
| Health Diagnosing & Treating | 10 (20.4%) | 39 (79.6%) |
| Health Technologists | 3 (25.0%) | 9 (75.0%) |
| Total (Category) | 57 (41.0%) | 82 (59.0%) |
| Total (Overall) | 300 (59.5%) | 204 (40.5%) |
Services Occupations
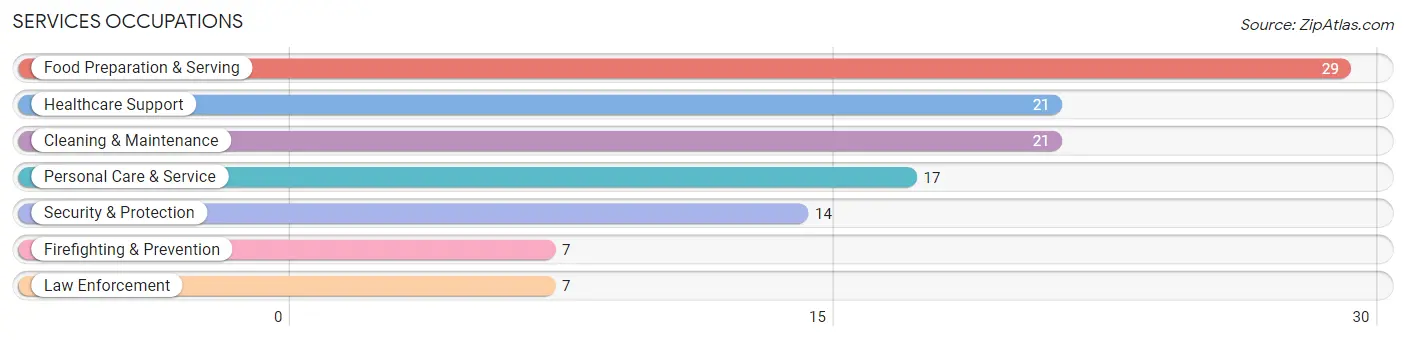
The most common Services occupations in Ranchester are Food Preparation & Serving (29 | 5.8%), Healthcare Support (21 | 4.2%), Cleaning & Maintenance (21 | 4.2%), Personal Care & Service (17 | 3.4%), and Security & Protection (14 | 2.8%).
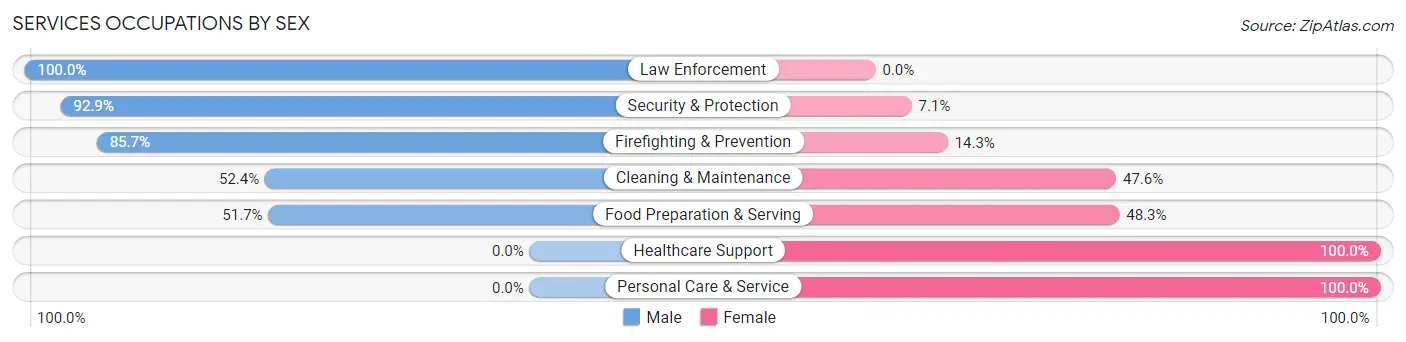
Services Occupations by Sex
Within the Services occupations in Ranchester, the most male-oriented occupations are Law Enforcement (100.0%), Security & Protection (92.9%), and Firefighting & Prevention (85.7%), while the most female-oriented occupations are Healthcare Support (100.0%), Personal Care & Service (100.0%), and Food Preparation & Serving (48.3%).
| Occupation | Male | Female |
| Healthcare Support | 0 (0.0%) | 21 (100.0%) |
| Security & Protection | 13 (92.9%) | 1 (7.1%) |
| Firefighting & Prevention | 6 (85.7%) | 1 (14.3%) |
| Law Enforcement | 7 (100.0%) | 0 (0.0%) |
| Food Preparation & Serving | 15 (51.7%) | 14 (48.3%) |
| Cleaning & Maintenance | 11 (52.4%) | 10 (47.6%) |
| Personal Care & Service | 0 (0.0%) | 17 (100.0%) |
| Total (Category) | 39 (38.2%) | 63 (61.8%) |
| Total (Overall) | 300 (59.5%) | 204 (40.5%) |
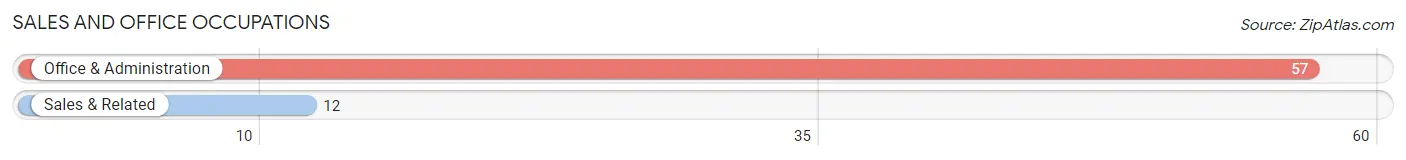
Sales and Office Occupations
The most common Sales and Office occupations in Ranchester are Office & Administration (57 | 11.3%), and Sales & Related (12 | 2.4%).
Sales and Office Occupations by Sex
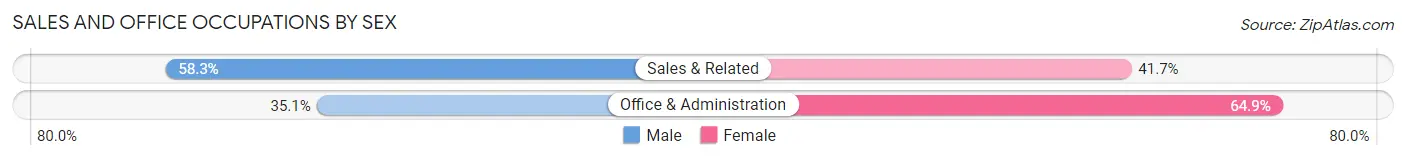
| Occupation | Male | Female |
| Sales & Related | 7 (58.3%) | 5 (41.7%) |
| Office & Administration | 20 (35.1%) | 37 (64.9%) |
| Total (Category) | 27 (39.1%) | 42 (60.9%) |
| Total (Overall) | 300 (59.5%) | 204 (40.5%) |
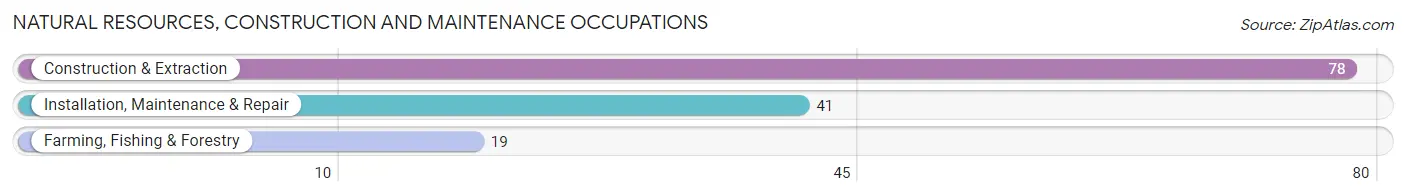
Natural Resources, Construction and Maintenance Occupations
The most common Natural Resources, Construction and Maintenance occupations in Ranchester are Construction & Extraction (78 | 15.5%), Installation, Maintenance & Repair (41 | 8.1%), and Farming, Fishing & Forestry (19 | 3.8%).
Natural Resources, Construction and Maintenance Occupations by Sex
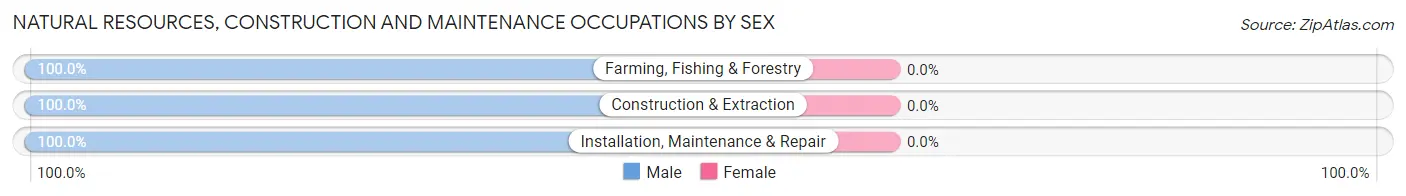
| Occupation | Male | Female |
| Farming, Fishing & Forestry | 19 (100.0%) | 0 (0.0%) |
| Construction & Extraction | 78 (100.0%) | 0 (0.0%) |
| Installation, Maintenance & Repair | 41 (100.0%) | 0 (0.0%) |
| Total (Category) | 138 (100.0%) | 0 (0.0%) |
| Total (Overall) | 300 (59.5%) | 204 (40.5%) |
Production, Transportation and Moving Occupations
The most common Production, Transportation and Moving occupations in Ranchester are Production (22 | 4.4%), Transportation (19 | 3.8%), and Material Moving (15 | 3.0%).
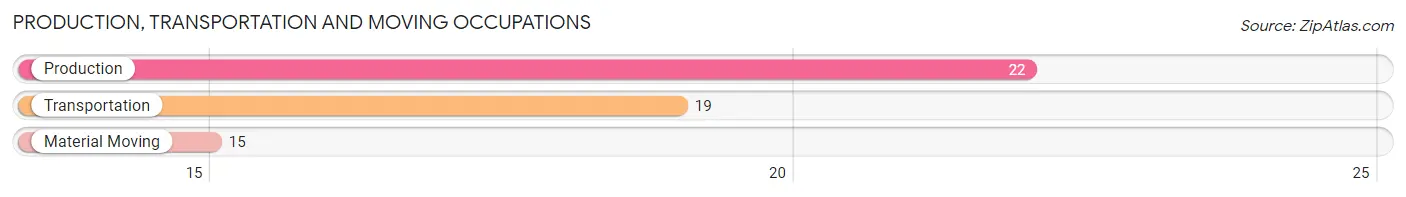
Production, Transportation and Moving Occupations by Sex
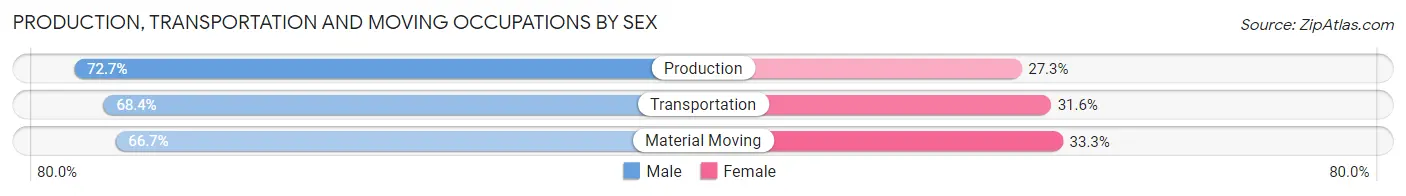
| Occupation | Male | Female |
| Production | 16 (72.7%) | 6 (27.3%) |
| Transportation | 13 (68.4%) | 6 (31.6%) |
| Material Moving | 10 (66.7%) | 5 (33.3%) |
| Total (Category) | 39 (69.6%) | 17 (30.4%) |
| Total (Overall) | 300 (59.5%) | 204 (40.5%) |
Employment Industries by Sex in Ranchester
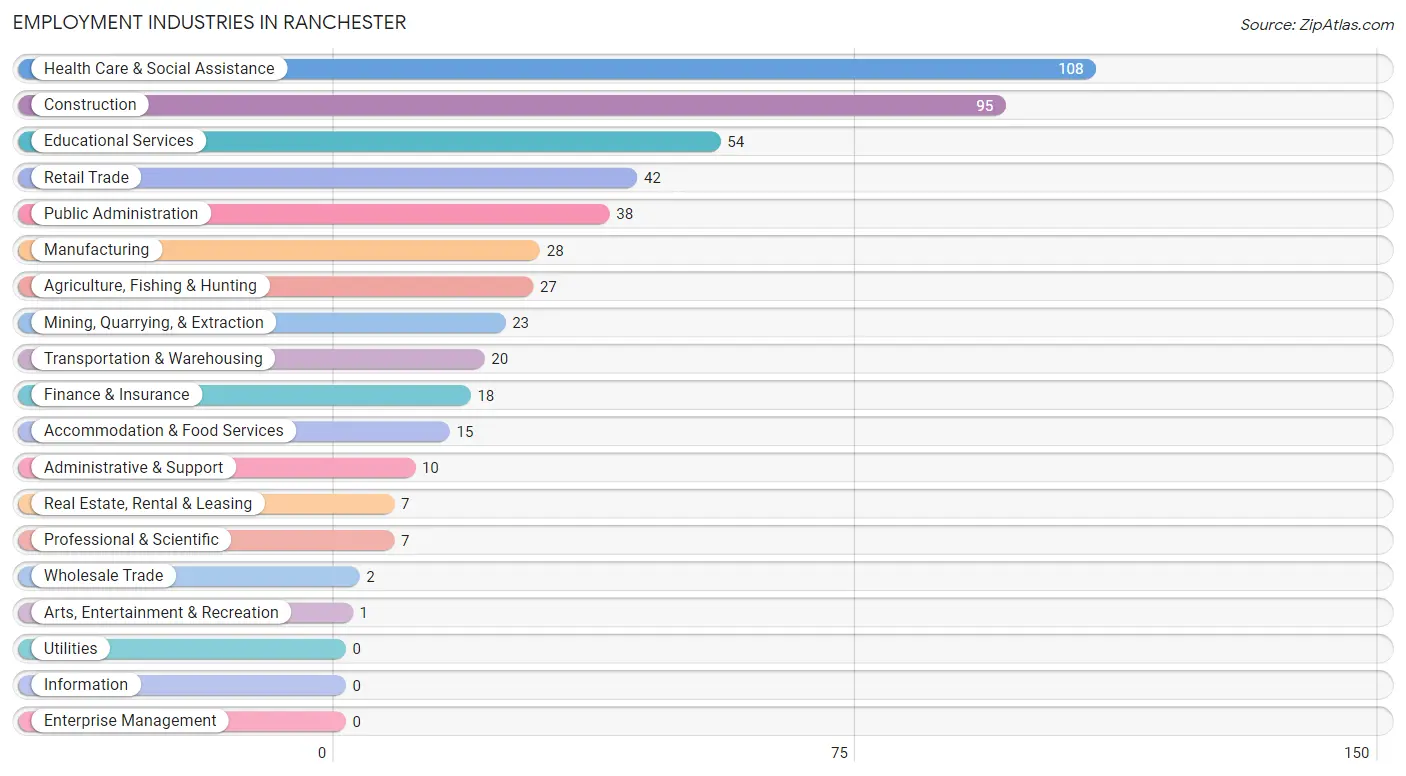
Employment Industries in Ranchester
The major employment industries in Ranchester include Health Care & Social Assistance (108 | 21.4%), Construction (95 | 18.9%), Educational Services (54 | 10.7%), Retail Trade (42 | 8.3%), and Public Administration (38 | 7.5%).
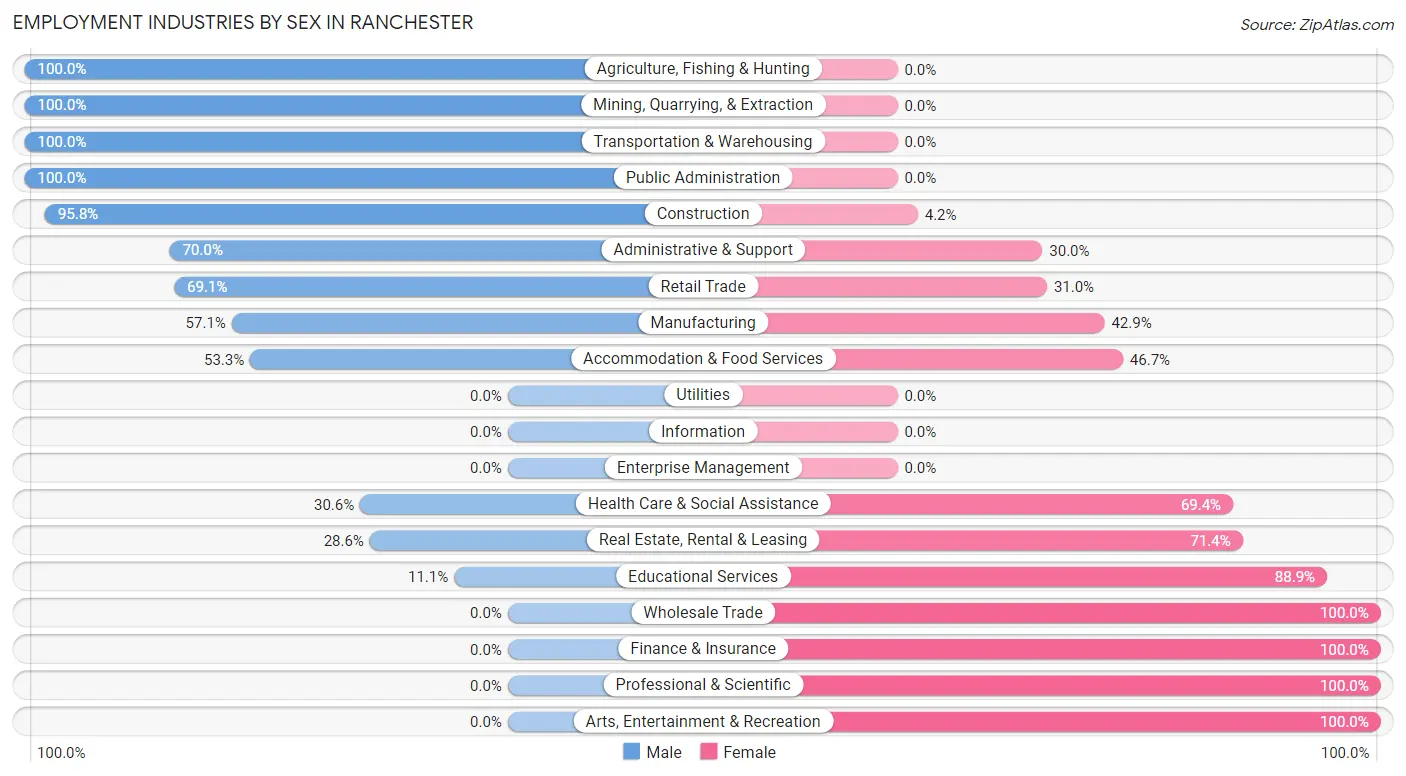
Employment Industries by Sex in Ranchester
The Ranchester industries that see more men than women are Agriculture, Fishing & Hunting (100.0%), Mining, Quarrying, & Extraction (100.0%), and Transportation & Warehousing (100.0%), whereas the industries that tend to have a higher number of women are Wholesale Trade (100.0%), Finance & Insurance (100.0%), and Professional & Scientific (100.0%).
| Industry | Male | Female |
| Agriculture, Fishing & Hunting | 27 (100.0%) | 0 (0.0%) |
| Mining, Quarrying, & Extraction | 23 (100.0%) | 0 (0.0%) |
| Construction | 91 (95.8%) | 4 (4.2%) |
| Manufacturing | 16 (57.1%) | 12 (42.9%) |
| Wholesale Trade | 0 (0.0%) | 2 (100.0%) |
| Retail Trade | 29 (69.1%) | 13 (30.9%) |
| Transportation & Warehousing | 20 (100.0%) | 0 (0.0%) |
| Utilities | 0 (0.0%) | 0 (0.0%) |
| Information | 0 (0.0%) | 0 (0.0%) |
| Finance & Insurance | 0 (0.0%) | 18 (100.0%) |
| Real Estate, Rental & Leasing | 2 (28.6%) | 5 (71.4%) |
| Professional & Scientific | 0 (0.0%) | 7 (100.0%) |
| Enterprise Management | 0 (0.0%) | 0 (0.0%) |
| Administrative & Support | 7 (70.0%) | 3 (30.0%) |
| Educational Services | 6 (11.1%) | 48 (88.9%) |
| Health Care & Social Assistance | 33 (30.6%) | 75 (69.4%) |
| Arts, Entertainment & Recreation | 0 (0.0%) | 1 (100.0%) |
| Accommodation & Food Services | 8 (53.3%) | 7 (46.7%) |
| Public Administration | 38 (100.0%) | 0 (0.0%) |
| Total | 300 (59.5%) | 204 (40.5%) |
Education in Ranchester
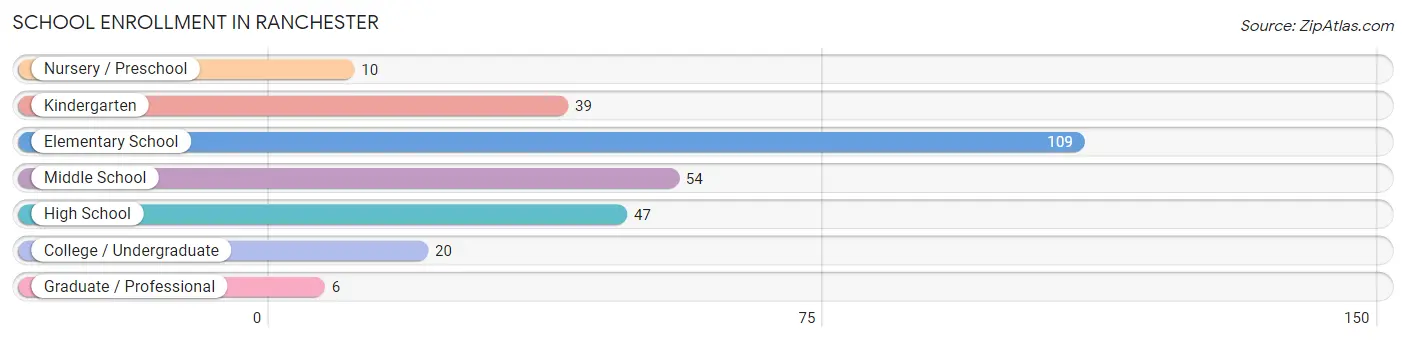
School Enrollment in Ranchester
The most common levels of schooling among the 285 students in Ranchester are elementary school (109 | 38.3%), middle school (54 | 19.0%), and high school (47 | 16.5%).
| School Level | # Students | % Students |
| Nursery / Preschool | 10 | 3.5% |
| Kindergarten | 39 | 13.7% |
| Elementary School | 109 | 38.3% |
| Middle School | 54 | 19.0% |
| High School | 47 | 16.5% |
| College / Undergraduate | 20 | 7.0% |
| Graduate / Professional | 6 | 2.1% |
| Total | 285 | 100.0% |
School Enrollment by Age by Funding Source in Ranchester
Out of a total of 285 students who are enrolled in schools in Ranchester, 14 (4.9%) attend a private institution, while the remaining 271 (95.1%) are enrolled in public schools. The age group of 35 years and over has the highest likelihood of being enrolled in private schools, with 6 (46.2% in the age bracket) enrolled. Conversely, the age group of 3 to 4 year olds has the lowest likelihood of being enrolled in a private school, with 10 (100.0% in the age bracket) attending a public institution.
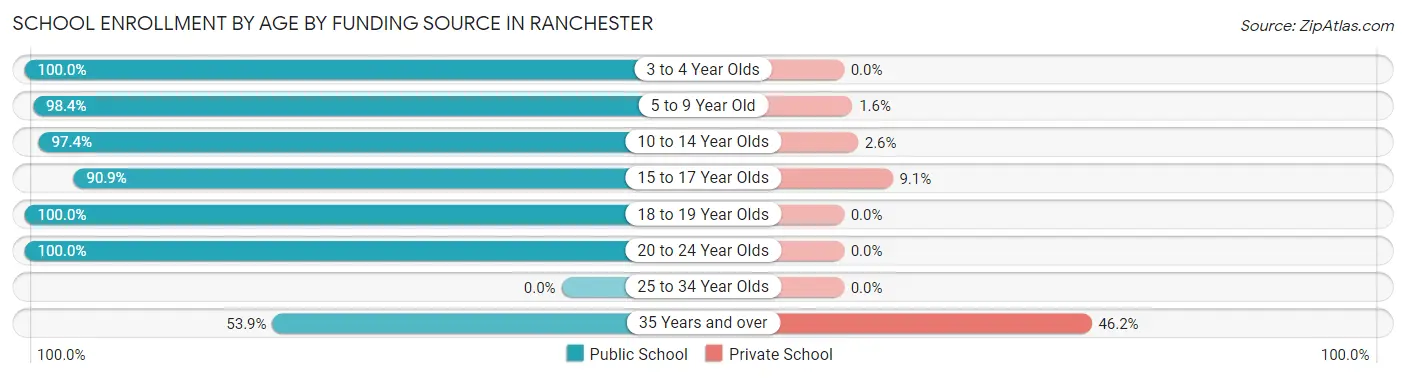
| Age Bracket | Public School | Private School |
| 3 to 4 Year Olds | 10 (100.0%) | 0 (0.0%) |
| 5 to 9 Year Old | 124 (98.4%) | 2 (1.6%) |
| 10 to 14 Year Olds | 74 (97.4%) | 2 (2.6%) |
| 15 to 17 Year Olds | 40 (90.9%) | 4 (9.1%) |
| 18 to 19 Year Olds | 8 (100.0%) | 0 (0.0%) |
| 20 to 24 Year Olds | 8 (100.0%) | 0 (0.0%) |
| 25 to 34 Year Olds | 0 (0.0%) | 0 (0.0%) |
| 35 Years and over | 7 (53.8%) | 6 (46.2%) |
| Total | 271 (95.1%) | 14 (4.9%) |
Educational Attainment by Field of Study in Ranchester
Social sciences (52 | 28.7%), education (30 | 16.6%), arts & humanities (27 | 14.9%), science & technology (25 | 13.8%), and business (14 | 7.7%) are the most common fields of study among 181 individuals in Ranchester who have obtained a bachelor's degree or higher.
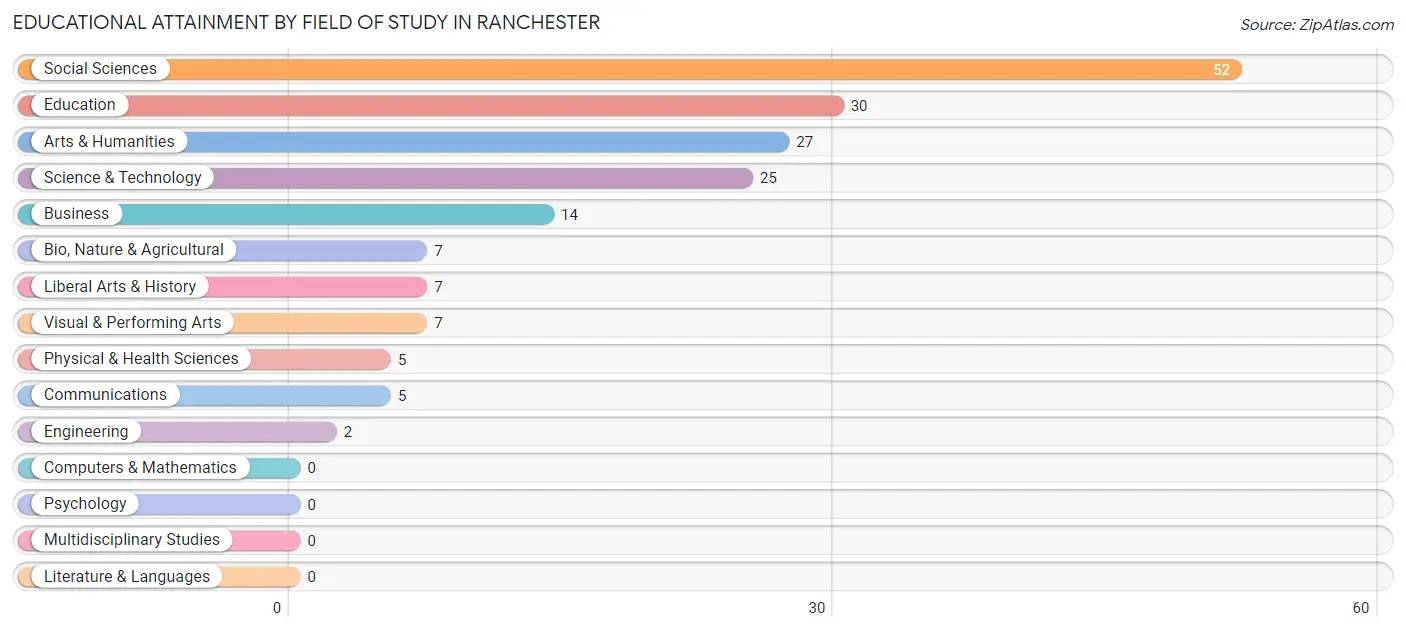
| Field of Study | # Graduates | % Graduates |
| Computers & Mathematics | 0 | 0.0% |
| Bio, Nature & Agricultural | 7 | 3.9% |
| Physical & Health Sciences | 5 | 2.8% |
| Psychology | 0 | 0.0% |
| Social Sciences | 52 | 28.7% |
| Engineering | 2 | 1.1% |
| Multidisciplinary Studies | 0 | 0.0% |
| Science & Technology | 25 | 13.8% |
| Business | 14 | 7.7% |
| Education | 30 | 16.6% |
| Literature & Languages | 0 | 0.0% |
| Liberal Arts & History | 7 | 3.9% |
| Visual & Performing Arts | 7 | 3.9% |
| Communications | 5 | 2.8% |
| Arts & Humanities | 27 | 14.9% |
| Total | 181 | 100.0% |
Transportation & Commute in Ranchester
Vehicle Availability by Sex in Ranchester
The most prevalent vehicle ownership categories in Ranchester are males with 3 vehicles (90, accounting for 30.2%) and females with 3 vehicles (40, making up 44.6%).
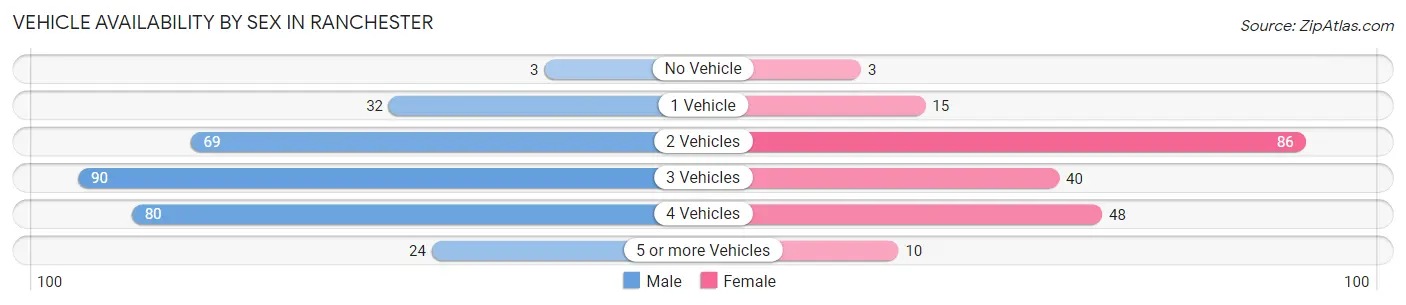
| Vehicles Available | Male | Female |
| No Vehicle | 3 (1.0%) | 3 (1.5%) |
| 1 Vehicle | 32 (10.7%) | 15 (7.4%) |
| 2 Vehicles | 69 (23.2%) | 86 (42.6%) |
| 3 Vehicles | 90 (30.2%) | 40 (19.8%) |
| 4 Vehicles | 80 (26.9%) | 48 (23.8%) |
| 5 or more Vehicles | 24 (8.1%) | 10 (5.0%) |
| Total | 298 (100.0%) | 202 (100.0%) |
Commute Time in Ranchester
The most frequently occuring commute durations in Ranchester are 20 to 24 minutes (207 commuters, 46.5%), 25 to 29 minutes (59 commuters, 13.3%), and 60 to 89 minutes (45 commuters, 10.1%).
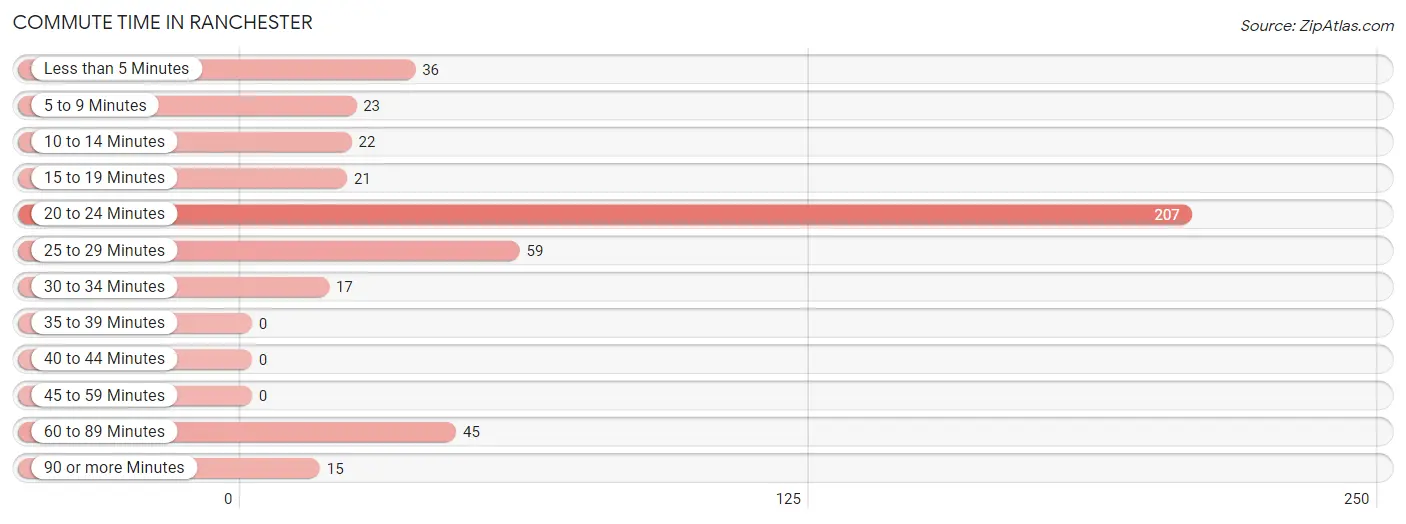
| Commute Time | # Commuters | % Commuters |
| Less than 5 Minutes | 36 | 8.1% |
| 5 to 9 Minutes | 23 | 5.2% |
| 10 to 14 Minutes | 22 | 4.9% |
| 15 to 19 Minutes | 21 | 4.7% |
| 20 to 24 Minutes | 207 | 46.5% |
| 25 to 29 Minutes | 59 | 13.3% |
| 30 to 34 Minutes | 17 | 3.8% |
| 35 to 39 Minutes | 0 | 0.0% |
| 40 to 44 Minutes | 0 | 0.0% |
| 45 to 59 Minutes | 0 | 0.0% |
| 60 to 89 Minutes | 45 | 10.1% |
| 90 or more Minutes | 15 | 3.4% |
Commute Time by Sex in Ranchester
The most common commute times in Ranchester are 20 to 24 minutes (103 commuters, 39.5%) for males and 20 to 24 minutes (104 commuters, 56.5%) for females.
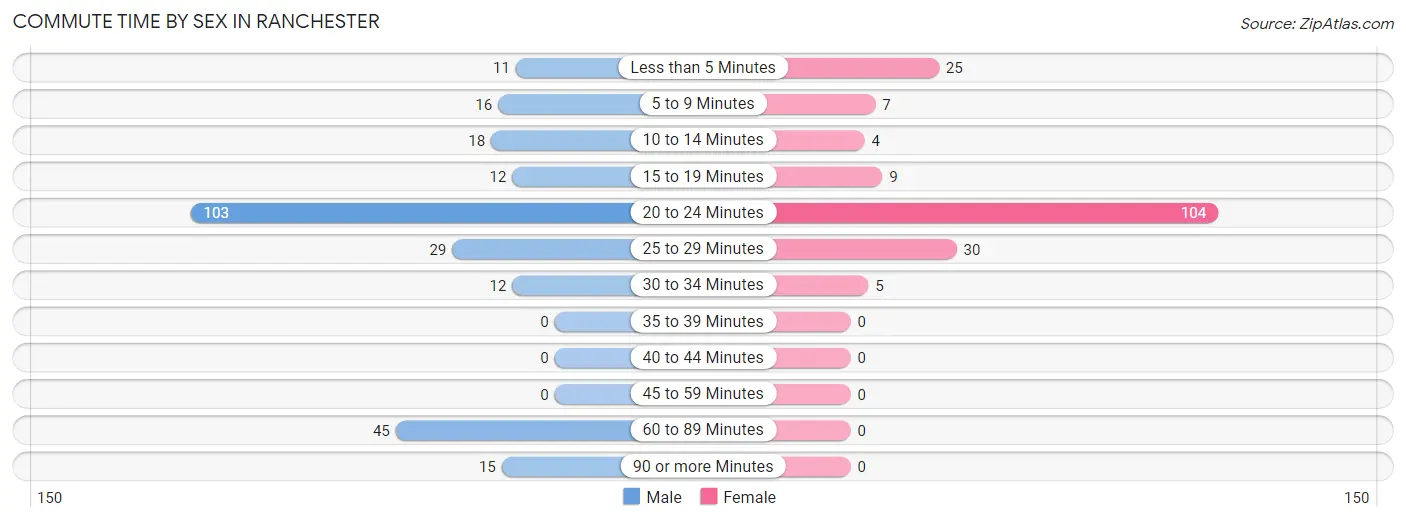
| Commute Time | Male | Female |
| Less than 5 Minutes | 11 (4.2%) | 25 (13.6%) |
| 5 to 9 Minutes | 16 (6.1%) | 7 (3.8%) |
| 10 to 14 Minutes | 18 (6.9%) | 4 (2.2%) |
| 15 to 19 Minutes | 12 (4.6%) | 9 (4.9%) |
| 20 to 24 Minutes | 103 (39.5%) | 104 (56.5%) |
| 25 to 29 Minutes | 29 (11.1%) | 30 (16.3%) |
| 30 to 34 Minutes | 12 (4.6%) | 5 (2.7%) |
| 35 to 39 Minutes | 0 (0.0%) | 0 (0.0%) |
| 40 to 44 Minutes | 0 (0.0%) | 0 (0.0%) |
| 45 to 59 Minutes | 0 (0.0%) | 0 (0.0%) |
| 60 to 89 Minutes | 45 (17.2%) | 0 (0.0%) |
| 90 or more Minutes | 15 (5.8%) | 0 (0.0%) |
Time of Departure to Work by Sex in Ranchester
The most frequent times of departure to work in Ranchester are 7:00 AM to 7:29 AM (83, 31.8%) for males and 7:30 AM to 7:59 AM (39, 21.2%) for females.
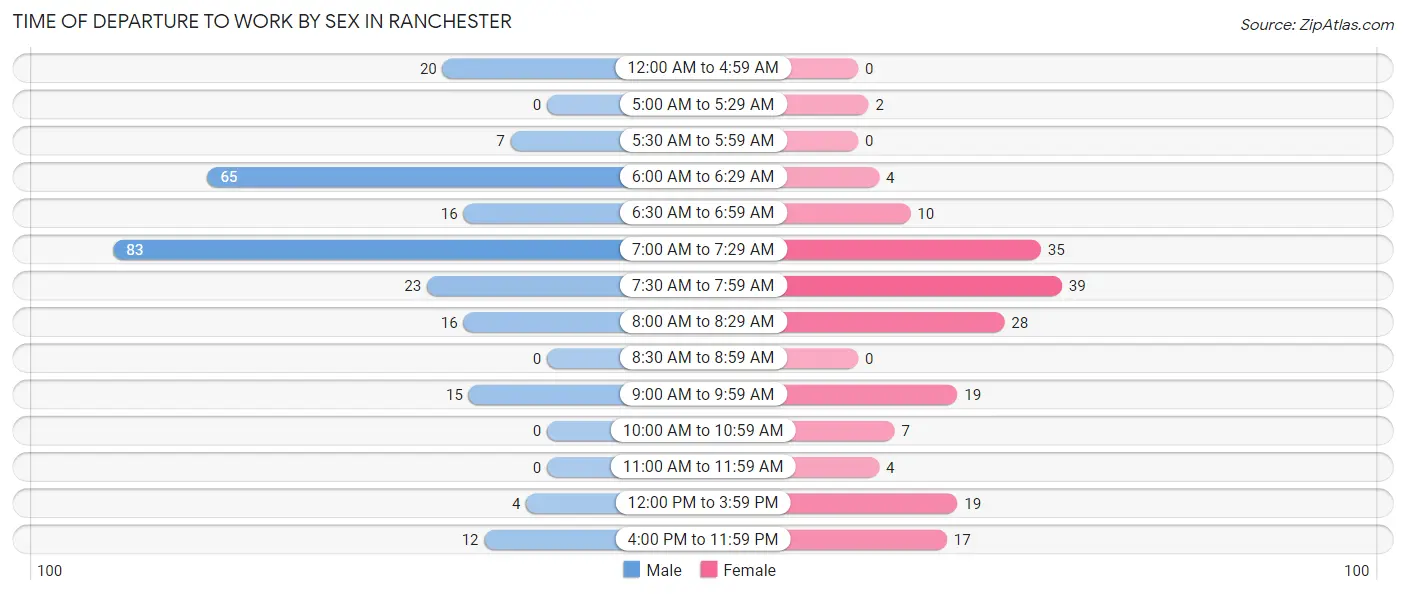
| Time of Departure | Male | Female |
| 12:00 AM to 4:59 AM | 20 (7.7%) | 0 (0.0%) |
| 5:00 AM to 5:29 AM | 0 (0.0%) | 2 (1.1%) |
| 5:30 AM to 5:59 AM | 7 (2.7%) | 0 (0.0%) |
| 6:00 AM to 6:29 AM | 65 (24.9%) | 4 (2.2%) |
| 6:30 AM to 6:59 AM | 16 (6.1%) | 10 (5.4%) |
| 7:00 AM to 7:29 AM | 83 (31.8%) | 35 (19.0%) |
| 7:30 AM to 7:59 AM | 23 (8.8%) | 39 (21.2%) |
| 8:00 AM to 8:29 AM | 16 (6.1%) | 28 (15.2%) |
| 8:30 AM to 8:59 AM | 0 (0.0%) | 0 (0.0%) |
| 9:00 AM to 9:59 AM | 15 (5.8%) | 19 (10.3%) |
| 10:00 AM to 10:59 AM | 0 (0.0%) | 7 (3.8%) |
| 11:00 AM to 11:59 AM | 0 (0.0%) | 4 (2.2%) |
| 12:00 PM to 3:59 PM | 4 (1.5%) | 19 (10.3%) |
| 4:00 PM to 11:59 PM | 12 (4.6%) | 17 (9.2%) |
| Total | 261 (100.0%) | 184 (100.0%) |
Housing Occupancy in Ranchester
Occupancy by Ownership in Ranchester
Of the total 327 dwellings in Ranchester, owner-occupied units account for 270 (82.6%), while renter-occupied units make up 57 (17.4%).
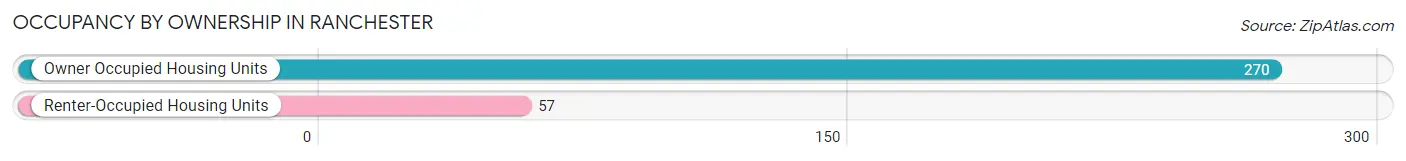
| Occupancy | # Housing Units | % Housing Units |
| Owner Occupied Housing Units | 270 | 82.6% |
| Renter-Occupied Housing Units | 57 | 17.4% |
| Total Occupied Housing Units | 327 | 100.0% |
Occupancy by Household Size in Ranchester
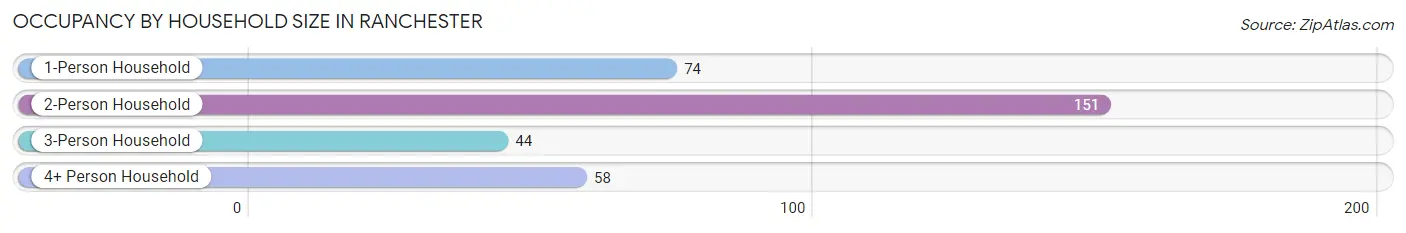
| Household Size | # Housing Units | % Housing Units |
| 1-Person Household | 74 | 22.6% |
| 2-Person Household | 151 | 46.2% |
| 3-Person Household | 44 | 13.5% |
| 4+ Person Household | 58 | 17.7% |
| Total Housing Units | 327 | 100.0% |
Occupancy by Ownership by Household Size in Ranchester
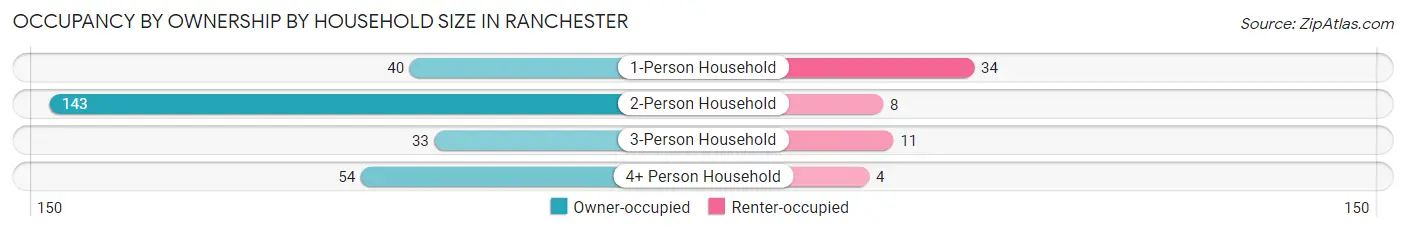
| Household Size | Owner-occupied | Renter-occupied |
| 1-Person Household | 40 (54.0%) | 34 (46.0%) |
| 2-Person Household | 143 (94.7%) | 8 (5.3%) |
| 3-Person Household | 33 (75.0%) | 11 (25.0%) |
| 4+ Person Household | 54 (93.1%) | 4 (6.9%) |
| Total Housing Units | 270 (82.6%) | 57 (17.4%) |
Occupancy by Educational Attainment in Ranchester
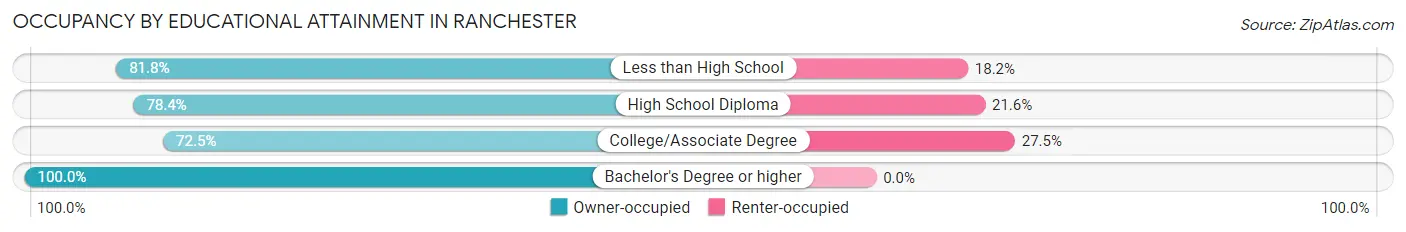
| Household Size | Owner-occupied | Renter-occupied |
| Less than High School | 9 (81.8%) | 2 (18.2%) |
| High School Diploma | 69 (78.4%) | 19 (21.6%) |
| College/Associate Degree | 95 (72.5%) | 36 (27.5%) |
| Bachelor's Degree or higher | 97 (100.0%) | 0 (0.0%) |
Occupancy by Age of Householder in Ranchester
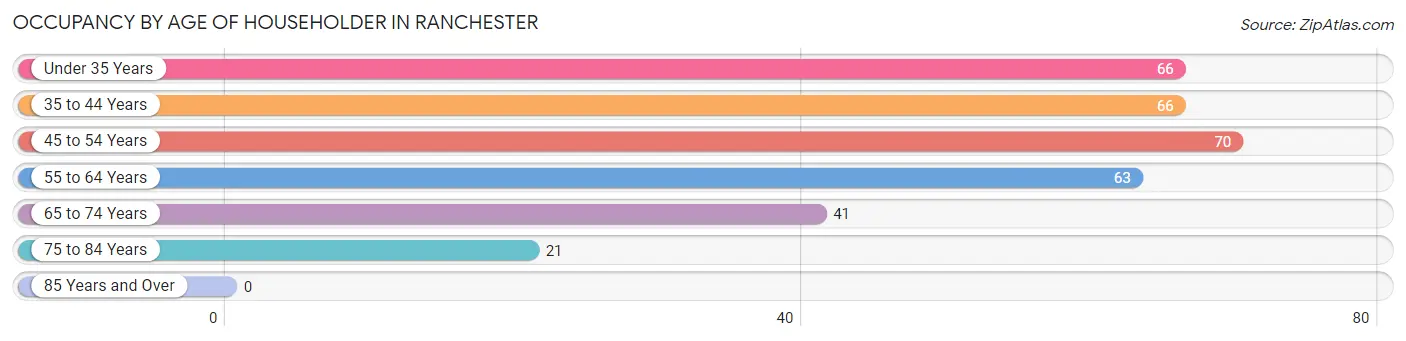
| Age Bracket | # Households | % Households |
| Under 35 Years | 66 | 20.2% |
| 35 to 44 Years | 66 | 20.2% |
| 45 to 54 Years | 70 | 21.4% |
| 55 to 64 Years | 63 | 19.3% |
| 65 to 74 Years | 41 | 12.5% |
| 75 to 84 Years | 21 | 6.4% |
| 85 Years and Over | 0 | 0.0% |
| Total | 327 | 100.0% |
Housing Finances in Ranchester
Median Income by Occupancy in Ranchester
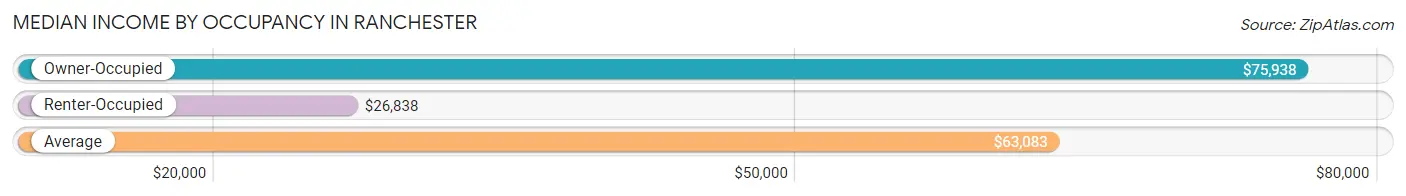
| Occupancy Type | # Households | Median Income |
| Owner-Occupied | 270 (82.6%) | $75,938 |
| Renter-Occupied | 57 (17.4%) | $26,838 |
| Average | 327 (100.0%) | $63,083 |
Occupancy by Householder Income Bracket in Ranchester
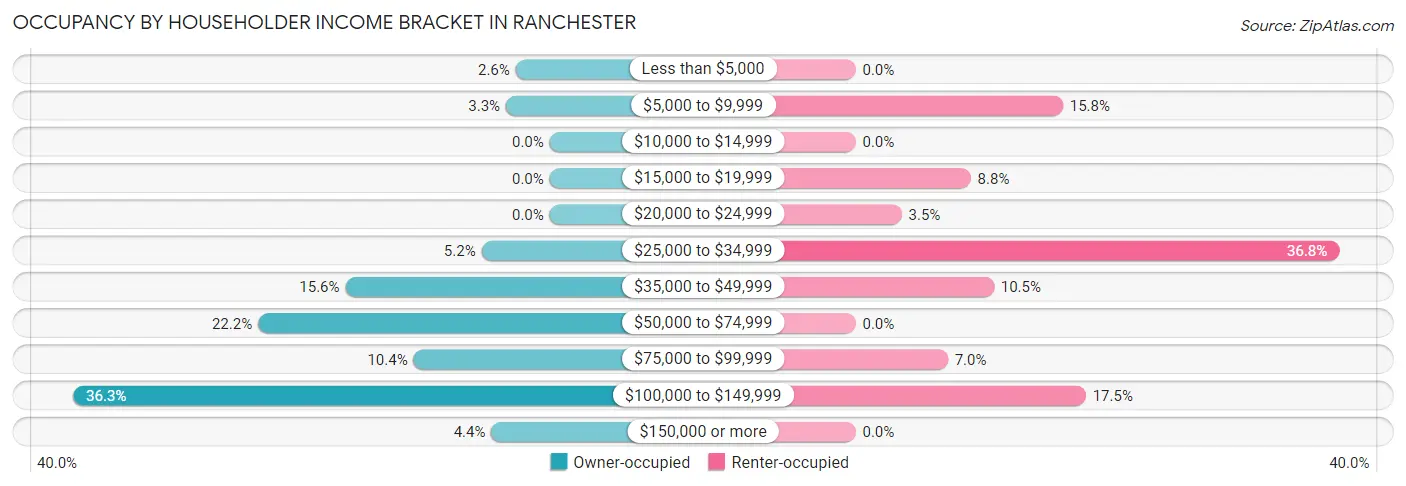
| Income Bracket | Owner-occupied | Renter-occupied |
| Less than $5,000 | 7 (2.6%) | 0 (0.0%) |
| $5,000 to $9,999 | 9 (3.3%) | 9 (15.8%) |
| $10,000 to $14,999 | 0 (0.0%) | 0 (0.0%) |
| $15,000 to $19,999 | 0 (0.0%) | 5 (8.8%) |
| $20,000 to $24,999 | 0 (0.0%) | 2 (3.5%) |
| $25,000 to $34,999 | 14 (5.2%) | 21 (36.8%) |
| $35,000 to $49,999 | 42 (15.6%) | 6 (10.5%) |
| $50,000 to $74,999 | 60 (22.2%) | 0 (0.0%) |
| $75,000 to $99,999 | 28 (10.4%) | 4 (7.0%) |
| $100,000 to $149,999 | 98 (36.3%) | 10 (17.5%) |
| $150,000 or more | 12 (4.4%) | 0 (0.0%) |
| Total | 270 (100.0%) | 57 (100.0%) |
Monthly Housing Cost Tiers in Ranchester
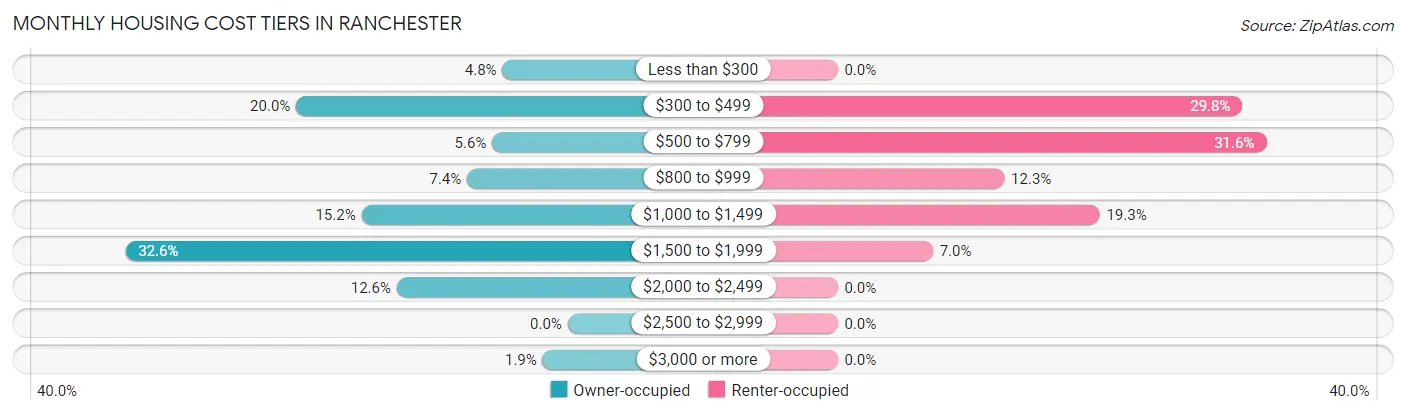
| Monthly Cost | Owner-occupied | Renter-occupied |
| Less than $300 | 13 (4.8%) | 0 (0.0%) |
| $300 to $499 | 54 (20.0%) | 17 (29.8%) |
| $500 to $799 | 15 (5.6%) | 18 (31.6%) |
| $800 to $999 | 20 (7.4%) | 7 (12.3%) |
| $1,000 to $1,499 | 41 (15.2%) | 11 (19.3%) |
| $1,500 to $1,999 | 88 (32.6%) | 4 (7.0%) |
| $2,000 to $2,499 | 34 (12.6%) | 0 (0.0%) |
| $2,500 to $2,999 | 0 (0.0%) | 0 (0.0%) |
| $3,000 or more | 5 (1.8%) | 0 (0.0%) |
| Total | 270 (100.0%) | 57 (100.0%) |
Physical Housing Characteristics in Ranchester
Housing Structures in Ranchester
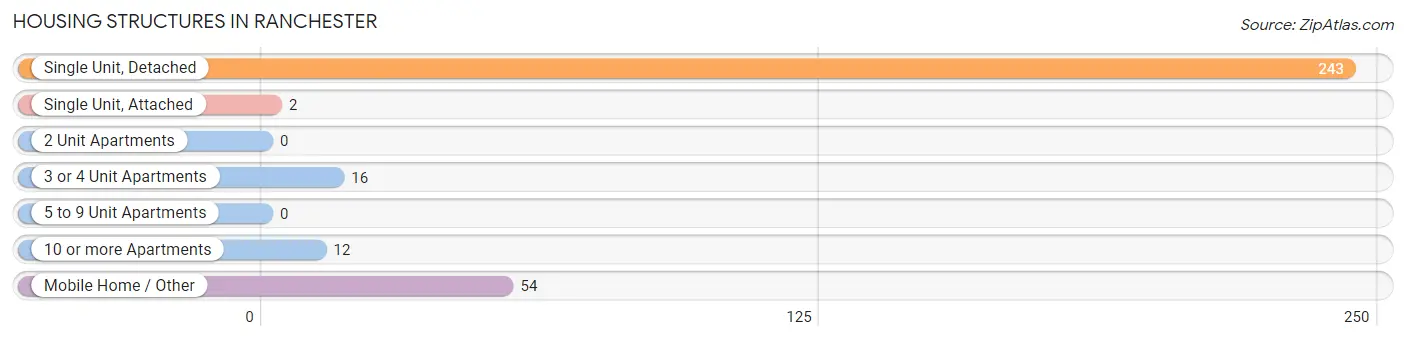
| Structure Type | # Housing Units | % Housing Units |
| Single Unit, Detached | 243 | 74.3% |
| Single Unit, Attached | 2 | 0.6% |
| 2 Unit Apartments | 0 | 0.0% |
| 3 or 4 Unit Apartments | 16 | 4.9% |
| 5 to 9 Unit Apartments | 0 | 0.0% |
| 10 or more Apartments | 12 | 3.7% |
| Mobile Home / Other | 54 | 16.5% |
| Total | 327 | 100.0% |
Housing Structures by Occupancy in Ranchester
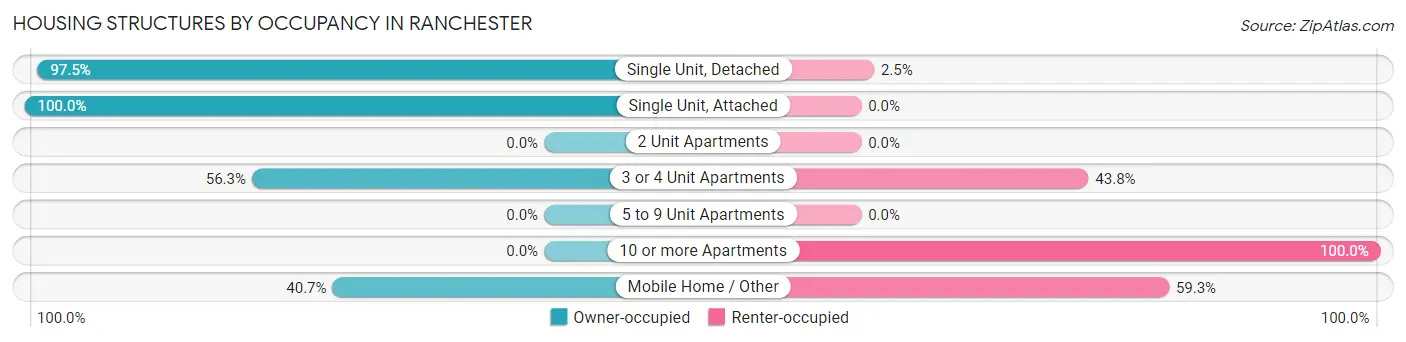
| Structure Type | Owner-occupied | Renter-occupied |
| Single Unit, Detached | 237 (97.5%) | 6 (2.5%) |
| Single Unit, Attached | 2 (100.0%) | 0 (0.0%) |
| 2 Unit Apartments | 0 (0.0%) | 0 (0.0%) |
| 3 or 4 Unit Apartments | 9 (56.2%) | 7 (43.8%) |
| 5 to 9 Unit Apartments | 0 (0.0%) | 0 (0.0%) |
| 10 or more Apartments | 0 (0.0%) | 12 (100.0%) |
| Mobile Home / Other | 22 (40.7%) | 32 (59.3%) |
| Total | 270 (82.6%) | 57 (17.4%) |
Housing Structures by Number of Rooms in Ranchester
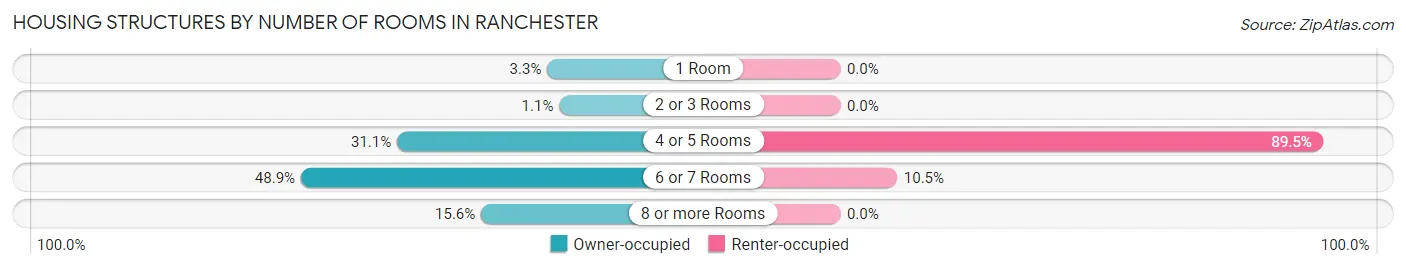
| Number of Rooms | Owner-occupied | Renter-occupied |
| 1 Room | 9 (3.3%) | 0 (0.0%) |
| 2 or 3 Rooms | 3 (1.1%) | 0 (0.0%) |
| 4 or 5 Rooms | 84 (31.1%) | 51 (89.5%) |
| 6 or 7 Rooms | 132 (48.9%) | 6 (10.5%) |
| 8 or more Rooms | 42 (15.6%) | 0 (0.0%) |
| Total | 270 (100.0%) | 57 (100.0%) |
Housing Structure by Heating Type in Ranchester
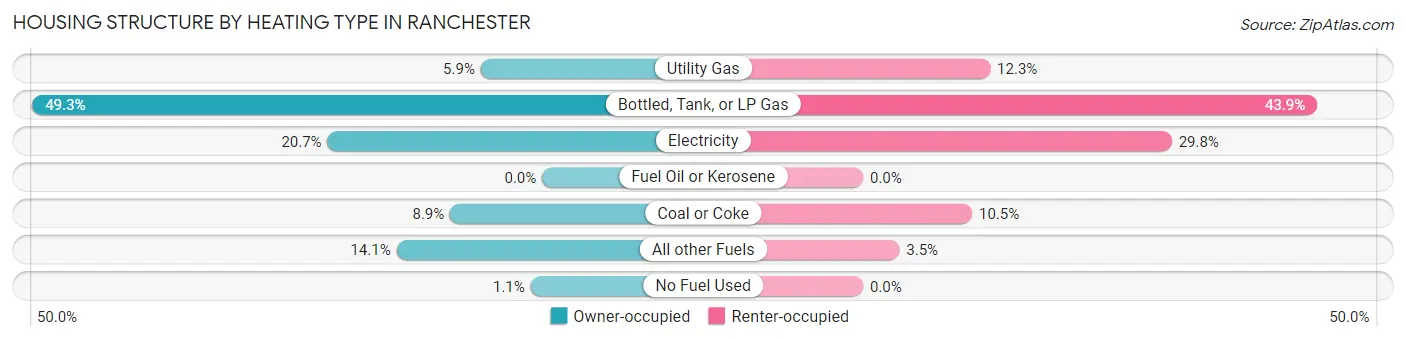
| Heating Type | Owner-occupied | Renter-occupied |
| Utility Gas | 16 (5.9%) | 7 (12.3%) |
| Bottled, Tank, or LP Gas | 133 (49.3%) | 25 (43.9%) |
| Electricity | 56 (20.7%) | 17 (29.8%) |
| Fuel Oil or Kerosene | 0 (0.0%) | 0 (0.0%) |
| Coal or Coke | 24 (8.9%) | 6 (10.5%) |
| All other Fuels | 38 (14.1%) | 2 (3.5%) |
| No Fuel Used | 3 (1.1%) | 0 (0.0%) |
| Total | 270 (100.0%) | 57 (100.0%) |
Household Vehicle Usage in Ranchester
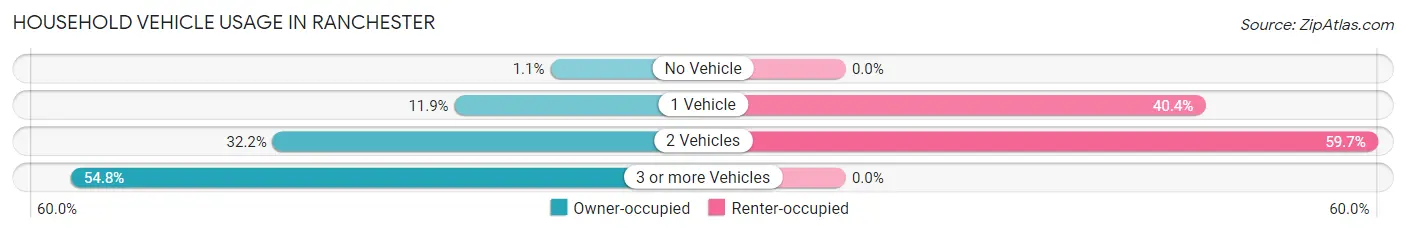
| Vehicles per Household | Owner-occupied | Renter-occupied |
| No Vehicle | 3 (1.1%) | 0 (0.0%) |
| 1 Vehicle | 32 (11.8%) | 23 (40.4%) |
| 2 Vehicles | 87 (32.2%) | 34 (59.7%) |
| 3 or more Vehicles | 148 (54.8%) | 0 (0.0%) |
| Total | 270 (100.0%) | 57 (100.0%) |
Real Estate & Mortgages in Ranchester
Real Estate and Mortgage Overview in Ranchester
| Characteristic | Without Mortgage | With Mortgage |
| Housing Units | 87 | 183 |
| Median Property Value | $191,300 | $278,500 |
| Median Household Income | $59,063 | $10 |
| Monthly Housing Costs | $429 | $5 |
| Real Estate Taxes | $1,267 | $0 |
Property Value by Mortgage Status in Ranchester
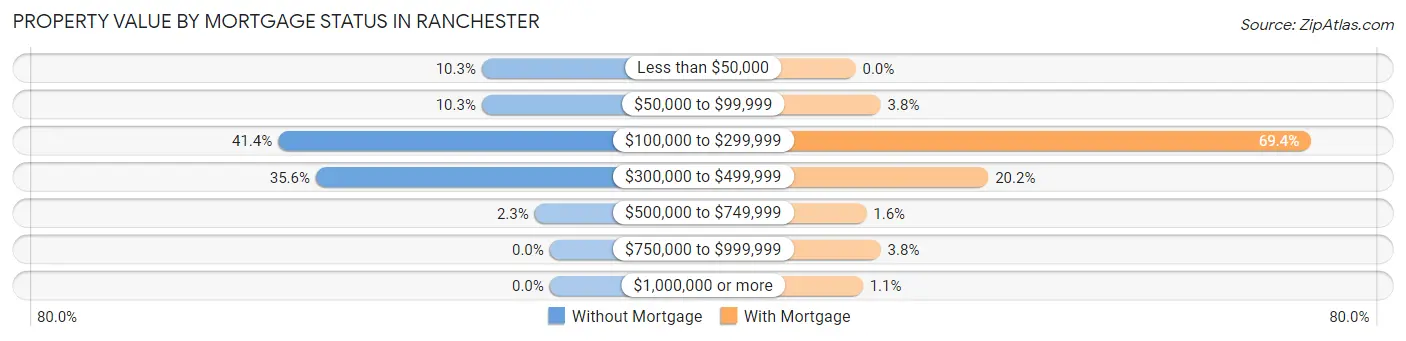
| Property Value | Without Mortgage | With Mortgage |
| Less than $50,000 | 9 (10.3%) | 0 (0.0%) |
| $50,000 to $99,999 | 9 (10.3%) | 7 (3.8%) |
| $100,000 to $299,999 | 36 (41.4%) | 127 (69.4%) |
| $300,000 to $499,999 | 31 (35.6%) | 37 (20.2%) |
| $500,000 to $749,999 | 2 (2.3%) | 3 (1.6%) |
| $750,000 to $999,999 | 0 (0.0%) | 7 (3.8%) |
| $1,000,000 or more | 0 (0.0%) | 2 (1.1%) |
| Total | 87 (100.0%) | 183 (100.0%) |
Household Income by Mortgage Status in Ranchester
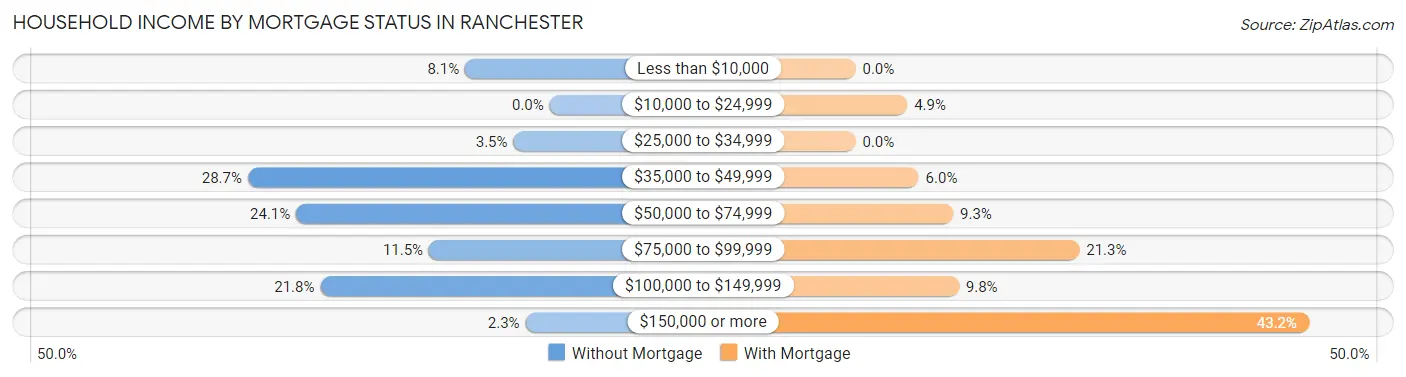
| Household Income | Without Mortgage | With Mortgage |
| Less than $10,000 | 7 (8.1%) | 0 (0.0%) |
| $10,000 to $24,999 | 0 (0.0%) | 9 (4.9%) |
| $25,000 to $34,999 | 3 (3.5%) | 0 (0.0%) |
| $35,000 to $49,999 | 25 (28.7%) | 11 (6.0%) |
| $50,000 to $74,999 | 21 (24.1%) | 17 (9.3%) |
| $75,000 to $99,999 | 10 (11.5%) | 39 (21.3%) |
| $100,000 to $149,999 | 19 (21.8%) | 18 (9.8%) |
| $150,000 or more | 2 (2.3%) | 79 (43.2%) |
| Total | 87 (100.0%) | 183 (100.0%) |
Property Value to Household Income Ratio in Ranchester
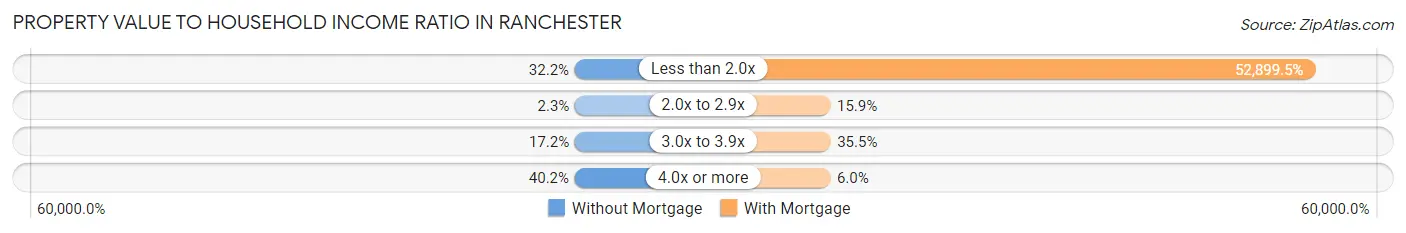
| Value-to-Income Ratio | Without Mortgage | With Mortgage |
| Less than 2.0x | 28 (32.2%) | 96,806 (52,899.5%) |
| 2.0x to 2.9x | 2 (2.3%) | 29 (15.9%) |
| 3.0x to 3.9x | 15 (17.2%) | 65 (35.5%) |
| 4.0x or more | 35 (40.2%) | 11 (6.0%) |
| Total | 87 (100.0%) | 183 (100.0%) |
Real Estate Taxes by Mortgage Status in Ranchester
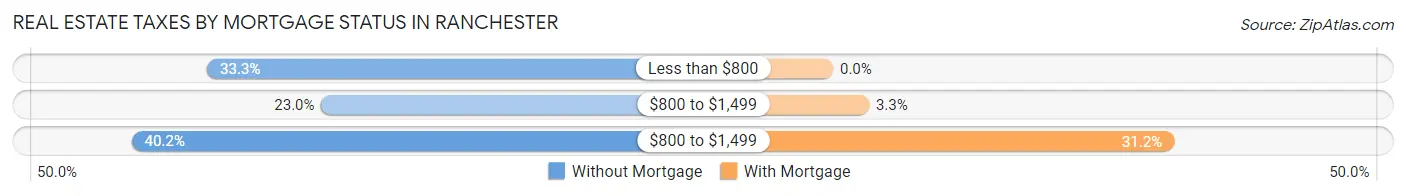
| Property Taxes | Without Mortgage | With Mortgage |
| Less than $800 | 29 (33.3%) | 0 (0.0%) |
| $800 to $1,499 | 20 (23.0%) | 6 (3.3%) |
| $800 to $1,499 | 35 (40.2%) | 57 (31.1%) |
| Total | 87 (100.0%) | 183 (100.0%) |
Health & Disability in Ranchester
Health Insurance Coverage by Age in Ranchester
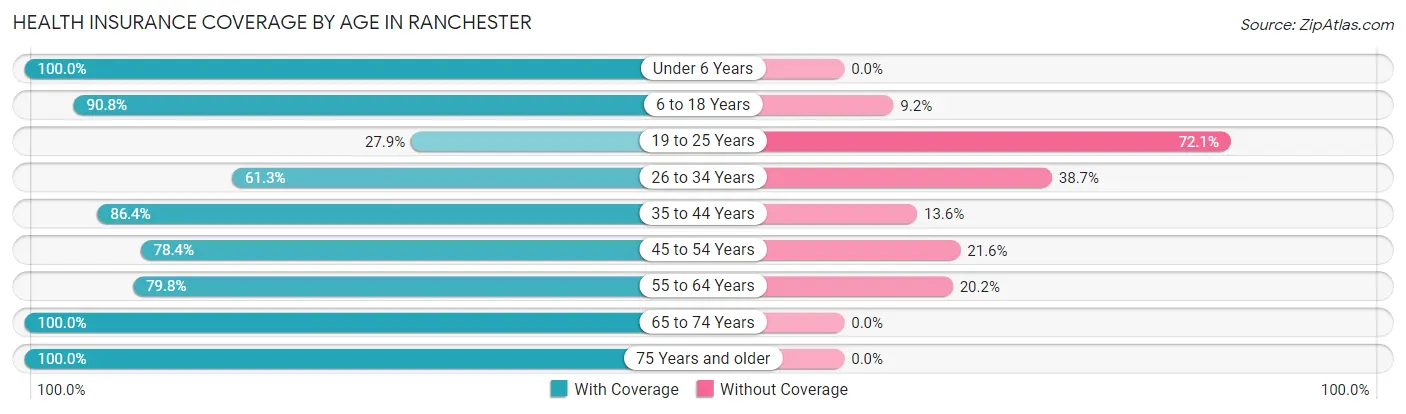
| Age Bracket | With Coverage | Without Coverage |
| Under 6 Years | 76 (100.0%) | 0 (0.0%) |
| 6 to 18 Years | 238 (90.8%) | 24 (9.2%) |
| 19 to 25 Years | 19 (27.9%) | 49 (72.1%) |
| 26 to 34 Years | 76 (61.3%) | 48 (38.7%) |
| 35 to 44 Years | 102 (86.4%) | 16 (13.6%) |
| 45 to 54 Years | 105 (78.4%) | 29 (21.6%) |
| 55 to 64 Years | 71 (79.8%) | 18 (20.2%) |
| 65 to 74 Years | 68 (100.0%) | 0 (0.0%) |
| 75 Years and older | 28 (100.0%) | 0 (0.0%) |
| Total | 783 (81.0%) | 184 (19.0%) |
Health Insurance Coverage by Citizenship Status in Ranchester
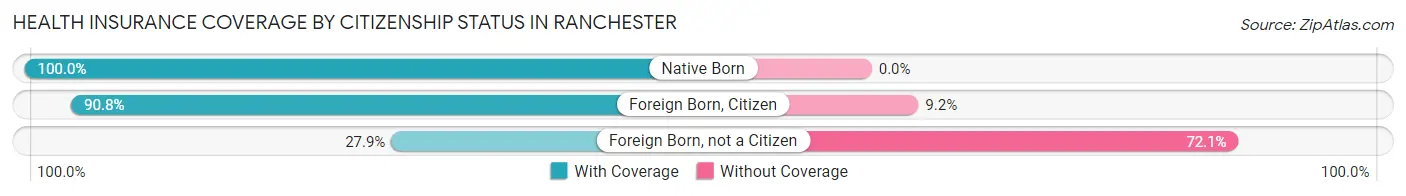
| Citizenship Status | With Coverage | Without Coverage |
| Native Born | 76 (100.0%) | 0 (0.0%) |
| Foreign Born, Citizen | 238 (90.8%) | 24 (9.2%) |
| Foreign Born, not a Citizen | 19 (27.9%) | 49 (72.1%) |
Health Insurance Coverage by Household Income in Ranchester
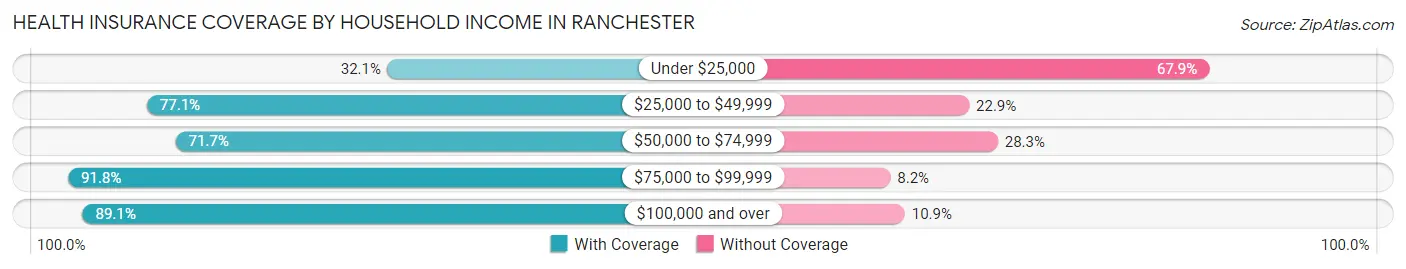
| Household Income | With Coverage | Without Coverage |
| Under $25,000 | 18 (32.1%) | 38 (67.9%) |
| $25,000 to $49,999 | 148 (77.1%) | 44 (22.9%) |
| $50,000 to $74,999 | 109 (71.7%) | 43 (28.3%) |
| $75,000 to $99,999 | 90 (91.8%) | 8 (8.2%) |
| $100,000 and over | 418 (89.1%) | 51 (10.9%) |
Public vs Private Health Insurance Coverage by Age in Ranchester
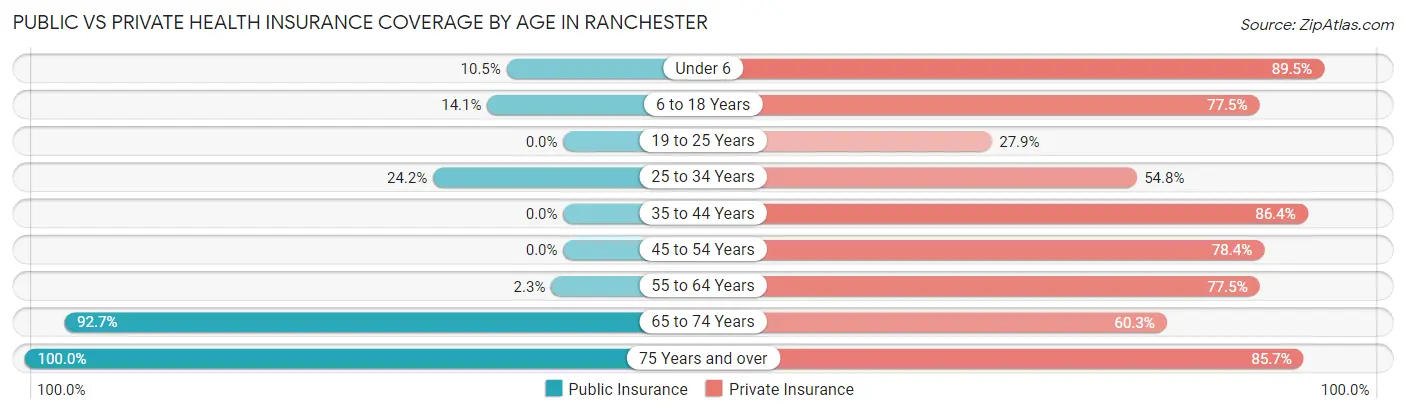
| Age Bracket | Public Insurance | Private Insurance |
| Under 6 | 8 (10.5%) | 68 (89.5%) |
| 6 to 18 Years | 37 (14.1%) | 203 (77.5%) |
| 19 to 25 Years | 0 (0.0%) | 19 (27.9%) |
| 25 to 34 Years | 30 (24.2%) | 68 (54.8%) |
| 35 to 44 Years | 0 (0.0%) | 102 (86.4%) |
| 45 to 54 Years | 0 (0.0%) | 105 (78.4%) |
| 55 to 64 Years | 2 (2.2%) | 69 (77.5%) |
| 65 to 74 Years | 63 (92.6%) | 41 (60.3%) |
| 75 Years and over | 28 (100.0%) | 24 (85.7%) |
| Total | 168 (17.4%) | 699 (72.3%) |
Disability Status by Sex by Age in Ranchester
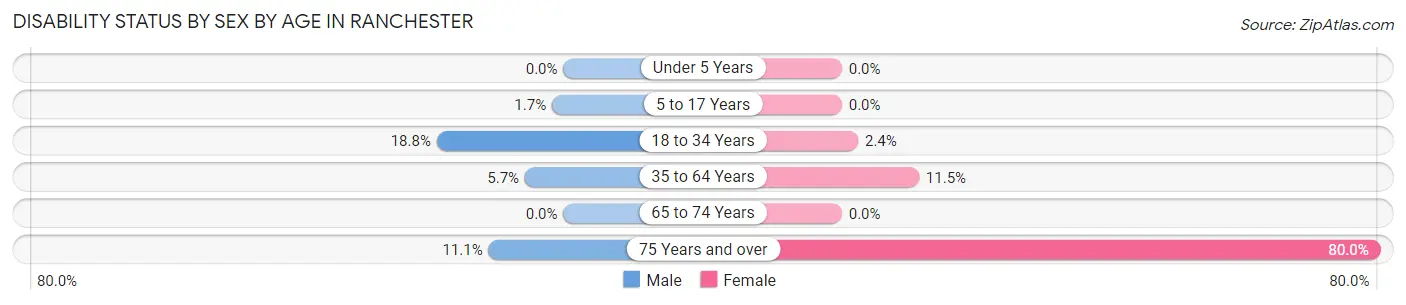
| Age Bracket | Male | Female |
| Under 5 Years | 0 (0.0%) | 0 (0.0%) |
| 5 to 17 Years | 3 (1.7%) | 0 (0.0%) |
| 18 to 34 Years | 22 (18.8%) | 2 (2.4%) |
| 35 to 64 Years | 10 (5.7%) | 19 (11.5%) |
| 65 to 74 Years | 0 (0.0%) | 0 (0.0%) |
| 75 Years and over | 2 (11.1%) | 8 (80.0%) |
Disability Class by Sex by Age in Ranchester
Disability Class: Hearing Difficulty
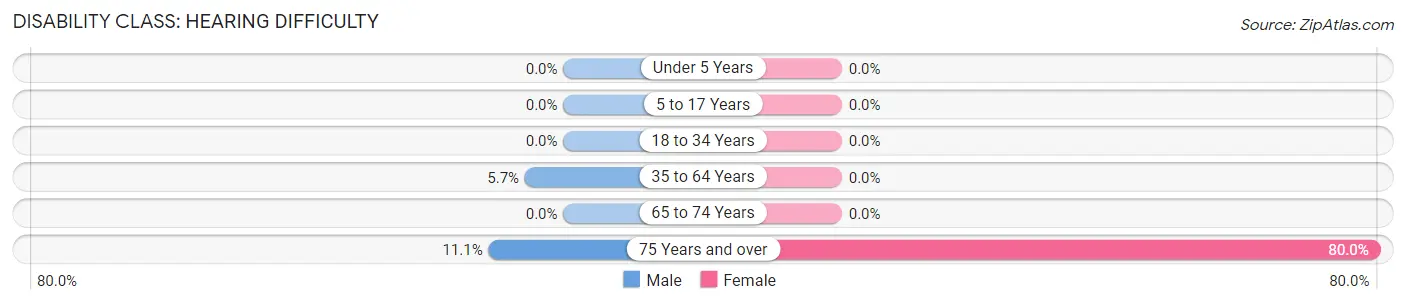
| Age Bracket | Male | Female |
| Under 5 Years | 0 (0.0%) | 0 (0.0%) |
| 5 to 17 Years | 0 (0.0%) | 0 (0.0%) |
| 18 to 34 Years | 0 (0.0%) | 0 (0.0%) |
| 35 to 64 Years | 10 (5.7%) | 0 (0.0%) |
| 65 to 74 Years | 0 (0.0%) | 0 (0.0%) |
| 75 Years and over | 2 (11.1%) | 8 (80.0%) |
Disability Class: Vision Difficulty
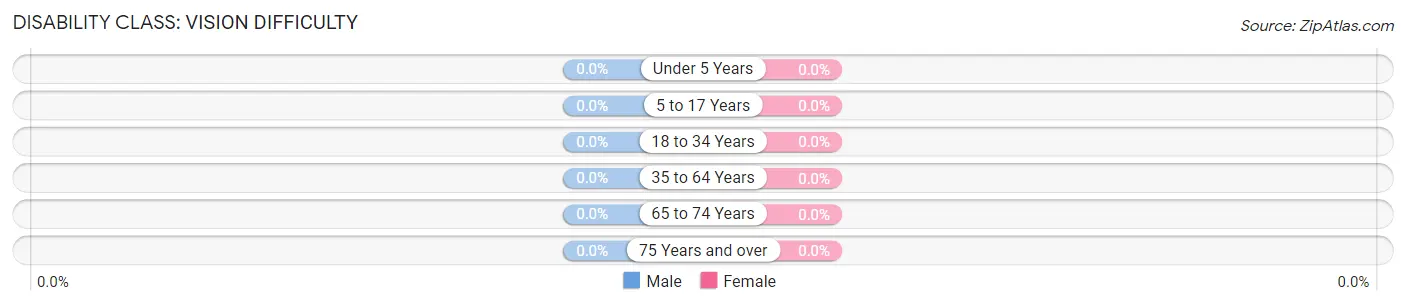
| Age Bracket | Male | Female |
| Under 5 Years | 0 (0.0%) | 0 (0.0%) |
| 5 to 17 Years | 0 (0.0%) | 0 (0.0%) |
| 18 to 34 Years | 0 (0.0%) | 0 (0.0%) |
| 35 to 64 Years | 0 (0.0%) | 0 (0.0%) |
| 65 to 74 Years | 0 (0.0%) | 0 (0.0%) |
| 75 Years and over | 0 (0.0%) | 0 (0.0%) |
Disability Class: Cognitive Difficulty
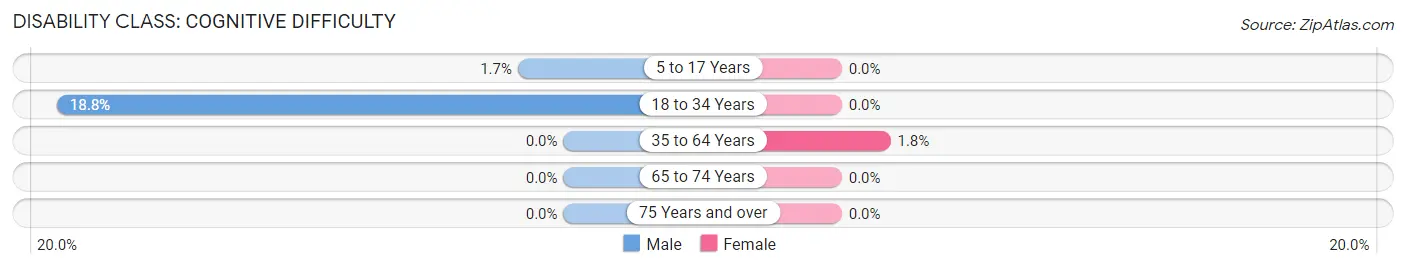
| Age Bracket | Male | Female |
| 5 to 17 Years | 3 (1.7%) | 0 (0.0%) |
| 18 to 34 Years | 22 (18.8%) | 0 (0.0%) |
| 35 to 64 Years | 0 (0.0%) | 3 (1.8%) |
| 65 to 74 Years | 0 (0.0%) | 0 (0.0%) |
| 75 Years and over | 0 (0.0%) | 0 (0.0%) |
Disability Class: Ambulatory Difficulty
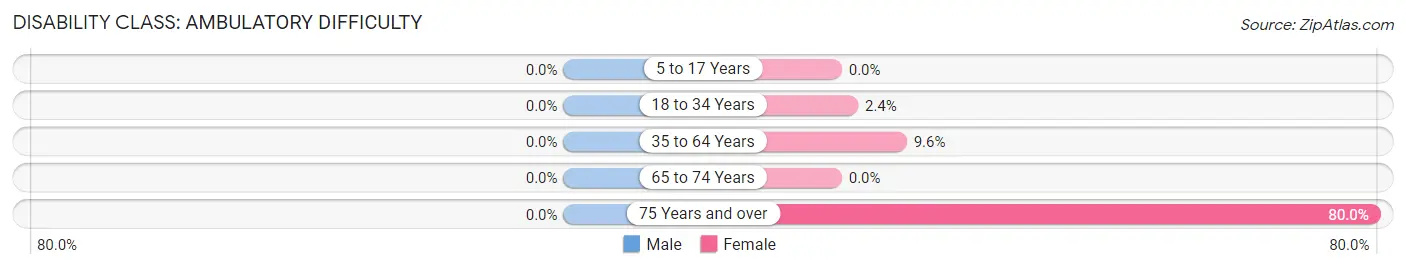
| Age Bracket | Male | Female |
| 5 to 17 Years | 0 (0.0%) | 0 (0.0%) |
| 18 to 34 Years | 0 (0.0%) | 2 (2.4%) |
| 35 to 64 Years | 0 (0.0%) | 16 (9.6%) |
| 65 to 74 Years | 0 (0.0%) | 0 (0.0%) |
| 75 Years and over | 0 (0.0%) | 8 (80.0%) |
Disability Class: Self-Care Difficulty
| Age Bracket | Male | Female |
| 5 to 17 Years | 0 (0.0%) | 0 (0.0%) |
| 18 to 34 Years | 0 (0.0%) | 0 (0.0%) |
| 35 to 64 Years | 0 (0.0%) | 0 (0.0%) |
| 65 to 74 Years | 0 (0.0%) | 0 (0.0%) |
| 75 Years and over | 0 (0.0%) | 0 (0.0%) |
Technology Access in Ranchester
Computing Device Access in Ranchester
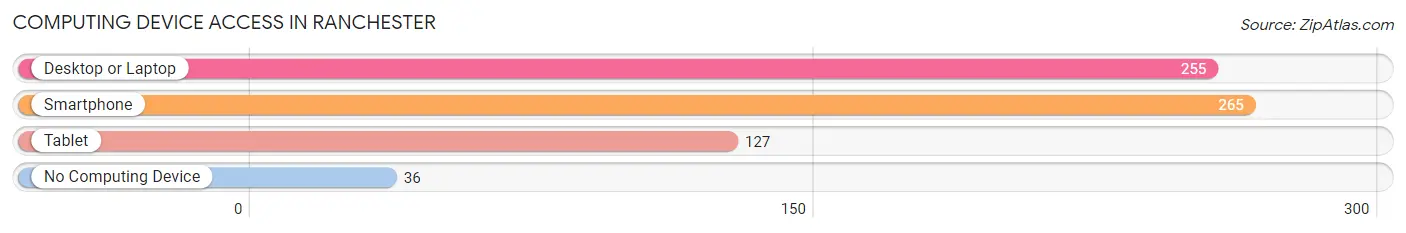
| Device Type | # Households | % Households |
| Desktop or Laptop | 255 | 78.0% |
| Smartphone | 265 | 81.0% |
| Tablet | 127 | 38.8% |
| No Computing Device | 36 | 11.0% |
| Total | 327 | 100.0% |
Internet Access in Ranchester
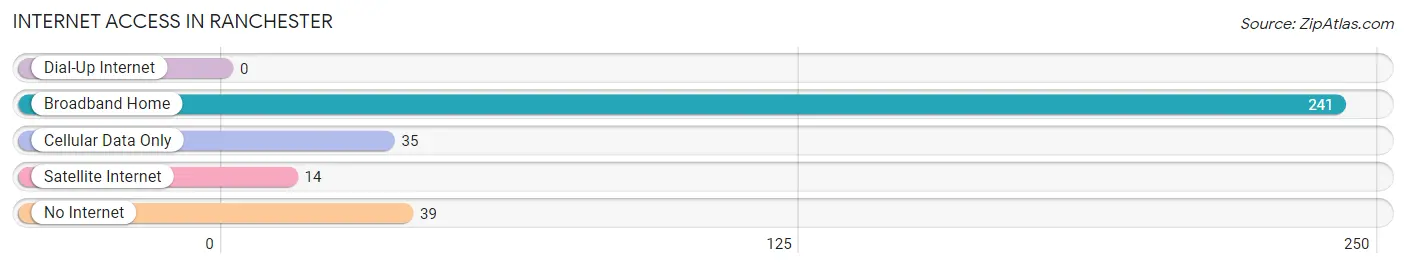
| Internet Type | # Households | % Households |
| Dial-Up Internet | 0 | 0.0% |
| Broadband Home | 241 | 73.7% |
| Cellular Data Only | 35 | 10.7% |
| Satellite Internet | 14 | 4.3% |
| No Internet | 39 | 11.9% |
| Total | 327 | 100.0% |
Ranchester Summary
Ranchester is a small town located in Sheridan County, Wyoming, United States. The town is situated in the foothills of the Bighorn Mountains, approximately 10 miles south of Sheridan. The population of Ranchester was 1,068 at the 2010 census.
History
Ranchester was founded in 1892 by the Union Pacific Railroad. The town was named after a railroad official, R.H. Ranchester. The town was originally a stop on the railroad line, and the railroad was the main source of employment for the town.
In the early 1900s, the town began to grow and develop. The first school was built in 1902, and the first post office was established in 1903. The town also had a bank, a hotel, a newspaper, and several stores.
In the 1920s, the town experienced a period of growth and prosperity. The population increased from 500 to 1,000, and the town had a variety of businesses, including a movie theater, a bowling alley, and a variety of stores.
In the 1950s, the town began to decline. The railroad stopped running through the town, and many of the businesses closed. The population decreased to 500 by the 1970s.
In the 1980s, the town began to experience a resurgence. The population increased to 1,000, and the town began to attract new businesses. The town also began to attract tourists, as it is located near the Bighorn Mountains.
Geography
Ranchester is located in the foothills of the Bighorn Mountains, approximately 10 miles south of Sheridan. The town is situated at an elevation of 4,890 feet.
The town is located in the Big Horn Basin, which is a large, flat area surrounded by mountains. The area is known for its wide open spaces and beautiful scenery.
The climate in Ranchester is semi-arid, with hot summers and cold winters. The average annual temperature is 48°F, and the average annual precipitation is 13.5 inches.
Economy
The economy of Ranchester is largely based on tourism and agriculture. The town is a popular destination for tourists, as it is located near the Bighorn Mountains. The town also has several farms and ranches, which produce a variety of crops and livestock.
The town also has several businesses, including restaurants, stores, and a movie theater. The town also has a bank and a post office.
Demographics
As of the 2010 census, the population of Ranchester was 1,068. The racial makeup of the town was 95.3% White, 0.7% Native American, 0.3% Asian, 0.2% African American, and 3.5% from other races.
The median household income in Ranchester was $41,250, and the median family income was $48,750. The per capita income was $20,945.
Conclusion
Ranchester is a small town located in Sheridan County, Wyoming. The town was founded in 1892 by the Union Pacific Railroad, and it has a long history of growth and decline. The town is now experiencing a resurgence, as it is a popular destination for tourists and has several businesses. The population of Ranchester was 1,068 at the 2010 census, and the town has a diverse economy based on tourism and agriculture.
Common Questions
What is Per Capita Income in Ranchester?
Per Capita income in Ranchester is $28,502.
What is the Median Family Income in Ranchester?
Median Family Income in Ranchester is $76,094.
What is the Median Household income in Ranchester?
Median Household Income in Ranchester is $63,083.
What is Income or Wage Gap in Ranchester?
Income or Wage Gap in Ranchester is 37.3%.
Women in Ranchester earn 62.7 cents for every dollar earned by a man.
What is Family Income Deficit in Ranchester?
Family Income Deficit in Ranchester is $11,538.
Families that are below poverty line in Ranchester earn $11,538 less on average than the poverty threshold level.
What is Inequality or Gini Index in Ranchester?
Inequality or Gini Index in Ranchester is 0.35.
What is the Total Population of Ranchester?
Total Population of Ranchester is 967.
What is the Total Male Population of Ranchester?
Total Male Population of Ranchester is 537.
What is the Total Female Population of Ranchester?
Total Female Population of Ranchester is 430.
What is the Ratio of Males per 100 Females in Ranchester?
There are 124.88 Males per 100 Females in Ranchester.
What is the Ratio of Females per 100 Males in Ranchester?
There are 80.07 Females per 100 Males in Ranchester.
What is the Median Population Age in Ranchester?
Median Population Age in Ranchester is 34.2 Years.
What is the Average Family Size in Ranchester
Average Family Size in Ranchester is 3.5 People.
What is the Average Household Size in Ranchester
Average Household Size in Ranchester is 3.0 People.
How Large is the Labor Force in Ranchester?
There are 512 People in the Labor Forcein in Ranchester.
What is the Percentage of People in the Labor Force in Ranchester?
75.7% of People are in the Labor Force in Ranchester.
What is the Unemployment Rate in Ranchester?
Unemployment Rate in Ranchester is 1.6%.