Mountain View, WY Map & Demographics
Mountain View Map
Mountain View Overview
$32,711
PER CAPITA INCOME
$90,272
AVG FAMILY INCOME
$69,514
AVG HOUSEHOLD INCOME
51.3%
WAGE / INCOME GAP [ % ]
48.7¢/ $1
WAGE / INCOME GAP [ $ ]
0.37
INEQUALITY / GINI INDEX
1,114
TOTAL POPULATION
580
MALE POPULATION
534
FEMALE POPULATION
108.61
MALES / 100 FEMALES
92.07
FEMALES / 100 MALES
40.3
MEDIAN AGE
3.2
AVG FAMILY SIZE
2.7
AVG HOUSEHOLD SIZE
541
LABOR FORCE [ PEOPLE ]
58.5%
PERCENT IN LABOR FORCE
4.8%
UNEMPLOYMENT RATE
Mountain View Zip Codes
Mountain View Area Codes
Income in Mountain View
Income Overview in Mountain View
Per Capita Income in Mountain View is $32,711, while median incomes of families and households are $90,272 and $69,514 respectively.
| Characteristic | Number | Measure |
| Per Capita Income | 1,114 | $32,711 |
| Median Family Income | 305 | $90,272 |
| Mean Family Income | 305 | $98,884 |
| Median Household Income | 419 | $69,514 |
| Mean Household Income | 419 | $84,699 |
| Income Deficit | 305 | $0 |
| Wage / Income Gap (%) | 1,114 | 51.28% |
| Wage / Income Gap ($) | 1,114 | 48.72¢ per $1 |
| Gini / Inequality Index | 1,114 | 0.37 |
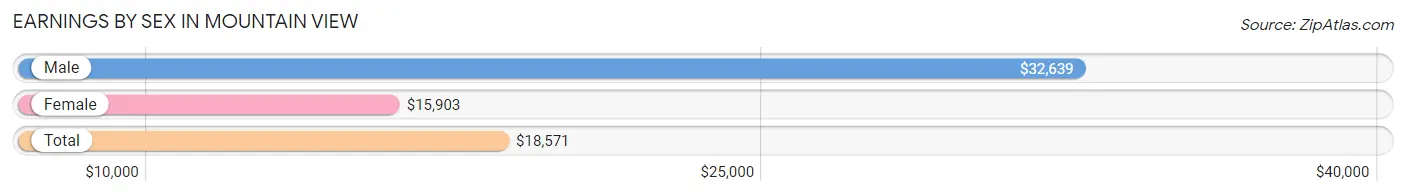
Earnings by Sex in Mountain View
Average Earnings in Mountain View are $18,571, $32,639 for men and $15,903 for women, a difference of 51.3%.
| Sex | Number | Average Earnings |
| Male | 381 (54.7%) | $32,639 |
| Female | 315 (45.3%) | $15,903 |
| Total | 696 (100.0%) | $18,571 |
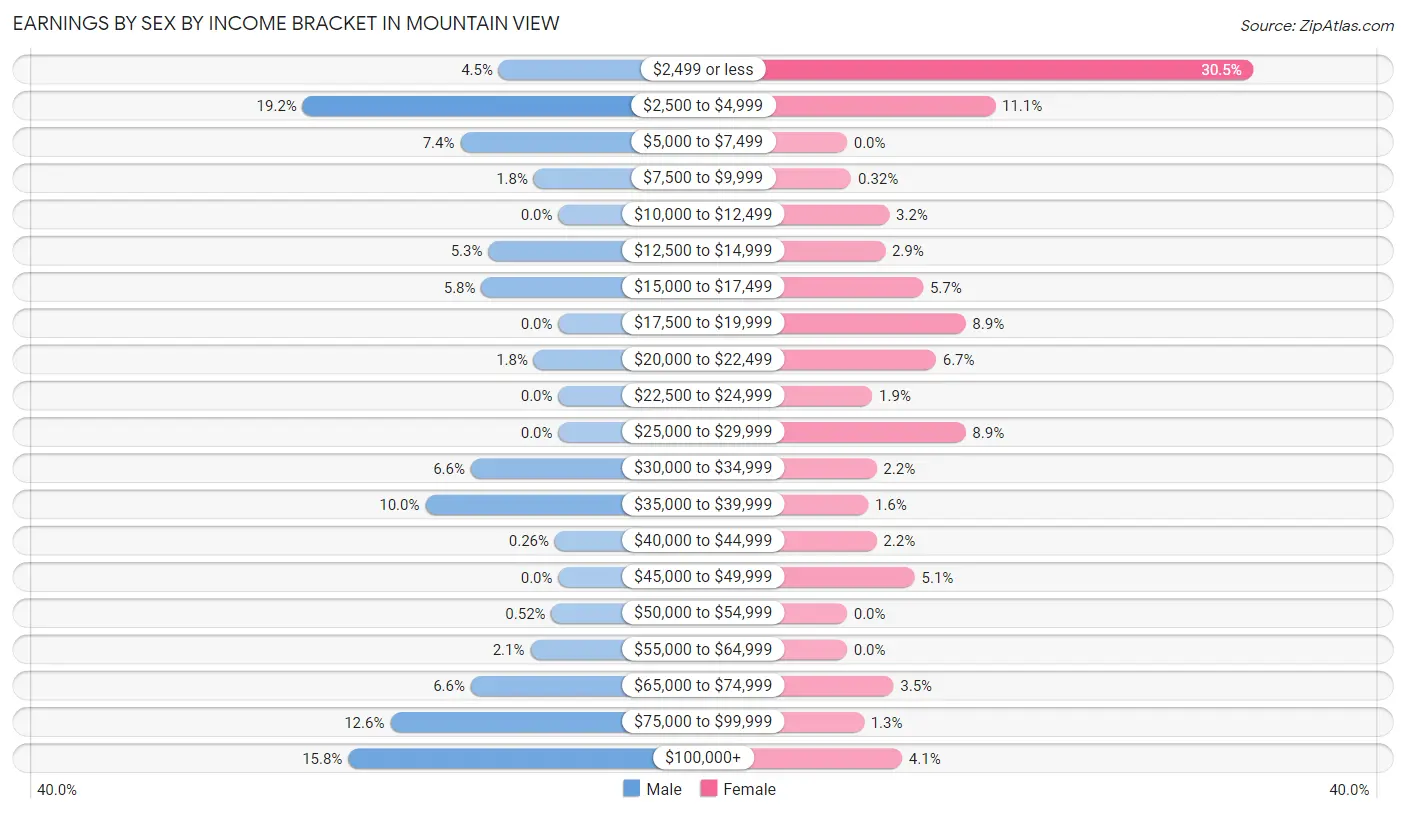
Earnings by Sex by Income Bracket in Mountain View
The most common earnings brackets in Mountain View are $2,500 to $4,999 for men (73 | 19.2%) and $2,499 or less for women (96 | 30.5%).
| Income | Male | Female |
| $2,499 or less | 17 (4.5%) | 96 (30.5%) |
| $2,500 to $4,999 | 73 (19.2%) | 35 (11.1%) |
| $5,000 to $7,499 | 28 (7.3%) | 0 (0.0%) |
| $7,500 to $9,999 | 7 (1.8%) | 1 (0.3%) |
| $10,000 to $12,499 | 0 (0.0%) | 10 (3.2%) |
| $12,500 to $14,999 | 20 (5.2%) | 9 (2.9%) |
| $15,000 to $17,499 | 22 (5.8%) | 18 (5.7%) |
| $17,500 to $19,999 | 0 (0.0%) | 28 (8.9%) |
| $20,000 to $22,499 | 7 (1.8%) | 21 (6.7%) |
| $22,500 to $24,999 | 0 (0.0%) | 6 (1.9%) |
| $25,000 to $29,999 | 0 (0.0%) | 28 (8.9%) |
| $30,000 to $34,999 | 25 (6.6%) | 7 (2.2%) |
| $35,000 to $39,999 | 38 (10.0%) | 5 (1.6%) |
| $40,000 to $44,999 | 1 (0.3%) | 7 (2.2%) |
| $45,000 to $49,999 | 0 (0.0%) | 16 (5.1%) |
| $50,000 to $54,999 | 2 (0.5%) | 0 (0.0%) |
| $55,000 to $64,999 | 8 (2.1%) | 0 (0.0%) |
| $65,000 to $74,999 | 25 (6.6%) | 11 (3.5%) |
| $75,000 to $99,999 | 48 (12.6%) | 4 (1.3%) |
| $100,000+ | 60 (15.8%) | 13 (4.1%) |
| Total | 381 (100.0%) | 315 (100.0%) |
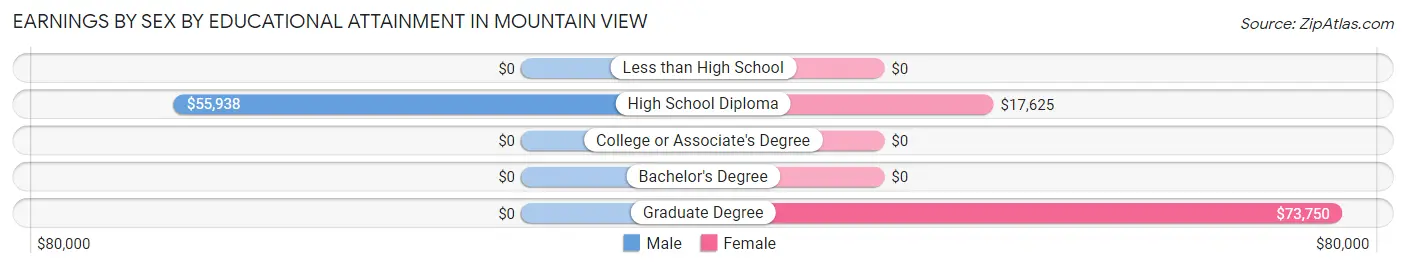
Earnings by Sex by Educational Attainment in Mountain View
Average earnings in Mountain View are $55,938 for men and $19,000 for women, a difference of 66.0%. Men with an educational attainment of high school diploma enjoy the highest average annual earnings of $55,938, while those with high school diploma education earn the least with $55,938. Women with an educational attainment of graduate degree earn the most with the average annual earnings of $73,750, while those with high school diploma education have the smallest earnings of $17,625.
| Educational Attainment | Male Income | Female Income |
| Less than High School | - | - |
| High School Diploma | $55,938 | $17,625 |
| College or Associate's Degree | - | - |
| Bachelor's Degree | - | - |
| Graduate Degree | - | - |
| Total | $55,938 | $19,000 |
Family Income in Mountain View
Family Income Brackets in Mountain View
According to the Mountain View family income data, there are 81 families falling into the $100,000 to $149,999 income range, which is the most common income bracket and makes up 26.6% of all families.
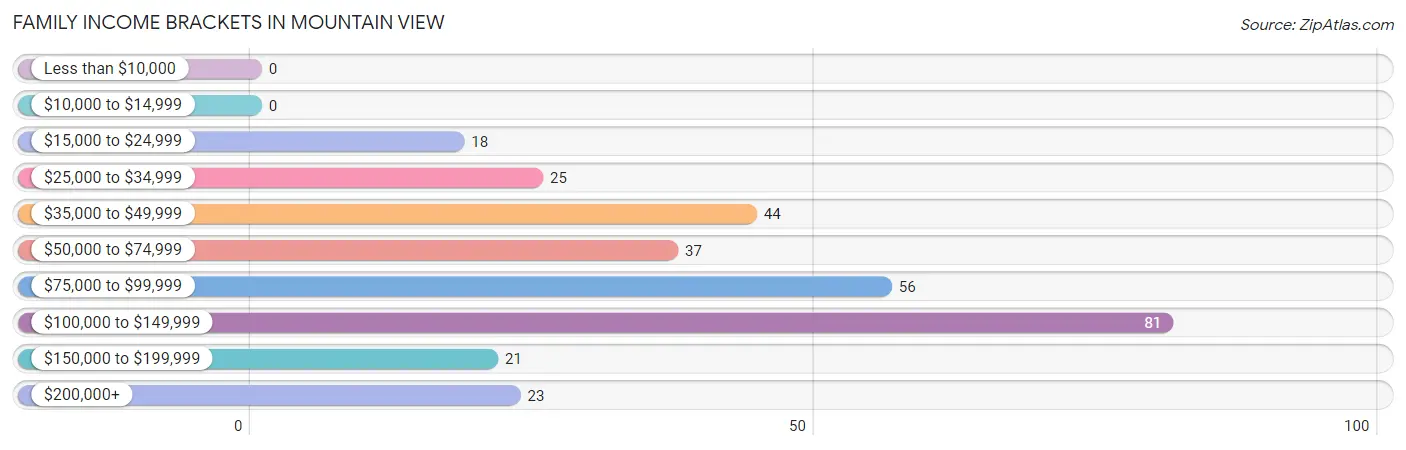
| Income Bracket | # Families | % Families |
| Less than $10,000 | 0 | 0.0% |
| $10,000 to $14,999 | 0 | 0.0% |
| $15,000 to $24,999 | 18 | 5.9% |
| $25,000 to $34,999 | 25 | 8.2% |
| $35,000 to $49,999 | 44 | 14.4% |
| $50,000 to $74,999 | 37 | 12.1% |
| $75,000 to $99,999 | 56 | 18.4% |
| $100,000 to $149,999 | 81 | 26.6% |
| $150,000 to $199,999 | 21 | 6.9% |
| $200,000+ | 23 | 7.5% |
Family Income by Famaliy Size in Mountain View
5-person families (63 | 20.7%) account for the highest median family income in Mountain View with $90,917 per family, while 2-person families (172 | 56.4%) have the highest median income of $45,156 per family member.
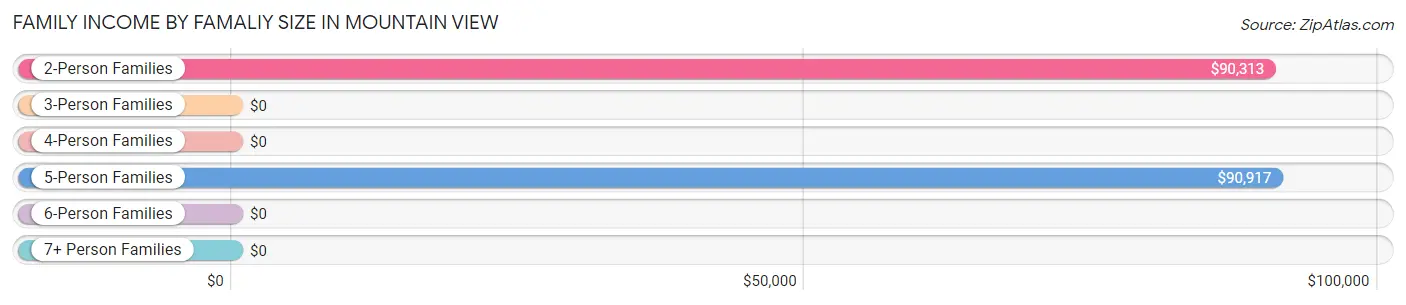
| Income Bracket | # Families | Median Income |
| 2-Person Families | 172 (56.4%) | $90,313 |
| 3-Person Families | 37 (12.1%) | $0 |
| 4-Person Families | 33 (10.8%) | $0 |
| 5-Person Families | 63 (20.7%) | $90,917 |
| 6-Person Families | 0 (0.0%) | $0 |
| 7+ Person Families | 0 (0.0%) | $0 |
| Total | 305 (100.0%) | $90,272 |
Family Income by Number of Earners in Mountain View
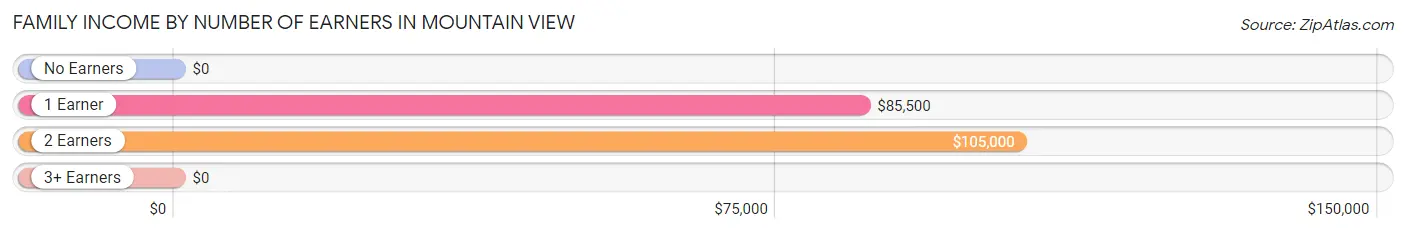
| Number of Earners | # Families | Median Income |
| No Earners | 45 (14.7%) | $0 |
| 1 Earner | 100 (32.8%) | $85,500 |
| 2 Earners | 88 (28.8%) | $105,000 |
| 3+ Earners | 72 (23.6%) | $0 |
| Total | 305 (100.0%) | $90,272 |
Household Income in Mountain View
Household Income Brackets in Mountain View
With 83 households falling in the category, the $35,000 to $49,999 income range is the most frequent in Mountain View, accounting for 19.8% of all households.
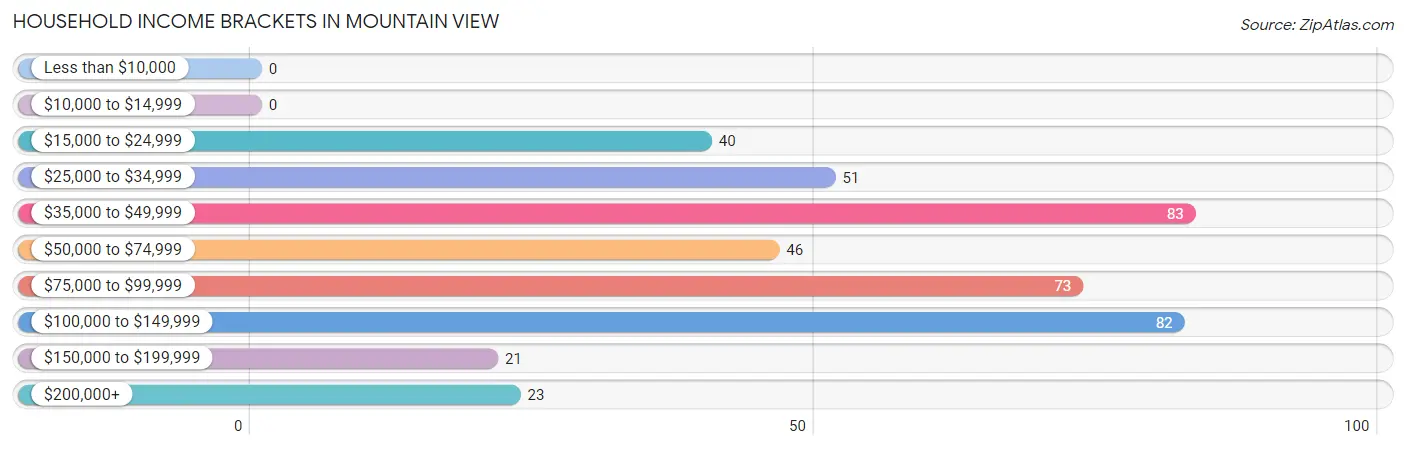
| Income Bracket | # Households | % Households |
| Less than $10,000 | 0 | 0.0% |
| $10,000 to $14,999 | 0 | 0.0% |
| $15,000 to $24,999 | 40 | 9.5% |
| $25,000 to $34,999 | 51 | 12.2% |
| $35,000 to $49,999 | 83 | 19.8% |
| $50,000 to $74,999 | 46 | 11.0% |
| $75,000 to $99,999 | 73 | 17.4% |
| $100,000 to $149,999 | 82 | 19.6% |
| $150,000 to $199,999 | 21 | 5.0% |
| $200,000+ | 23 | 5.5% |
Household Income by Householder Age in Mountain View
The median household income in Mountain View is $69,514, with the highest median household income of $91,917 found in the 25 to 44 years age bracket for the primary householder. A total of 115 households (27.5%) fall into this category. Meanwhile, the 15 to 24 years age bracket for the primary householder has the lowest median household income of $39,286, with 26 households (6.2%) in this group.
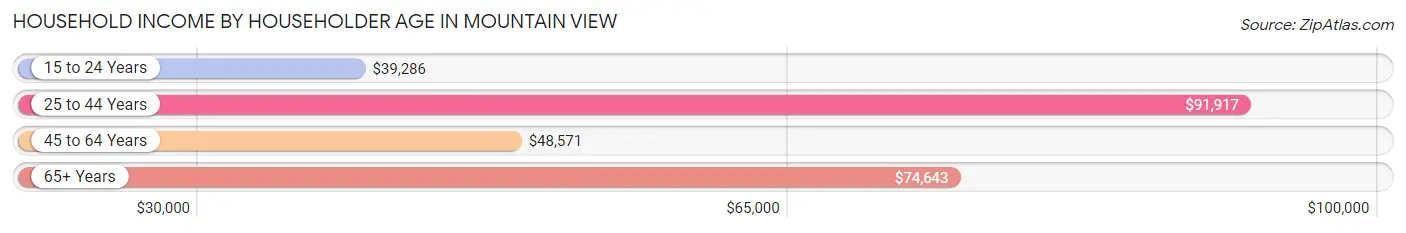
| Income Bracket | # Households | Median Income |
| 15 to 24 Years | 26 (6.2%) | $39,286 |
| 25 to 44 Years | 115 (27.5%) | $91,917 |
| 45 to 64 Years | 164 (39.1%) | $48,571 |
| 65+ Years | 114 (27.2%) | $74,643 |
| Total | 419 (100.0%) | $69,514 |
Poverty in Mountain View
Income Below Poverty by Sex and Age in Mountain View
With 14.8% poverty level for males and 14.8% for females among the residents of Mountain View, 5 year old males and 16 and 17 year old females are the most vulnerable to poverty, with 7 males (100.0%) and 18 females (75.0%) in their respective age groups living below the poverty level.
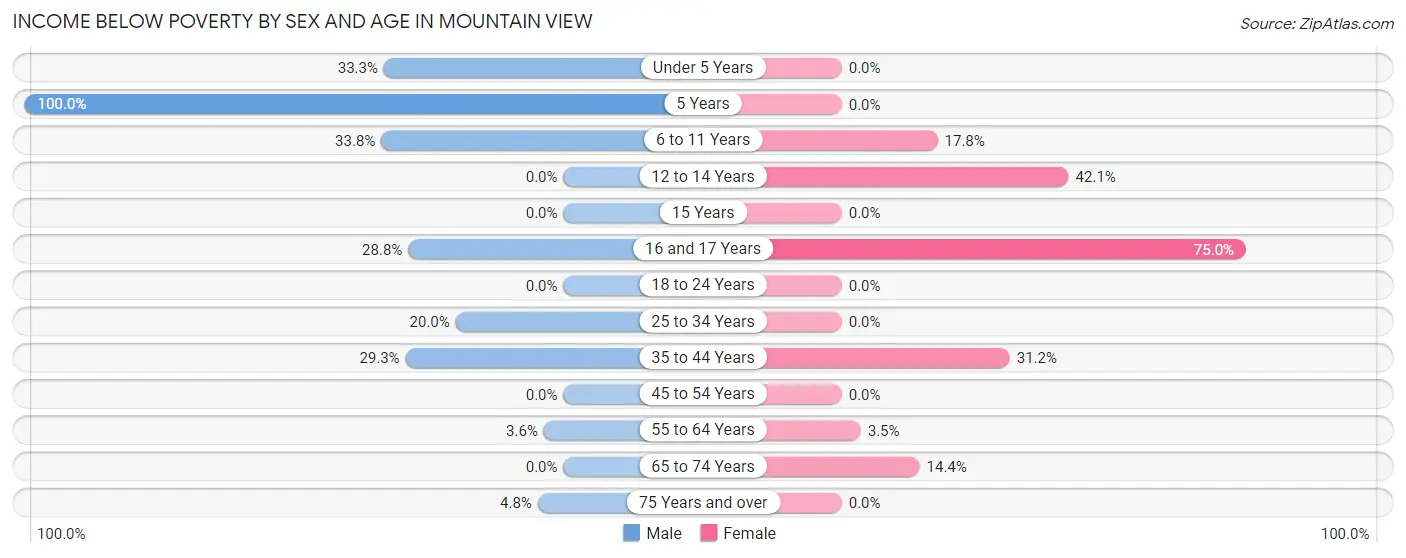
| Age Bracket | Male | Female |
| Under 5 Years | 5 (33.3%) | 0 (0.0%) |
| 5 Years | 7 (100.0%) | 0 (0.0%) |
| 6 to 11 Years | 23 (33.8%) | 8 (17.8%) |
| 12 to 14 Years | 0 (0.0%) | 8 (42.1%) |
| 15 Years | 0 (0.0%) | 0 (0.0%) |
| 16 and 17 Years | 17 (28.8%) | 18 (75.0%) |
| 18 to 24 Years | 0 (0.0%) | 0 (0.0%) |
| 25 to 34 Years | 13 (20.0%) | 0 (0.0%) |
| 35 to 44 Years | 17 (29.3%) | 29 (31.2%) |
| 45 to 54 Years | 0 (0.0%) | 0 (0.0%) |
| 55 to 64 Years | 2 (3.6%) | 3 (3.5%) |
| 65 to 74 Years | 0 (0.0%) | 13 (14.4%) |
| 75 Years and over | 2 (4.8%) | 0 (0.0%) |
| Total | 86 (14.8%) | 79 (14.8%) |
Income Above Poverty by Sex and Age in Mountain View
According to the poverty statistics in Mountain View, males aged 12 to 14 years and females aged under 5 years are the age groups that are most secure financially, with 100.0% of males and 100.0% of females in these age groups living above the poverty line.
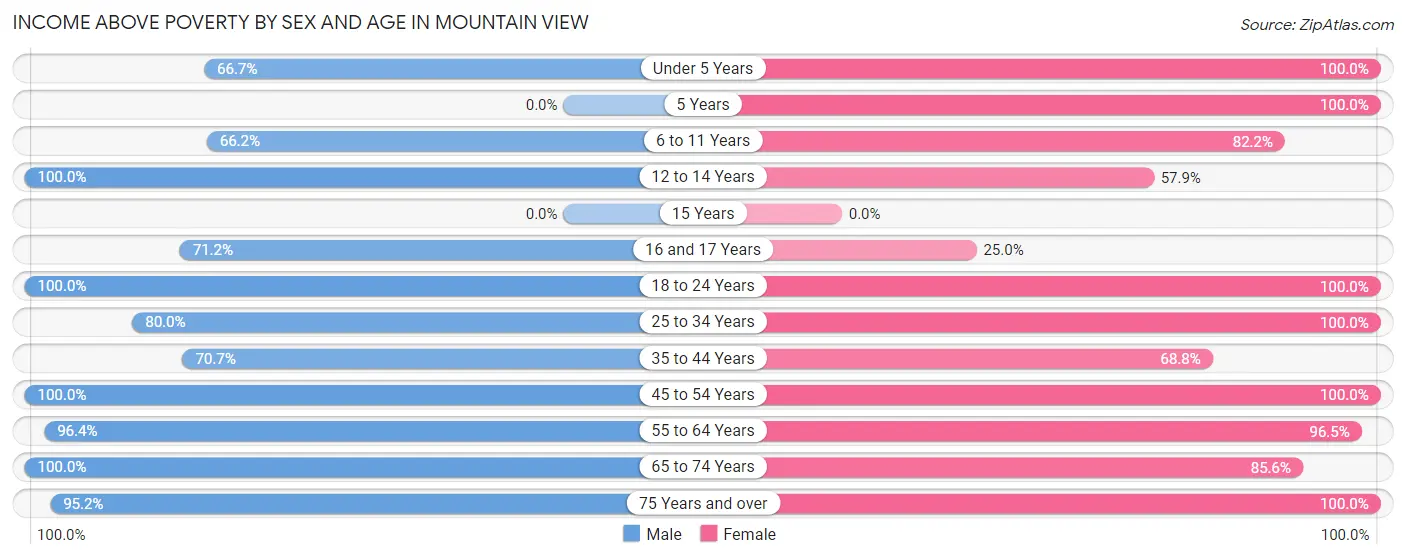
| Age Bracket | Male | Female |
| Under 5 Years | 10 (66.7%) | 24 (100.0%) |
| 5 Years | 0 (0.0%) | 1 (100.0%) |
| 6 to 11 Years | 45 (66.2%) | 37 (82.2%) |
| 12 to 14 Years | 10 (100.0%) | 11 (57.9%) |
| 15 Years | 0 (0.0%) | 0 (0.0%) |
| 16 and 17 Years | 42 (71.2%) | 6 (25.0%) |
| 18 to 24 Years | 58 (100.0%) | 49 (100.0%) |
| 25 to 34 Years | 52 (80.0%) | 24 (100.0%) |
| 35 to 44 Years | 41 (70.7%) | 64 (68.8%) |
| 45 to 54 Years | 63 (100.0%) | 66 (100.0%) |
| 55 to 64 Years | 53 (96.4%) | 82 (96.5%) |
| 65 to 74 Years | 80 (100.0%) | 77 (85.6%) |
| 75 Years and over | 40 (95.2%) | 14 (100.0%) |
| Total | 494 (85.2%) | 455 (85.2%) |
Income Below Poverty Among Married-Couple Families in Mountain View
The poverty statistics for married-couple families in Mountain View show that 12.6% or 34 of the total 270 families live below the poverty line. Families with 3 or 4 children have the highest poverty rate of 46.7%, comprising of 21 families. On the other hand, families with no children have the lowest poverty rate of 1.2%, which includes 2 families.
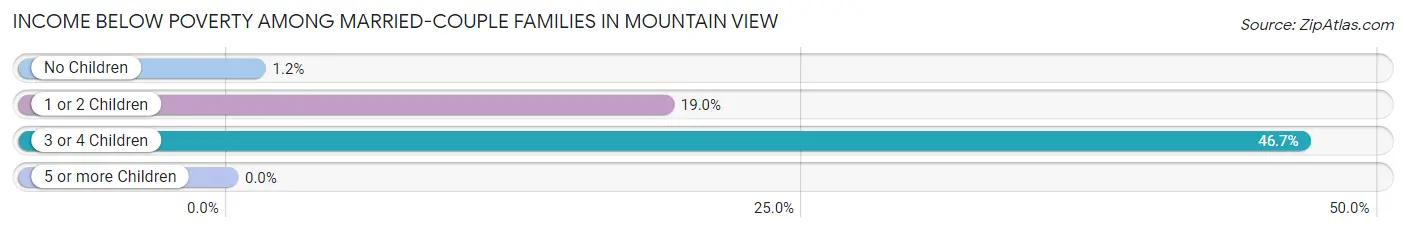
| Children | Above Poverty | Below Poverty |
| No Children | 165 (98.8%) | 2 (1.2%) |
| 1 or 2 Children | 47 (81.0%) | 11 (19.0%) |
| 3 or 4 Children | 24 (53.3%) | 21 (46.7%) |
| 5 or more Children | 0 (0.0%) | 0 (0.0%) |
| Total | 236 (87.4%) | 34 (12.6%) |
Income Below Poverty Among Single-Parent Households in Mountain View
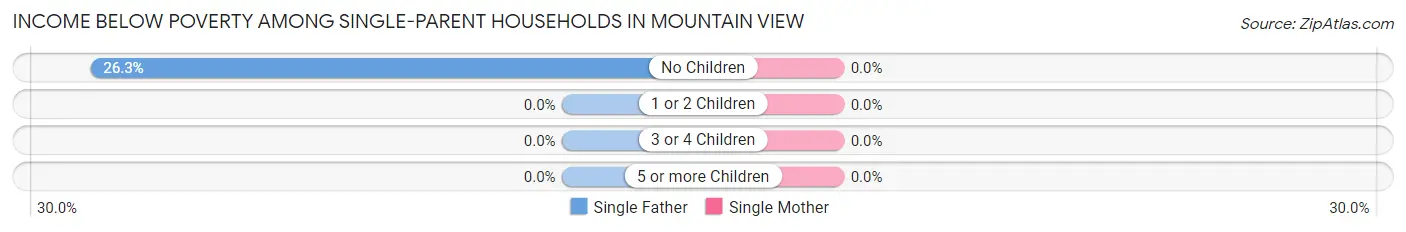
| Children | Single Father | Single Mother |
| No Children | 5 (26.3%) | 0 (0.0%) |
| 1 or 2 Children | 0 (0.0%) | 0 (0.0%) |
| 3 or 4 Children | 0 (0.0%) | 0 (0.0%) |
| 5 or more Children | 0 (0.0%) | 0 (0.0%) |
| Total | 5 (26.3%) | 0 (0.0%) |
Income Below Poverty Among Married-Couple vs Single-Parent Households in Mountain View
The poverty data for Mountain View shows that 34 of the married-couple family households (12.6%) and 5 of the single-parent households (14.3%) are living below the poverty level. Within the married-couple family households, those with 3 or 4 children have the highest poverty rate, with 21 households (46.7%) falling below the poverty line. Among the single-parent households, those with no children have the highest poverty rate, with 5 household (16.1%) living below poverty.
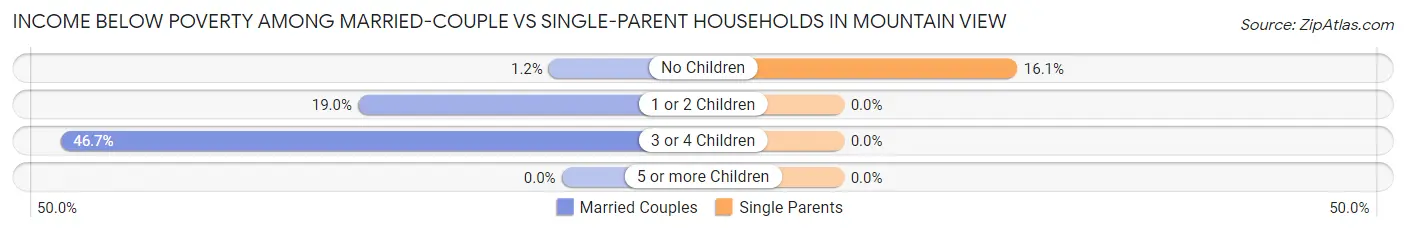
| Children | Married-Couple Families | Single-Parent Households |
| No Children | 2 (1.2%) | 5 (16.1%) |
| 1 or 2 Children | 11 (19.0%) | 0 (0.0%) |
| 3 or 4 Children | 21 (46.7%) | 0 (0.0%) |
| 5 or more Children | 0 (0.0%) | 0 (0.0%) |
| Total | 34 (12.6%) | 5 (14.3%) |
Race in Mountain View
The most populous races in Mountain View are White / Caucasian (1,047 | 94.0%), Hispanic or Latino (67 | 6.0%), and Two or more Races (59 | 5.3%).
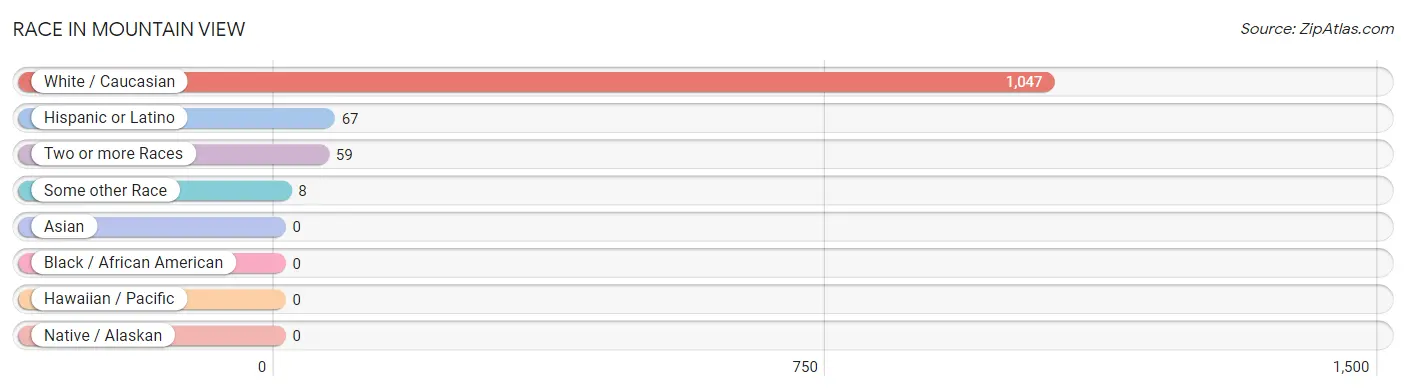
| Race | # Population | % Population |
| Asian | 0 | 0.0% |
| Black / African American | 0 | 0.0% |
| Hawaiian / Pacific | 0 | 0.0% |
| Hispanic or Latino | 67 | 6.0% |
| Native / Alaskan | 0 | 0.0% |
| White / Caucasian | 1,047 | 94.0% |
| Two or more Races | 59 | 5.3% |
| Some other Race | 8 | 0.7% |
| Total | 1,114 | 100.0% |
Ancestry in Mountain View
The most populous ancestries reported in Mountain View are English (401 | 36.0%), German (210 | 18.9%), Irish (138 | 12.4%), Scottish (105 | 9.4%), and Dutch (57 | 5.1%), together accounting for 81.8% of all Mountain View residents.
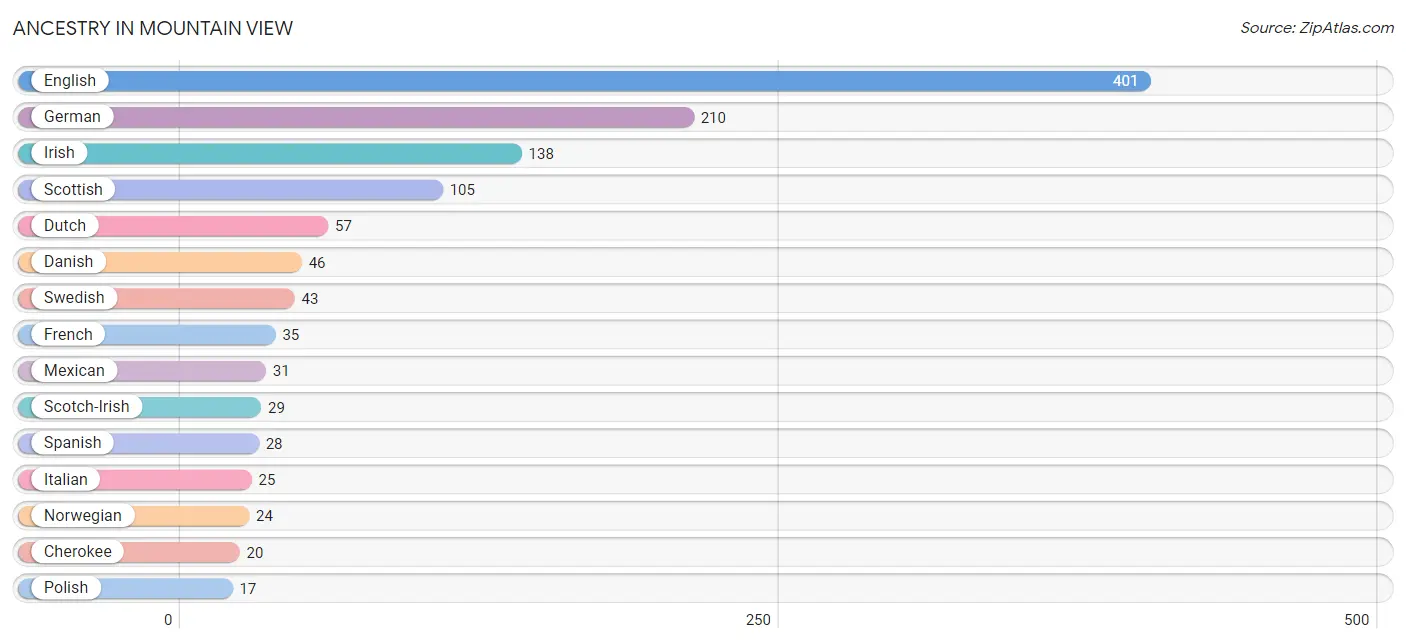
| Ancestry | # Population | % Population |
| Apache | 2 | 0.2% |
| Belgian | 9 | 0.8% |
| Blackfeet | 5 | 0.4% |
| Central American | 7 | 0.6% |
| Cherokee | 20 | 1.8% |
| Croatian | 4 | 0.4% |
| Danish | 46 | 4.1% |
| Dutch | 57 | 5.1% |
| English | 401 | 36.0% |
| French | 35 | 3.1% |
| French Canadian | 8 | 0.7% |
| German | 210 | 18.9% |
| Irish | 138 | 12.4% |
| Italian | 25 | 2.2% |
| Korean | 6 | 0.5% |
| Mexican | 31 | 2.8% |
| Nicaraguan | 7 | 0.6% |
| Norwegian | 24 | 2.1% |
| Polish | 17 | 1.5% |
| Russian | 6 | 0.5% |
| Scotch-Irish | 29 | 2.6% |
| Scottish | 105 | 9.4% |
| Sioux | 3 | 0.3% |
| Spaniard | 1 | 0.1% |
| Spanish | 28 | 2.5% |
| Swedish | 43 | 3.9% |
| Swiss | 7 | 0.6% |
| Ute | 7 | 0.6% |
| Welsh | 15 | 1.3% |
| Yugoslavian | 4 | 0.4% | View All 30 Rows |
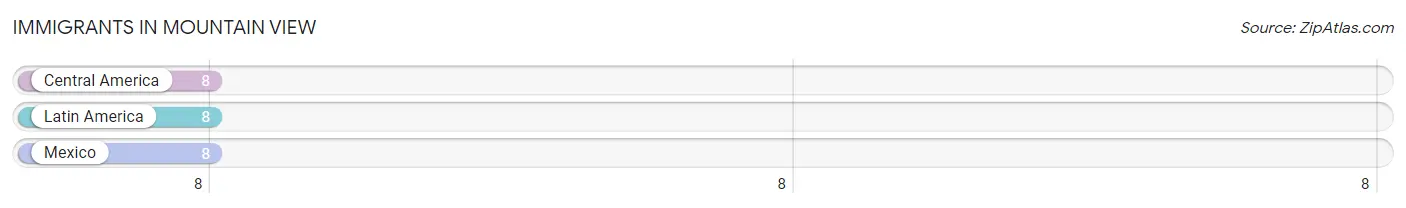
Immigrants in Mountain View
The most numerous immigrant groups reported in Mountain View came from Central America (8 | 0.7%), Latin America (8 | 0.7%), and Mexico (8 | 0.7%), together accounting for 2.2% of all Mountain View residents.
| Immigration Origin | # Population | % Population |
| Central America | 8 | 0.7% |
| Latin America | 8 | 0.7% |
| Mexico | 8 | 0.7% | View All 3 Rows |
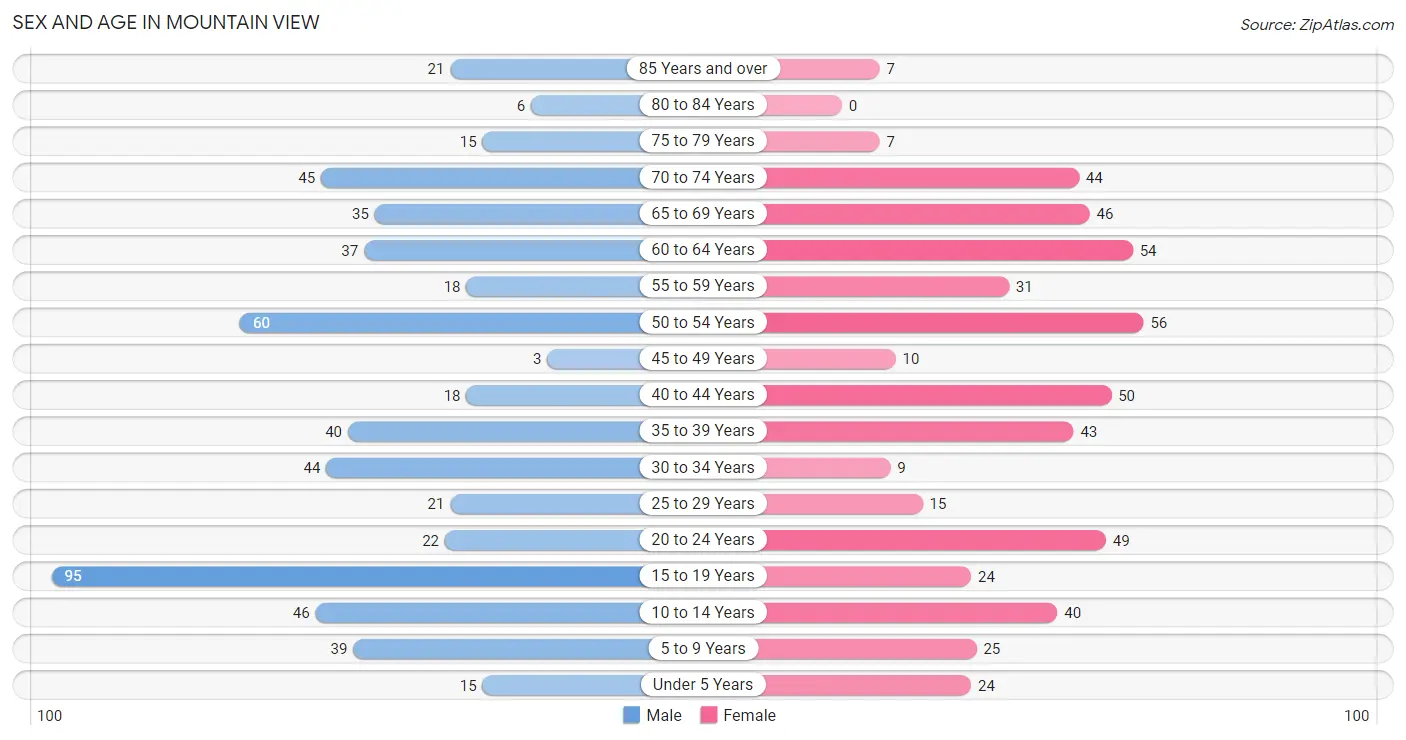
Sex and Age in Mountain View
Sex and Age in Mountain View
The most populous age groups in Mountain View are 15 to 19 Years (95 | 16.4%) for men and 50 to 54 Years (56 | 10.5%) for women.
| Age Bracket | Male | Female |
| Under 5 Years | 15 (2.6%) | 24 (4.5%) |
| 5 to 9 Years | 39 (6.7%) | 25 (4.7%) |
| 10 to 14 Years | 46 (7.9%) | 40 (7.5%) |
| 15 to 19 Years | 95 (16.4%) | 24 (4.5%) |
| 20 to 24 Years | 22 (3.8%) | 49 (9.2%) |
| 25 to 29 Years | 21 (3.6%) | 15 (2.8%) |
| 30 to 34 Years | 44 (7.6%) | 9 (1.7%) |
| 35 to 39 Years | 40 (6.9%) | 43 (8.1%) |
| 40 to 44 Years | 18 (3.1%) | 50 (9.4%) |
| 45 to 49 Years | 3 (0.5%) | 10 (1.9%) |
| 50 to 54 Years | 60 (10.3%) | 56 (10.5%) |
| 55 to 59 Years | 18 (3.1%) | 31 (5.8%) |
| 60 to 64 Years | 37 (6.4%) | 54 (10.1%) |
| 65 to 69 Years | 35 (6.0%) | 46 (8.6%) |
| 70 to 74 Years | 45 (7.8%) | 44 (8.2%) |
| 75 to 79 Years | 15 (2.6%) | 7 (1.3%) |
| 80 to 84 Years | 6 (1.0%) | 0 (0.0%) |
| 85 Years and over | 21 (3.6%) | 7 (1.3%) |
| Total | 580 (100.0%) | 534 (100.0%) |
Families and Households in Mountain View
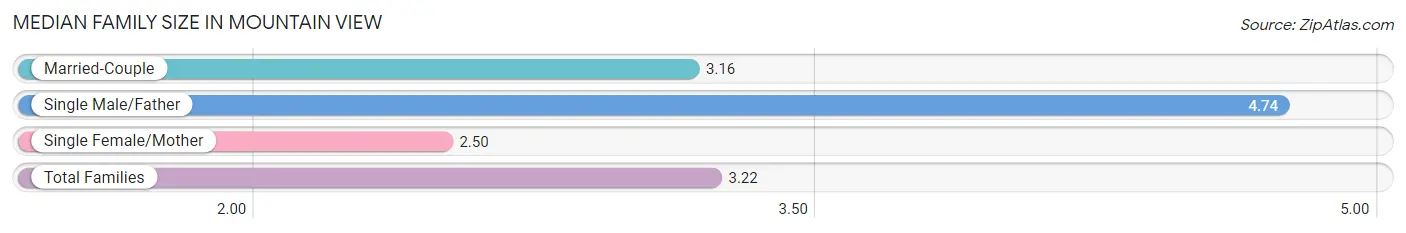
Median Family Size in Mountain View
The median family size in Mountain View is 3.22 persons per family, with single male/father families (19 | 6.2%) accounting for the largest median family size of 4.74 persons per family. On the other hand, single female/mother families (16 | 5.2%) represent the smallest median family size with 2.50 persons per family.
| Family Type | # Families | Family Size |
| Married-Couple | 270 (88.5%) | 3.16 |
| Single Male/Father | 19 (6.2%) | 4.74 |
| Single Female/Mother | 16 (5.2%) | 2.50 |
| Total Families | 305 (100.0%) | 3.22 |
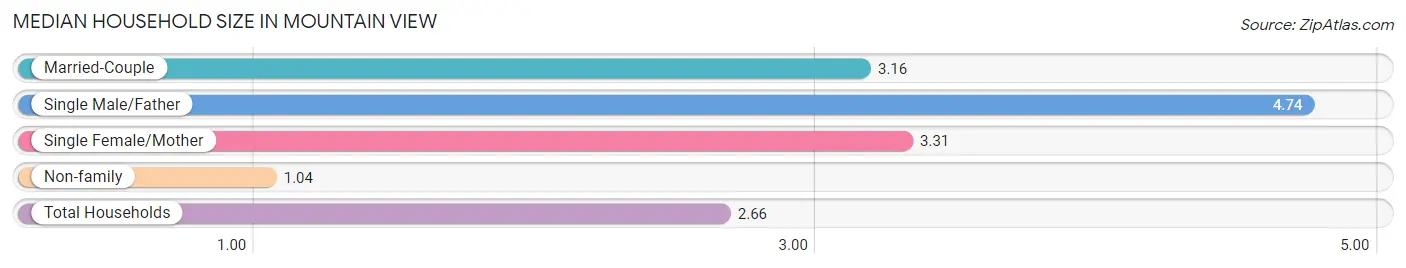
Median Household Size in Mountain View
The median household size in Mountain View is 2.66 persons per household, with single male/father households (19 | 4.5%) accounting for the largest median household size of 4.74 persons per household. non-family households (114 | 27.2%) represent the smallest median household size with 1.04 persons per household.
| Household Type | # Households | Household Size |
| Married-Couple | 270 (64.4%) | 3.16 |
| Single Male/Father | 19 (4.5%) | 4.74 |
| Single Female/Mother | 16 (3.8%) | 3.31 |
| Non-family | 114 (27.2%) | 1.04 |
| Total Households | 419 (100.0%) | 2.66 |
Household Size by Marriage Status in Mountain View
Out of a total of 419 households in Mountain View, 305 (72.8%) are family households, while 114 (27.2%) are nonfamily households. The most numerous type of family households are 2-person households, comprising 161, and the most common type of nonfamily households are 1-person households, comprising 110.
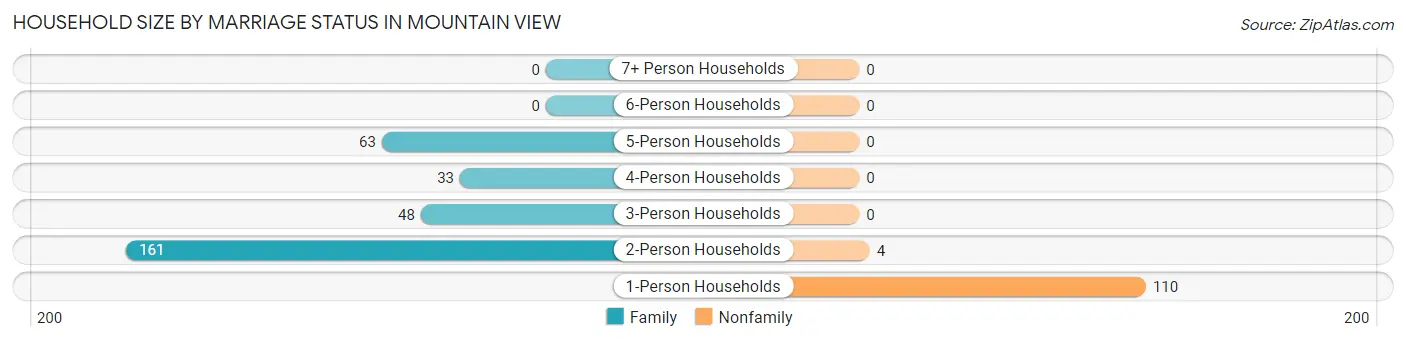
| Household Size | Family Households | Nonfamily Households |
| 1-Person Households | - | 110 (26.3%) |
| 2-Person Households | 161 (38.4%) | 4 (0.9%) |
| 3-Person Households | 48 (11.5%) | 0 (0.0%) |
| 4-Person Households | 33 (7.9%) | 0 (0.0%) |
| 5-Person Households | 63 (15.0%) | 0 (0.0%) |
| 6-Person Households | 0 (0.0%) | 0 (0.0%) |
| 7+ Person Households | 0 (0.0%) | 0 (0.0%) |
| Total | 305 (72.8%) | 114 (27.2%) |
Female Fertility in Mountain View
Fertility by Age in Mountain View
Average fertility rate in Mountain View is 24.0 births per 1,000 women. Women in the age bracket of 20 to 34 years have the highest fertility rate with 82.0 births per 1,000 women. Women in the age bracket of 20 to 34 years acount for 100.0% of all women with births.
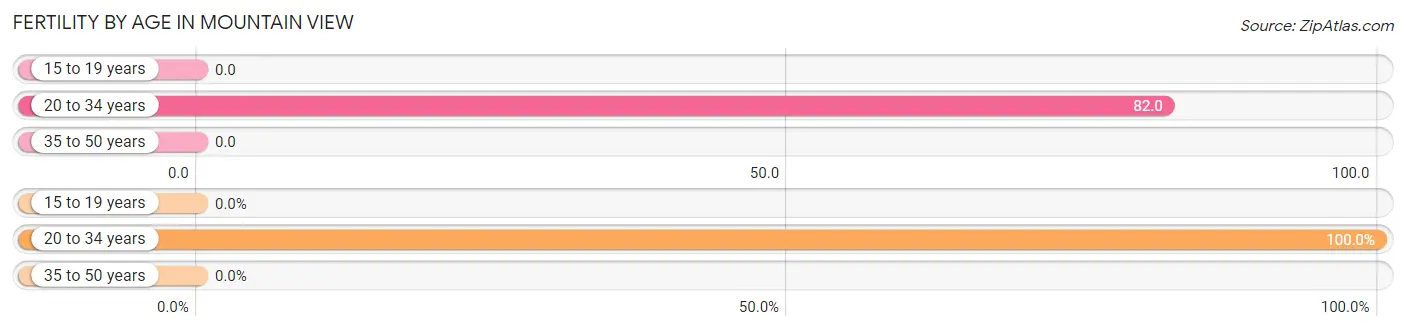
| Age Bracket | Women with Births | Births / 1,000 Women |
| 15 to 19 years | 0 (0.0%) | 0.0 |
| 20 to 34 years | 6 (100.0%) | 82.0 |
| 35 to 50 years | 0 (0.0%) | 0.0 |
| Total | 6 (100.0%) | 24.0 |
Fertility by Age by Marriage Status in Mountain View
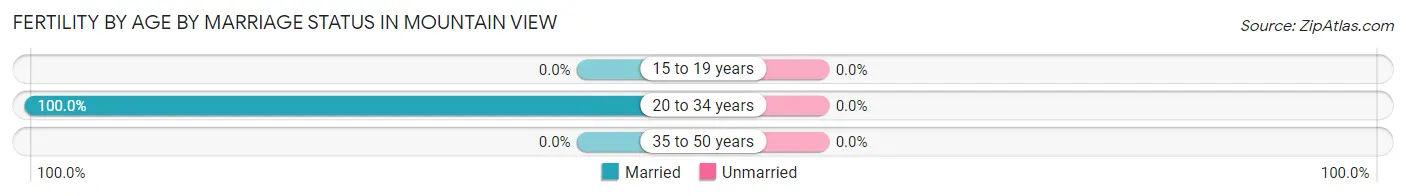
| Age Bracket | Married | Unmarried |
| 15 to 19 years | 0 (0.0%) | 0 (0.0%) |
| 20 to 34 years | 6 (100.0%) | 0 (0.0%) |
| 35 to 50 years | 0 (0.0%) | 0 (0.0%) |
| Total | 6 (100.0%) | 0 (0.0%) |
Fertility by Education in Mountain View
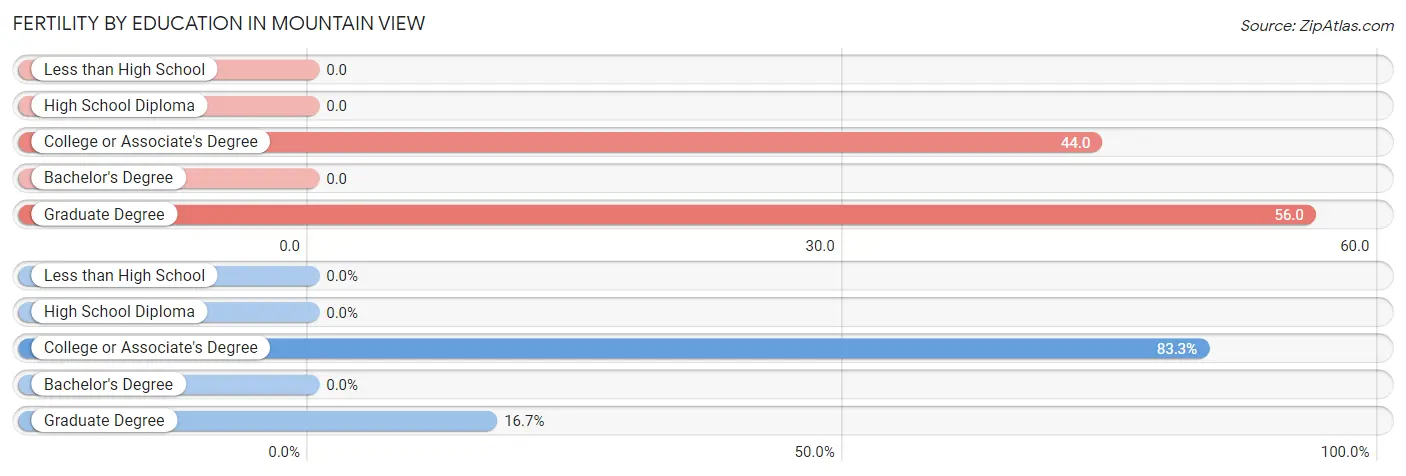
| Educational Attainment | Women with Births | Births / 1,000 Women |
| Less than High School | 0 (0.0%) | 0.0 |
| High School Diploma | 0 (0.0%) | 0.0 |
| College or Associate's Degree | 5 (83.3%) | 44.0 |
| Bachelor's Degree | 0 (0.0%) | 0.0 |
| Graduate Degree | 1 (16.7%) | 56.0 |
| Total | 6 (100.0%) | 24.0 |
Fertility by Education by Marriage Status in Mountain View
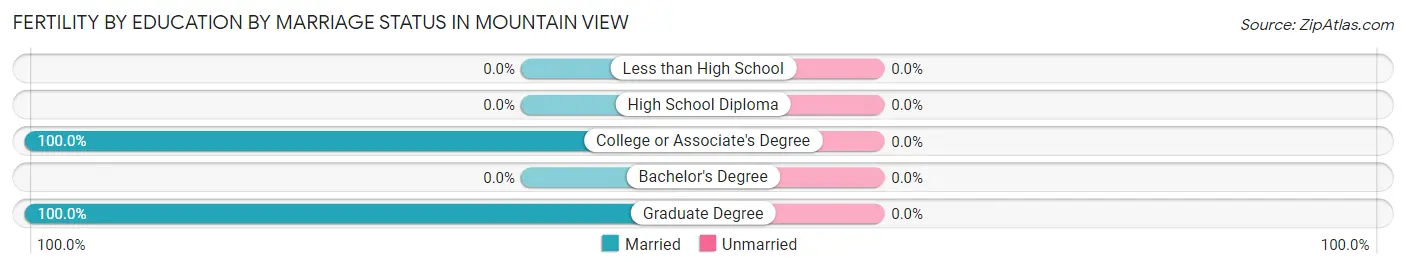
| Educational Attainment | Married | Unmarried |
| Less than High School | 0 (0.0%) | 0 (0.0%) |
| High School Diploma | 0 (0.0%) | 0 (0.0%) |
| College or Associate's Degree | 5 (100.0%) | 0 (0.0%) |
| Bachelor's Degree | 0 (0.0%) | 0 (0.0%) |
| Graduate Degree | 1 (100.0%) | 0 (0.0%) |
| Total | 6 (100.0%) | 0 (0.0%) |
Employment Characteristics in Mountain View
Employment by Class of Employer in Mountain View
Among the 502 employed individuals in Mountain View, private company employees (303 | 60.4%), local government employees (106 | 21.1%), and self-employed (not incorporated) (29 | 5.8%) make up the most common classes of employment.
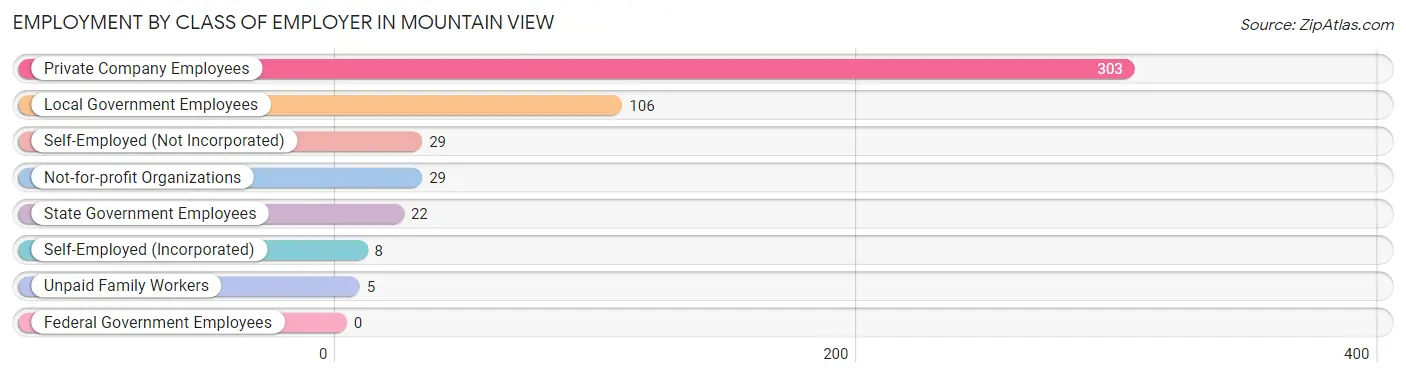
| Employer Class | # Employees | % Employees |
| Private Company Employees | 303 | 60.4% |
| Self-Employed (Incorporated) | 8 | 1.6% |
| Self-Employed (Not Incorporated) | 29 | 5.8% |
| Not-for-profit Organizations | 29 | 5.8% |
| Local Government Employees | 106 | 21.1% |
| State Government Employees | 22 | 4.4% |
| Federal Government Employees | 0 | 0.0% |
| Unpaid Family Workers | 5 | 1.0% |
| Total | 502 | 100.0% |
Employment Status by Age in Mountain View
According to the labor force statistics for Mountain View, out of the total population over 16 years of age (925), 58.5% or 541 individuals are in the labor force, with 4.8% or 26 of them unemployed. The age group with the highest labor force participation rate is 30 to 34 years, with 100.0% or 53 individuals in the labor force. Within the labor force, the 20 to 24 years age range has the highest percentage of unemployed individuals, with 32.9% or 23 of them being unemployed.
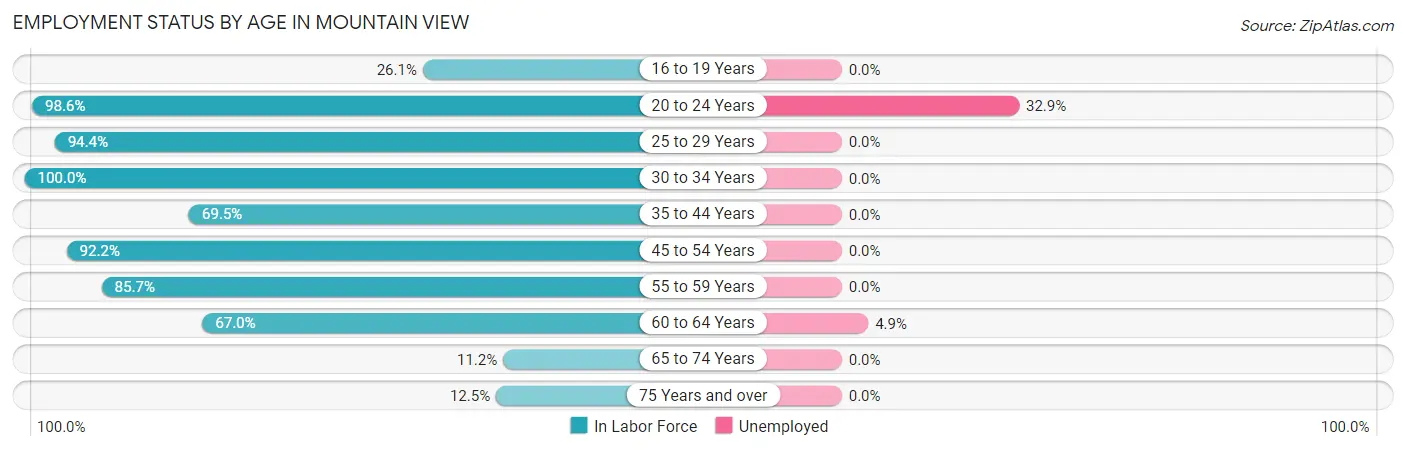
| Age Bracket | In Labor Force | Unemployed |
| 16 to 19 Years | 31 (26.1%) | 0 (0.0%) |
| 20 to 24 Years | 70 (98.6%) | 23 (32.9%) |
| 25 to 29 Years | 34 (94.4%) | 0 (0.0%) |
| 30 to 34 Years | 53 (100.0%) | 0 (0.0%) |
| 35 to 44 Years | 105 (69.5%) | 0 (0.0%) |
| 45 to 54 Years | 119 (92.2%) | 0 (0.0%) |
| 55 to 59 Years | 42 (85.7%) | 0 (0.0%) |
| 60 to 64 Years | 61 (67.0%) | 3 (4.9%) |
| 65 to 74 Years | 19 (11.2%) | 0 (0.0%) |
| 75 Years and over | 7 (12.5%) | 0 (0.0%) |
| Total | 541 (58.5%) | 26 (4.8%) |
Employment Status by Educational Attainment in Mountain View
According to labor force statistics for Mountain View, 81.3% of individuals (414) out of the total population between 25 and 64 years of age (509) are in the labor force, with 0.7% or 3 of them being unemployed. The group with the highest labor force participation rate are those with the educational attainment of bachelor's degree or higher, with 100.0% or 53 individuals in the labor force. Within the labor force, individuals with less than high school education have the highest percentage of unemployment, with 37.5% or 3 of them being unemployed.
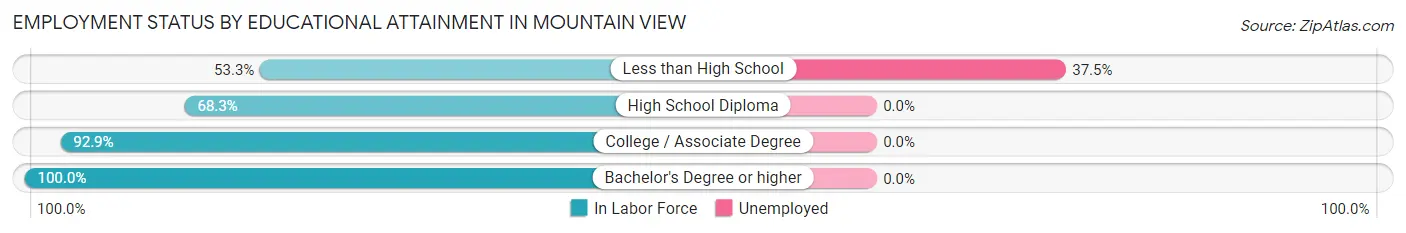
| Educational Attainment | In Labor Force | Unemployed |
| Less than High School | 8 (53.3%) | 6 (37.5%) |
| High School Diploma | 157 (68.3%) | 0 (0.0%) |
| College / Associate Degree | 196 (92.9%) | 0 (0.0%) |
| Bachelor's Degree or higher | 53 (100.0%) | 0 (0.0%) |
| Total | 414 (81.3%) | 4 (0.7%) |
Employment Occupations by Sex in Mountain View
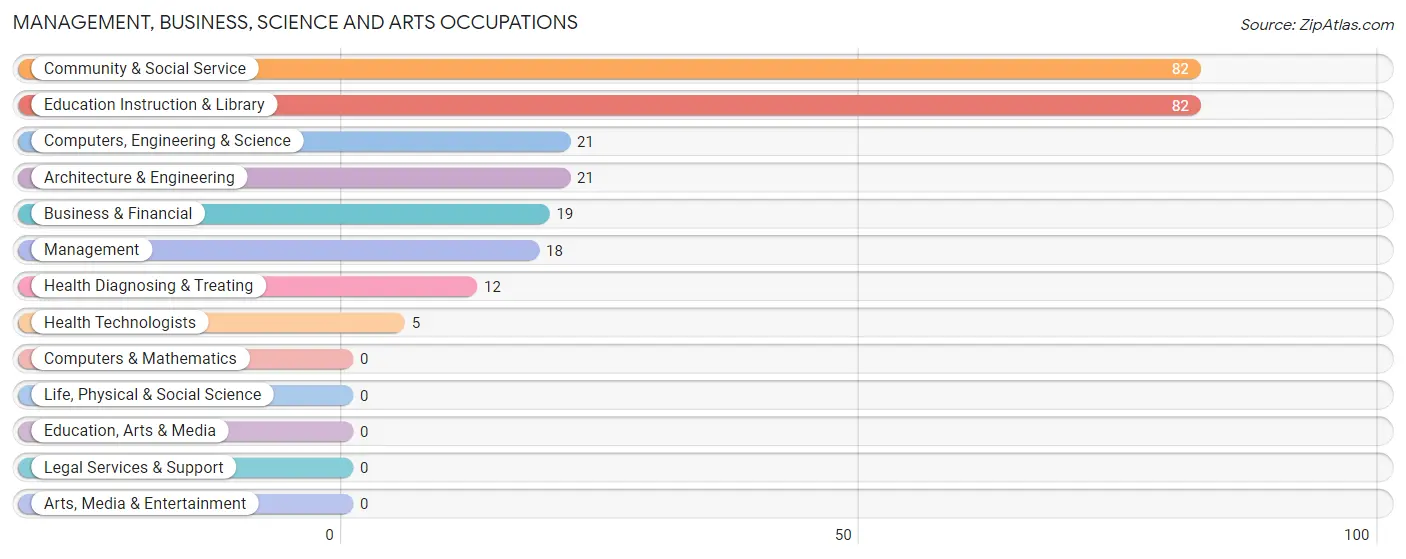
Management, Business, Science and Arts Occupations
The most common Management, Business, Science and Arts occupations in Mountain View are Community & Social Service (82 | 15.9%), Education Instruction & Library (82 | 15.9%), Computers, Engineering & Science (21 | 4.1%), Architecture & Engineering (21 | 4.1%), and Business & Financial (19 | 3.7%).
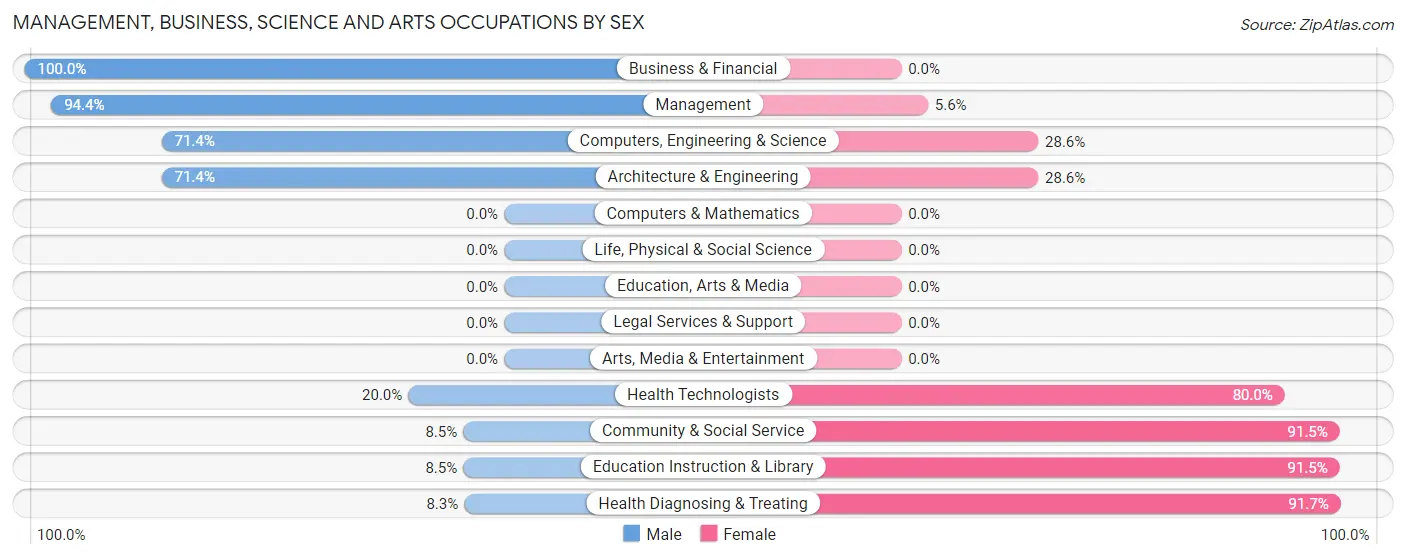
Management, Business, Science and Arts Occupations by Sex
Within the Management, Business, Science and Arts occupations in Mountain View, the most male-oriented occupations are Business & Financial (100.0%), Management (94.4%), and Computers, Engineering & Science (71.4%), while the most female-oriented occupations are Health Diagnosing & Treating (91.7%), Community & Social Service (91.5%), and Education Instruction & Library (91.5%).
| Occupation | Male | Female |
| Management | 17 (94.4%) | 1 (5.6%) |
| Business & Financial | 19 (100.0%) | 0 (0.0%) |
| Computers, Engineering & Science | 15 (71.4%) | 6 (28.6%) |
| Computers & Mathematics | 0 (0.0%) | 0 (0.0%) |
| Architecture & Engineering | 15 (71.4%) | 6 (28.6%) |
| Life, Physical & Social Science | 0 (0.0%) | 0 (0.0%) |
| Community & Social Service | 7 (8.5%) | 75 (91.5%) |
| Education, Arts & Media | 0 (0.0%) | 0 (0.0%) |
| Legal Services & Support | 0 (0.0%) | 0 (0.0%) |
| Education Instruction & Library | 7 (8.5%) | 75 (91.5%) |
| Arts, Media & Entertainment | 0 (0.0%) | 0 (0.0%) |
| Health Diagnosing & Treating | 1 (8.3%) | 11 (91.7%) |
| Health Technologists | 1 (20.0%) | 4 (80.0%) |
| Total (Category) | 59 (38.8%) | 93 (61.2%) |
| Total (Overall) | 267 (51.8%) | 248 (48.2%) |
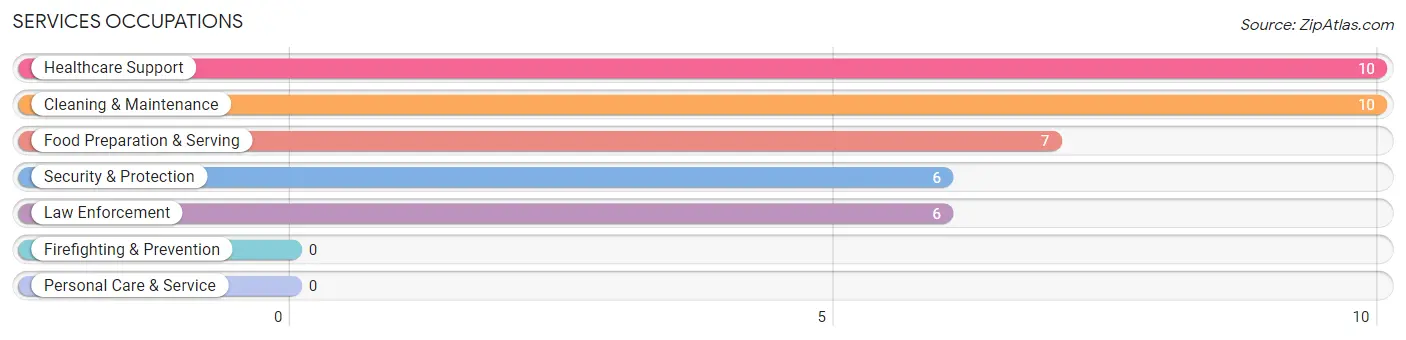
Services Occupations
The most common Services occupations in Mountain View are Healthcare Support (10 | 1.9%), Cleaning & Maintenance (10 | 1.9%), Food Preparation & Serving (7 | 1.4%), Security & Protection (6 | 1.2%), and Law Enforcement (6 | 1.2%).
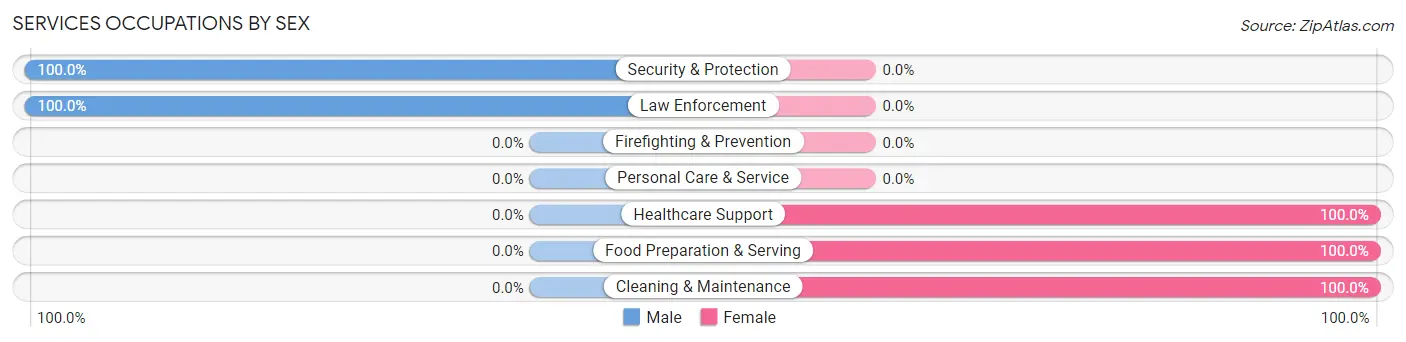
Services Occupations by Sex
Within the Services occupations in Mountain View, the most male-oriented occupations are Security & Protection (100.0%), and Law Enforcement (100.0%), while the most female-oriented occupations are Healthcare Support (100.0%), Food Preparation & Serving (100.0%), and Cleaning & Maintenance (100.0%).
| Occupation | Male | Female |
| Healthcare Support | 0 (0.0%) | 10 (100.0%) |
| Security & Protection | 6 (100.0%) | 0 (0.0%) |
| Firefighting & Prevention | 0 (0.0%) | 0 (0.0%) |
| Law Enforcement | 6 (100.0%) | 0 (0.0%) |
| Food Preparation & Serving | 0 (0.0%) | 7 (100.0%) |
| Cleaning & Maintenance | 0 (0.0%) | 10 (100.0%) |
| Personal Care & Service | 0 (0.0%) | 0 (0.0%) |
| Total (Category) | 6 (18.2%) | 27 (81.8%) |
| Total (Overall) | 267 (51.8%) | 248 (48.2%) |
Sales and Office Occupations
The most common Sales and Office occupations in Mountain View are Office & Administration (65 | 12.6%), and Sales & Related (49 | 9.5%).

Sales and Office Occupations by Sex
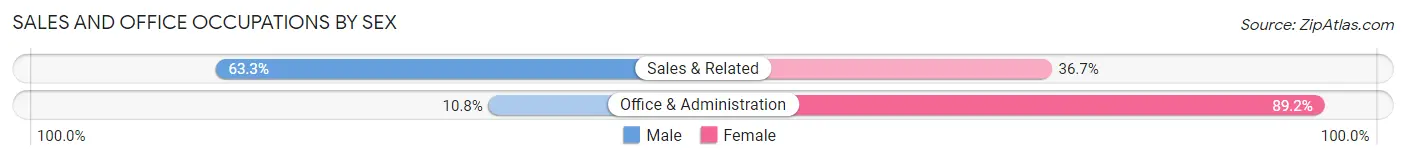
| Occupation | Male | Female |
| Sales & Related | 31 (63.3%) | 18 (36.7%) |
| Office & Administration | 7 (10.8%) | 58 (89.2%) |
| Total (Category) | 38 (33.3%) | 76 (66.7%) |
| Total (Overall) | 267 (51.8%) | 248 (48.2%) |
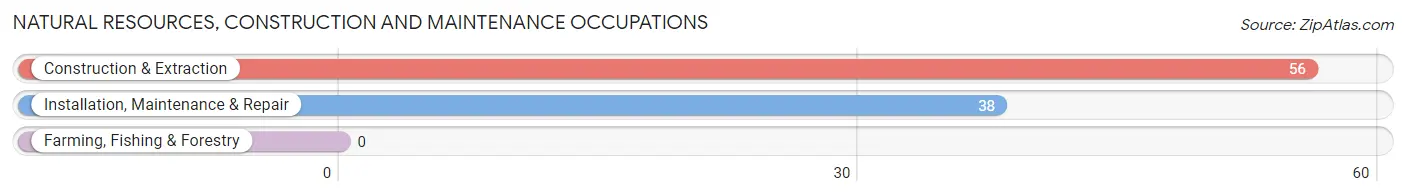
Natural Resources, Construction and Maintenance Occupations
The most common Natural Resources, Construction and Maintenance occupations in Mountain View are Construction & Extraction (56 | 10.9%), and Installation, Maintenance & Repair (38 | 7.4%).
Natural Resources, Construction and Maintenance Occupations by Sex
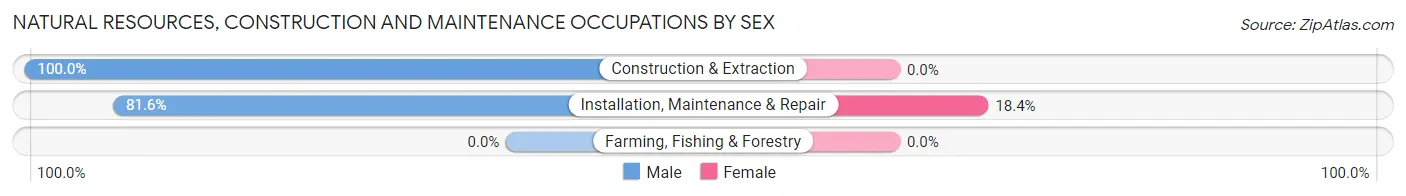
| Occupation | Male | Female |
| Farming, Fishing & Forestry | 0 (0.0%) | 0 (0.0%) |
| Construction & Extraction | 56 (100.0%) | 0 (0.0%) |
| Installation, Maintenance & Repair | 31 (81.6%) | 7 (18.4%) |
| Total (Category) | 87 (92.5%) | 7 (7.4%) |
| Total (Overall) | 267 (51.8%) | 248 (48.2%) |
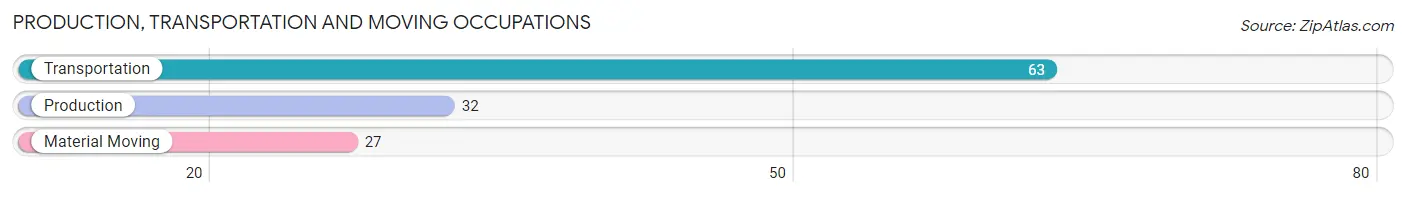
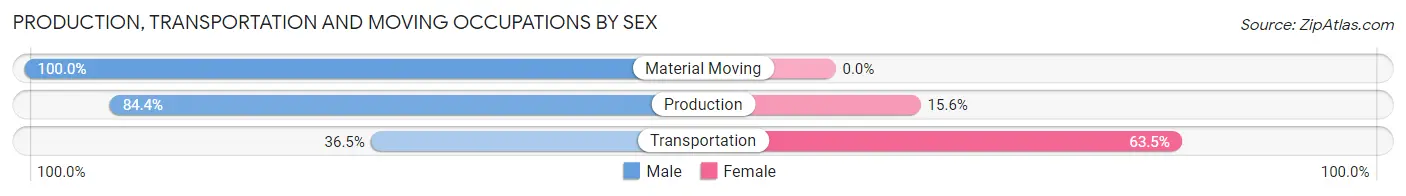
Production, Transportation and Moving Occupations
The most common Production, Transportation and Moving occupations in Mountain View are Transportation (63 | 12.2%), Production (32 | 6.2%), and Material Moving (27 | 5.2%).
Production, Transportation and Moving Occupations by Sex
| Occupation | Male | Female |
| Production | 27 (84.4%) | 5 (15.6%) |
| Transportation | 23 (36.5%) | 40 (63.5%) |
| Material Moving | 27 (100.0%) | 0 (0.0%) |
| Total (Category) | 77 (63.1%) | 45 (36.9%) |
| Total (Overall) | 267 (51.8%) | 248 (48.2%) |
Employment Industries by Sex in Mountain View
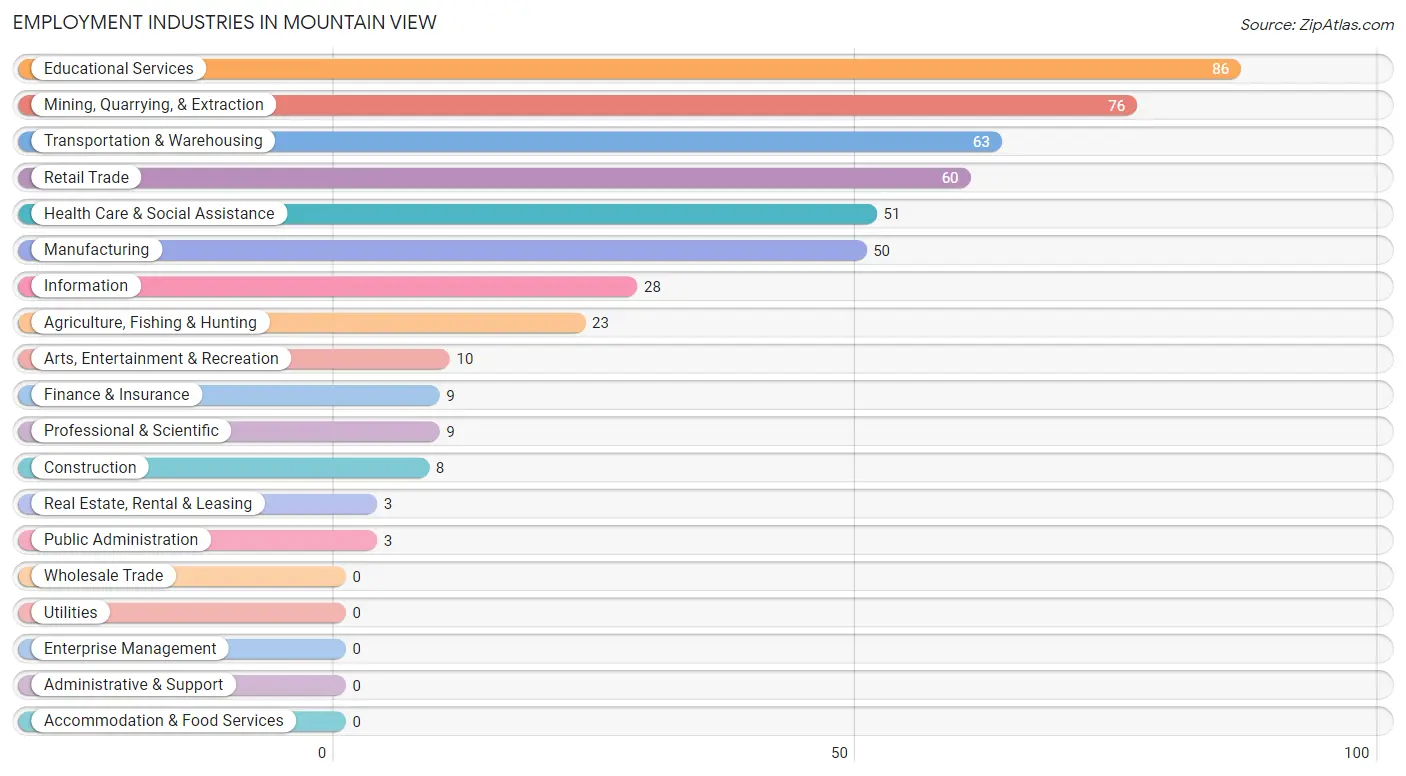
Employment Industries in Mountain View
The major employment industries in Mountain View include Educational Services (86 | 16.7%), Mining, Quarrying, & Extraction (76 | 14.8%), Transportation & Warehousing (63 | 12.2%), Retail Trade (60 | 11.7%), and Health Care & Social Assistance (51 | 9.9%).
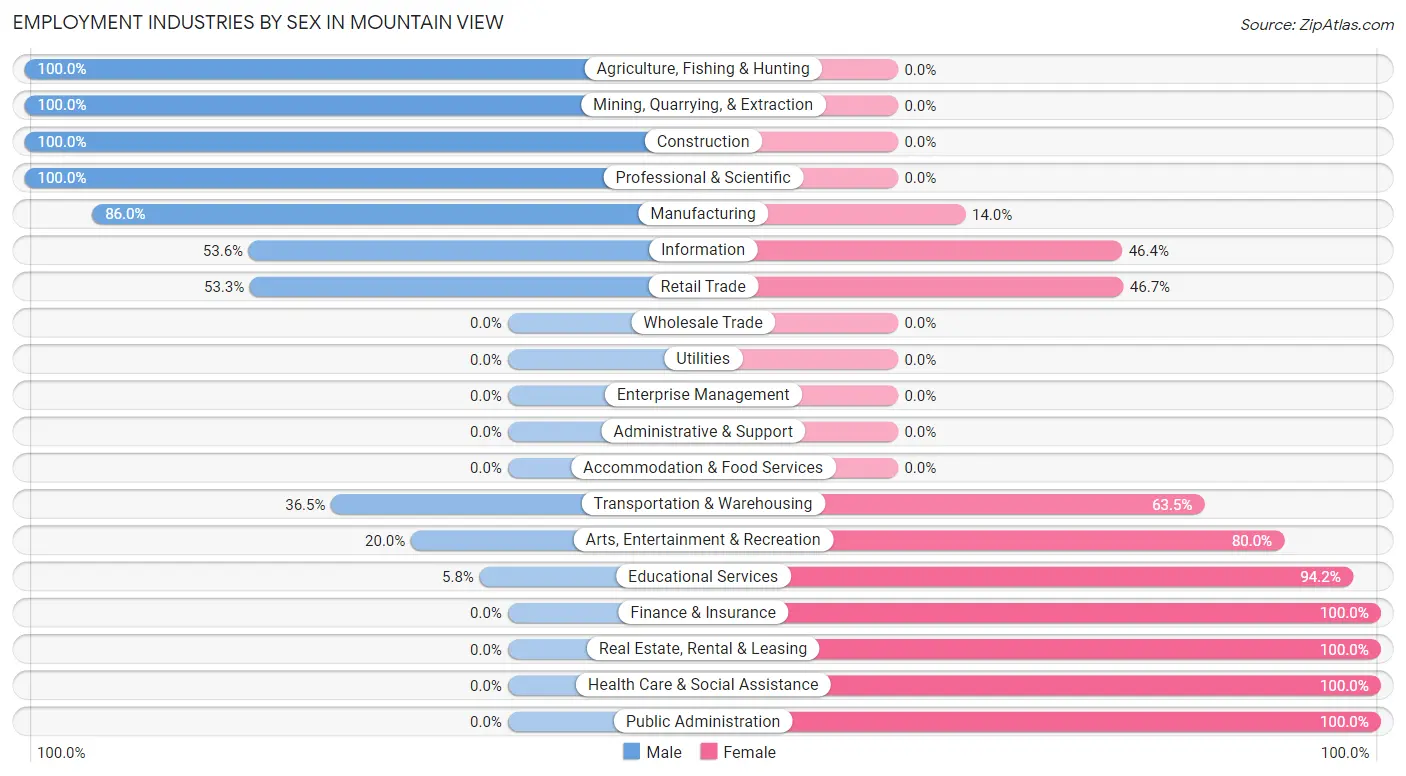
Employment Industries by Sex in Mountain View
The Mountain View industries that see more men than women are Agriculture, Fishing & Hunting (100.0%), Mining, Quarrying, & Extraction (100.0%), and Construction (100.0%), whereas the industries that tend to have a higher number of women are Finance & Insurance (100.0%), Real Estate, Rental & Leasing (100.0%), and Health Care & Social Assistance (100.0%).
| Industry | Male | Female |
| Agriculture, Fishing & Hunting | 23 (100.0%) | 0 (0.0%) |
| Mining, Quarrying, & Extraction | 76 (100.0%) | 0 (0.0%) |
| Construction | 8 (100.0%) | 0 (0.0%) |
| Manufacturing | 43 (86.0%) | 7 (14.0%) |
| Wholesale Trade | 0 (0.0%) | 0 (0.0%) |
| Retail Trade | 32 (53.3%) | 28 (46.7%) |
| Transportation & Warehousing | 23 (36.5%) | 40 (63.5%) |
| Utilities | 0 (0.0%) | 0 (0.0%) |
| Information | 15 (53.6%) | 13 (46.4%) |
| Finance & Insurance | 0 (0.0%) | 9 (100.0%) |
| Real Estate, Rental & Leasing | 0 (0.0%) | 3 (100.0%) |
| Professional & Scientific | 9 (100.0%) | 0 (0.0%) |
| Enterprise Management | 0 (0.0%) | 0 (0.0%) |
| Administrative & Support | 0 (0.0%) | 0 (0.0%) |
| Educational Services | 5 (5.8%) | 81 (94.2%) |
| Health Care & Social Assistance | 0 (0.0%) | 51 (100.0%) |
| Arts, Entertainment & Recreation | 2 (20.0%) | 8 (80.0%) |
| Accommodation & Food Services | 0 (0.0%) | 0 (0.0%) |
| Public Administration | 0 (0.0%) | 3 (100.0%) |
| Total | 267 (51.8%) | 248 (48.2%) |
Education in Mountain View
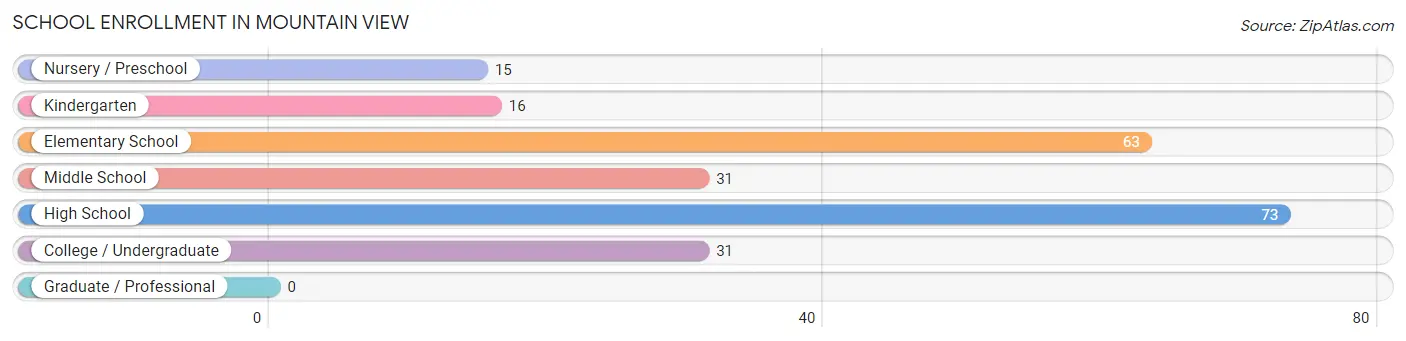
School Enrollment in Mountain View
The most common levels of schooling among the 229 students in Mountain View are high school (73 | 31.9%), elementary school (63 | 27.5%), and middle school (31 | 13.5%).
| School Level | # Students | % Students |
| Nursery / Preschool | 15 | 6.6% |
| Kindergarten | 16 | 7.0% |
| Elementary School | 63 | 27.5% |
| Middle School | 31 | 13.5% |
| High School | 73 | 31.9% |
| College / Undergraduate | 31 | 13.5% |
| Graduate / Professional | 0 | 0.0% |
| Total | 229 | 100.0% |
School Enrollment by Age by Funding Source in Mountain View
Out of a total of 229 students who are enrolled in schools in Mountain View, 9 (3.9%) attend a private institution, while the remaining 220 (96.1%) are enrolled in public schools. The age group of 3 to 4 year olds has the highest likelihood of being enrolled in private schools, with 9 (60.0% in the age bracket) enrolled. Conversely, the age group of 5 to 9 year old has the lowest likelihood of being enrolled in a private school, with 49 (100.0% in the age bracket) attending a public institution.
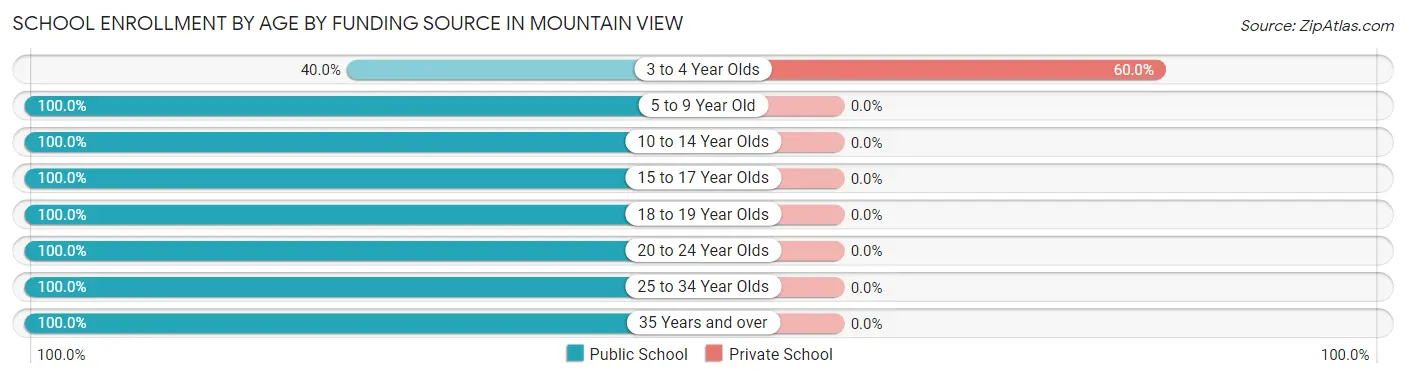
| Age Bracket | Public School | Private School |
| 3 to 4 Year Olds | 6 (40.0%) | 9 (60.0%) |
| 5 to 9 Year Old | 49 (100.0%) | 0 (0.0%) |
| 10 to 14 Year Olds | 65 (100.0%) | 0 (0.0%) |
| 15 to 17 Year Olds | 55 (100.0%) | 0 (0.0%) |
| 18 to 19 Year Olds | 7 (100.0%) | 0 (0.0%) |
| 20 to 24 Year Olds | 4 (100.0%) | 0 (0.0%) |
| 25 to 34 Year Olds | 13 (100.0%) | 0 (0.0%) |
| 35 Years and over | 21 (100.0%) | 0 (0.0%) |
| Total | 220 (96.1%) | 9 (3.9%) |
Educational Attainment by Field of Study in Mountain View
Engineering (21 | 33.9%), education (10 | 16.1%), visual & performing arts (10 | 16.1%), bio, nature & agricultural (7 | 11.3%), and social sciences (6 | 9.7%) are the most common fields of study among 62 individuals in Mountain View who have obtained a bachelor's degree or higher.
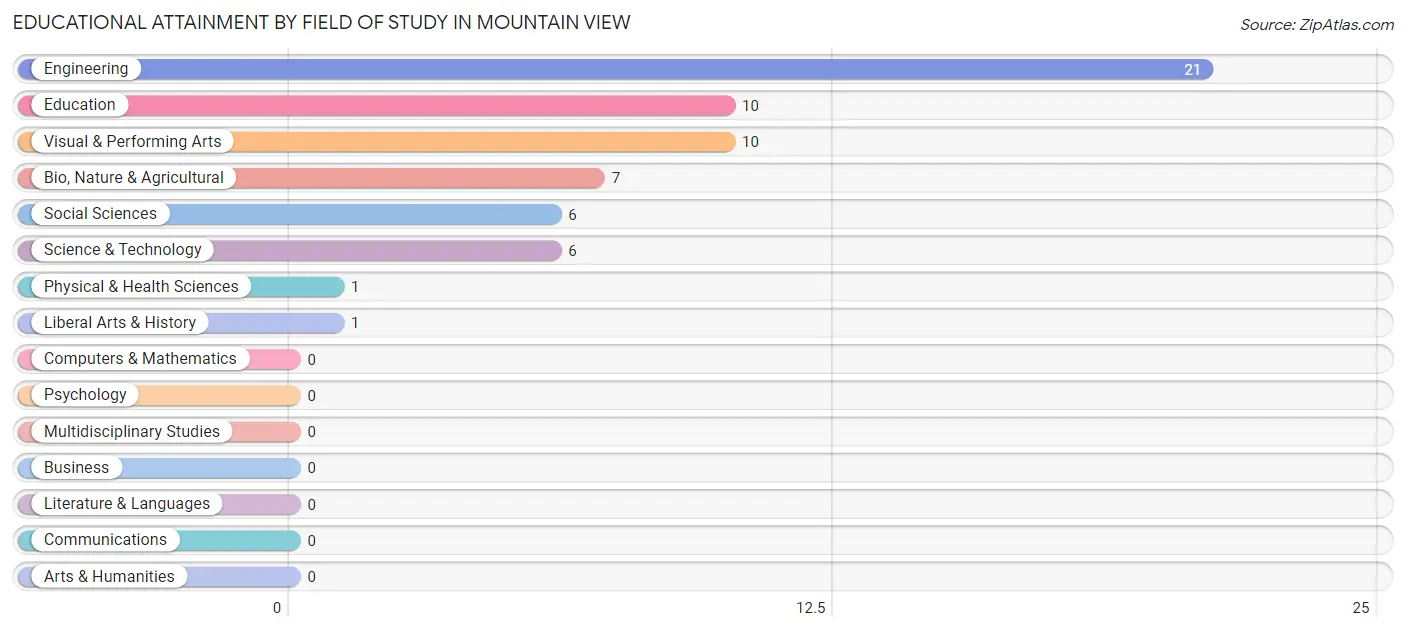
| Field of Study | # Graduates | % Graduates |
| Computers & Mathematics | 0 | 0.0% |
| Bio, Nature & Agricultural | 7 | 11.3% |
| Physical & Health Sciences | 1 | 1.6% |
| Psychology | 0 | 0.0% |
| Social Sciences | 6 | 9.7% |
| Engineering | 21 | 33.9% |
| Multidisciplinary Studies | 0 | 0.0% |
| Science & Technology | 6 | 9.7% |
| Business | 0 | 0.0% |
| Education | 10 | 16.1% |
| Literature & Languages | 0 | 0.0% |
| Liberal Arts & History | 1 | 1.6% |
| Visual & Performing Arts | 10 | 16.1% |
| Communications | 0 | 0.0% |
| Arts & Humanities | 0 | 0.0% |
| Total | 62 | 100.0% |
Transportation & Commute in Mountain View
Vehicle Availability by Sex in Mountain View
The most prevalent vehicle ownership categories in Mountain View are males with 3 vehicles (126, accounting for 48.5%) and females with 3 vehicles (53, making up 52.1%).
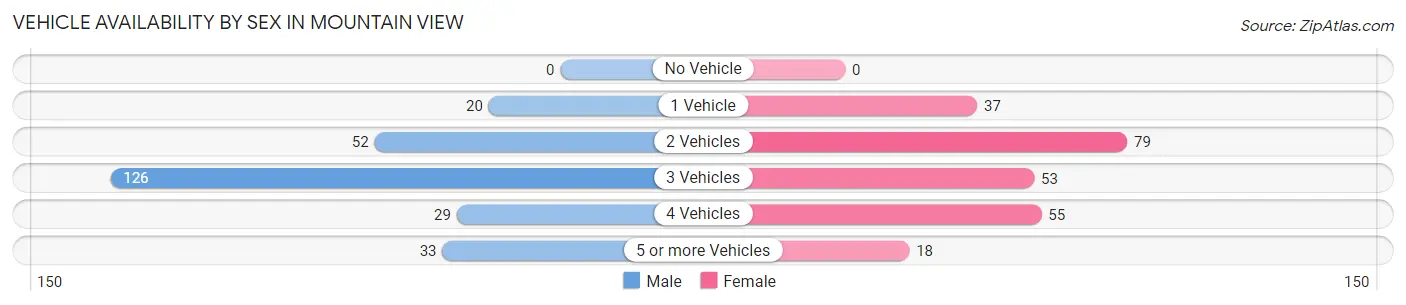
| Vehicles Available | Male | Female |
| No Vehicle | 0 (0.0%) | 0 (0.0%) |
| 1 Vehicle | 20 (7.7%) | 37 (15.3%) |
| 2 Vehicles | 52 (20.0%) | 79 (32.6%) |
| 3 Vehicles | 126 (48.5%) | 53 (21.9%) |
| 4 Vehicles | 29 (11.2%) | 55 (22.7%) |
| 5 or more Vehicles | 33 (12.7%) | 18 (7.4%) |
| Total | 260 (100.0%) | 242 (100.0%) |
Commute Time in Mountain View
The most frequently occuring commute durations in Mountain View are 5 to 9 minutes (186 commuters, 38.8%), 45 to 59 minutes (74 commuters, 15.4%), and less than 5 minutes (71 commuters, 14.8%).
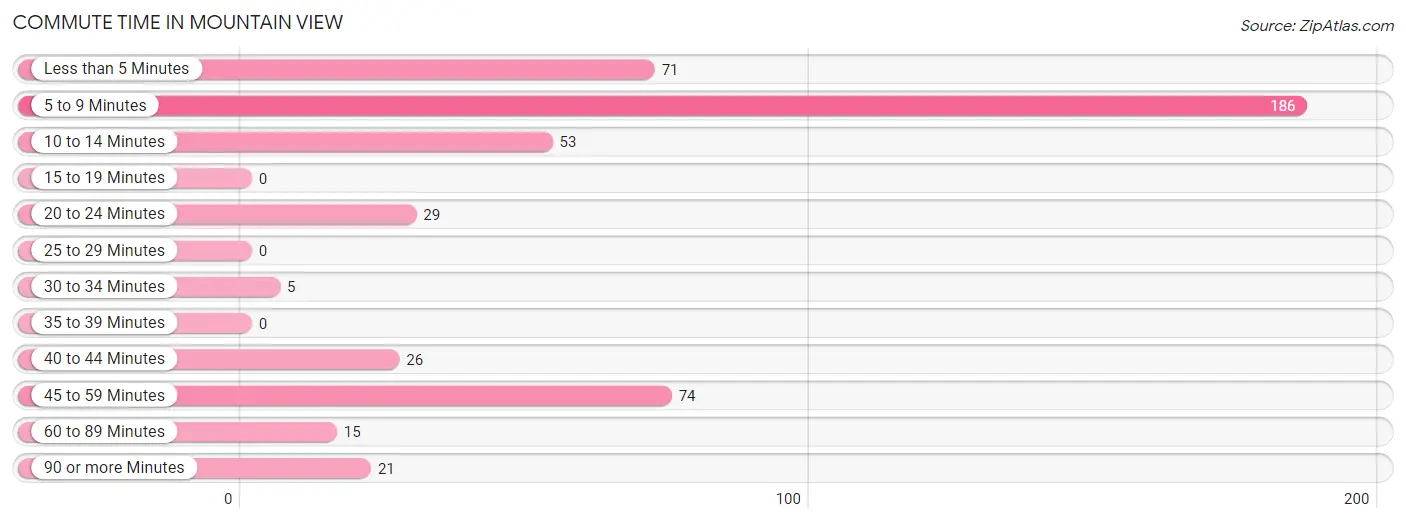
| Commute Time | # Commuters | % Commuters |
| Less than 5 Minutes | 71 | 14.8% |
| 5 to 9 Minutes | 186 | 38.8% |
| 10 to 14 Minutes | 53 | 11.0% |
| 15 to 19 Minutes | 0 | 0.0% |
| 20 to 24 Minutes | 29 | 6.0% |
| 25 to 29 Minutes | 0 | 0.0% |
| 30 to 34 Minutes | 5 | 1.0% |
| 35 to 39 Minutes | 0 | 0.0% |
| 40 to 44 Minutes | 26 | 5.4% |
| 45 to 59 Minutes | 74 | 15.4% |
| 60 to 89 Minutes | 15 | 3.1% |
| 90 or more Minutes | 21 | 4.4% |
Commute Time by Sex in Mountain View
The most common commute times in Mountain View are 45 to 59 minutes (70 commuters, 27.9%) for males and 5 to 9 minutes (131 commuters, 57.2%) for females.
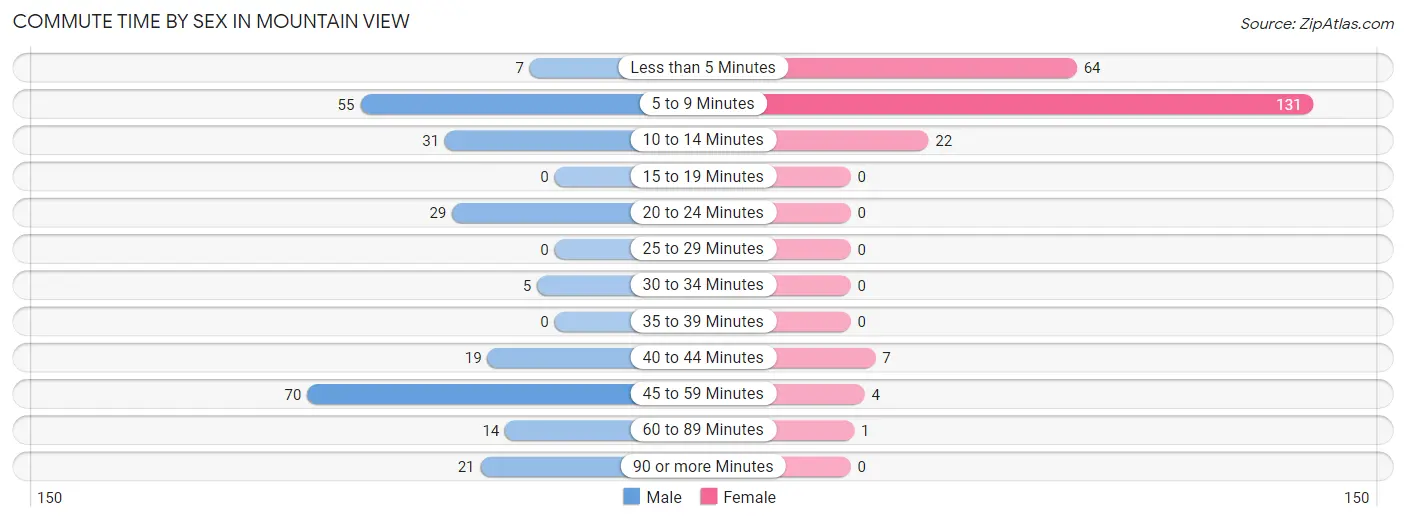
| Commute Time | Male | Female |
| Less than 5 Minutes | 7 (2.8%) | 64 (28.0%) |
| 5 to 9 Minutes | 55 (21.9%) | 131 (57.2%) |
| 10 to 14 Minutes | 31 (12.3%) | 22 (9.6%) |
| 15 to 19 Minutes | 0 (0.0%) | 0 (0.0%) |
| 20 to 24 Minutes | 29 (11.6%) | 0 (0.0%) |
| 25 to 29 Minutes | 0 (0.0%) | 0 (0.0%) |
| 30 to 34 Minutes | 5 (2.0%) | 0 (0.0%) |
| 35 to 39 Minutes | 0 (0.0%) | 0 (0.0%) |
| 40 to 44 Minutes | 19 (7.6%) | 7 (3.1%) |
| 45 to 59 Minutes | 70 (27.9%) | 4 (1.8%) |
| 60 to 89 Minutes | 14 (5.6%) | 1 (0.4%) |
| 90 or more Minutes | 21 (8.4%) | 0 (0.0%) |
Time of Departure to Work by Sex in Mountain View
The most frequent times of departure to work in Mountain View are 12:00 PM to 3:59 PM (45, 17.9%) for males and 7:30 AM to 7:59 AM (112, 48.9%) for females.
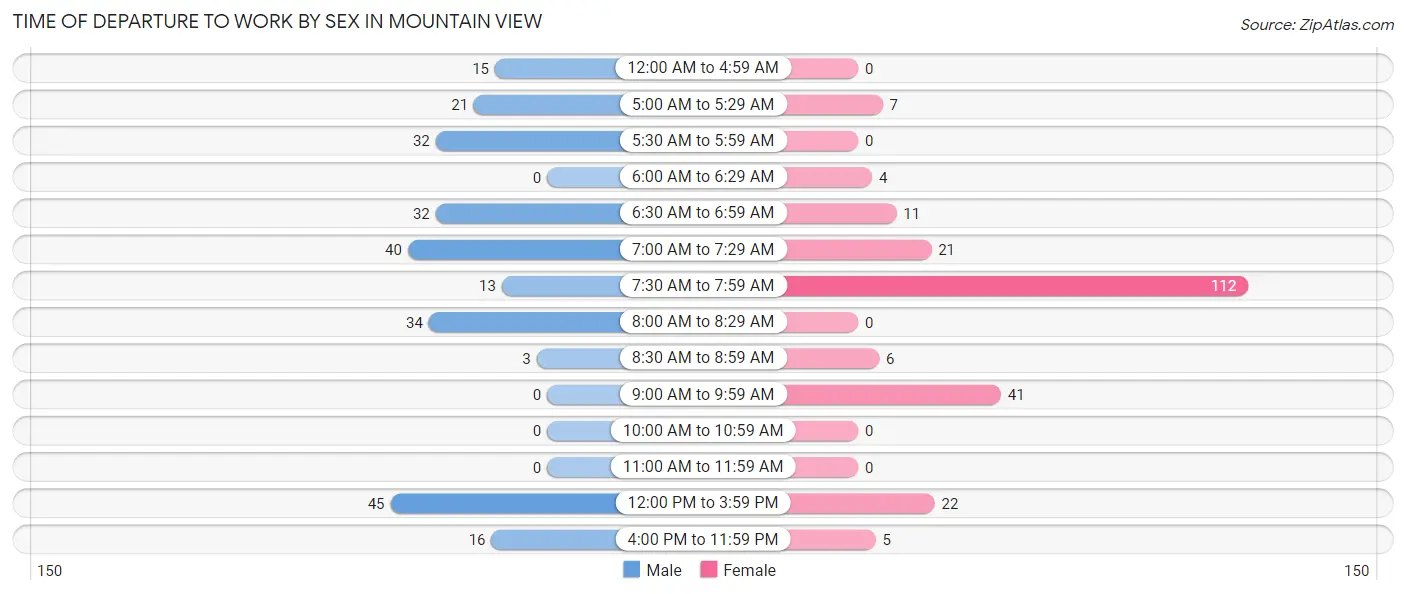
| Time of Departure | Male | Female |
| 12:00 AM to 4:59 AM | 15 (6.0%) | 0 (0.0%) |
| 5:00 AM to 5:29 AM | 21 (8.4%) | 7 (3.1%) |
| 5:30 AM to 5:59 AM | 32 (12.8%) | 0 (0.0%) |
| 6:00 AM to 6:29 AM | 0 (0.0%) | 4 (1.8%) |
| 6:30 AM to 6:59 AM | 32 (12.8%) | 11 (4.8%) |
| 7:00 AM to 7:29 AM | 40 (15.9%) | 21 (9.2%) |
| 7:30 AM to 7:59 AM | 13 (5.2%) | 112 (48.9%) |
| 8:00 AM to 8:29 AM | 34 (13.6%) | 0 (0.0%) |
| 8:30 AM to 8:59 AM | 3 (1.2%) | 6 (2.6%) |
| 9:00 AM to 9:59 AM | 0 (0.0%) | 41 (17.9%) |
| 10:00 AM to 10:59 AM | 0 (0.0%) | 0 (0.0%) |
| 11:00 AM to 11:59 AM | 0 (0.0%) | 0 (0.0%) |
| 12:00 PM to 3:59 PM | 45 (17.9%) | 22 (9.6%) |
| 4:00 PM to 11:59 PM | 16 (6.4%) | 5 (2.2%) |
| Total | 251 (100.0%) | 229 (100.0%) |
Housing Occupancy in Mountain View
Occupancy by Ownership in Mountain View
Of the total 419 dwellings in Mountain View, owner-occupied units account for 270 (64.4%), while renter-occupied units make up 149 (35.6%).
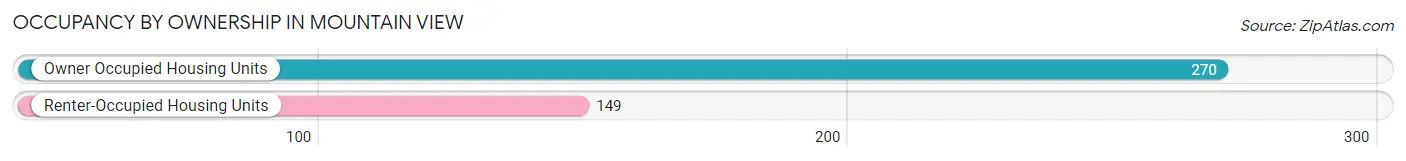
| Occupancy | # Housing Units | % Housing Units |
| Owner Occupied Housing Units | 270 | 64.4% |
| Renter-Occupied Housing Units | 149 | 35.6% |
| Total Occupied Housing Units | 419 | 100.0% |
Occupancy by Household Size in Mountain View
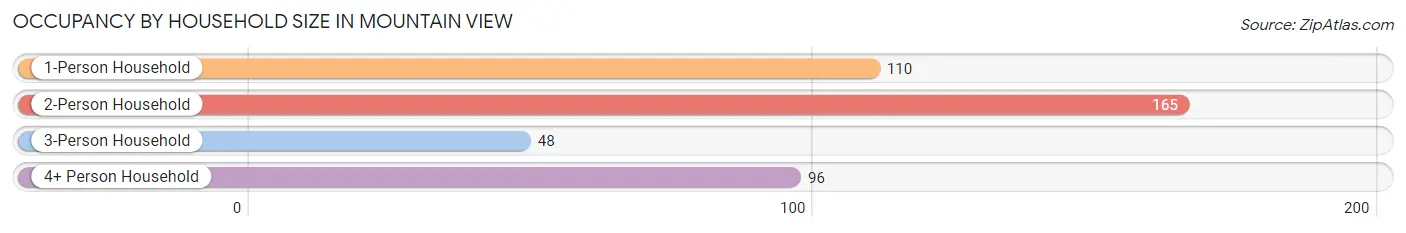
| Household Size | # Housing Units | % Housing Units |
| 1-Person Household | 110 | 26.3% |
| 2-Person Household | 165 | 39.4% |
| 3-Person Household | 48 | 11.5% |
| 4+ Person Household | 96 | 22.9% |
| Total Housing Units | 419 | 100.0% |
Occupancy by Ownership by Household Size in Mountain View
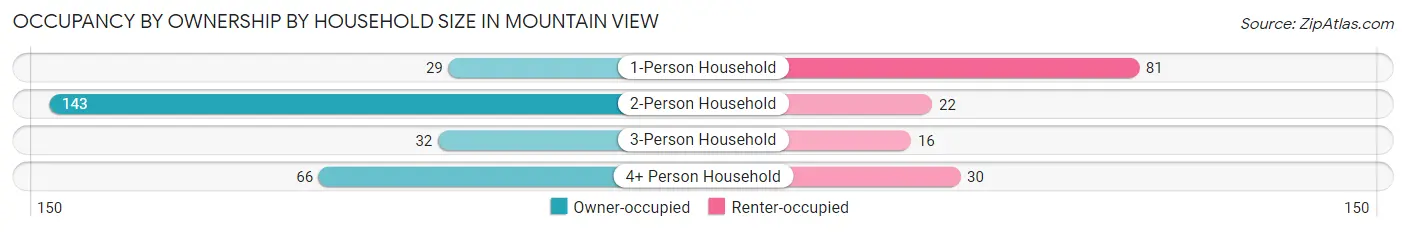
| Household Size | Owner-occupied | Renter-occupied |
| 1-Person Household | 29 (26.4%) | 81 (73.6%) |
| 2-Person Household | 143 (86.7%) | 22 (13.3%) |
| 3-Person Household | 32 (66.7%) | 16 (33.3%) |
| 4+ Person Household | 66 (68.8%) | 30 (31.2%) |
| Total Housing Units | 270 (64.4%) | 149 (35.6%) |
Occupancy by Educational Attainment in Mountain View
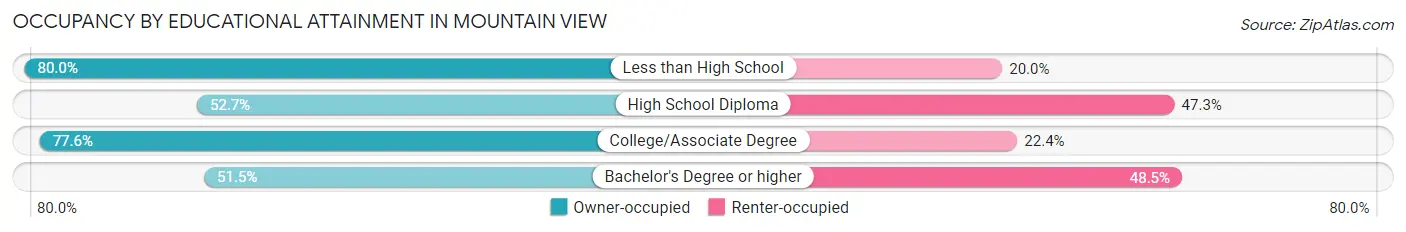
| Household Size | Owner-occupied | Renter-occupied |
| Less than High School | 12 (80.0%) | 3 (20.0%) |
| High School Diploma | 99 (52.7%) | 89 (47.3%) |
| College/Associate Degree | 142 (77.6%) | 41 (22.4%) |
| Bachelor's Degree or higher | 17 (51.5%) | 16 (48.5%) |
Occupancy by Age of Householder in Mountain View
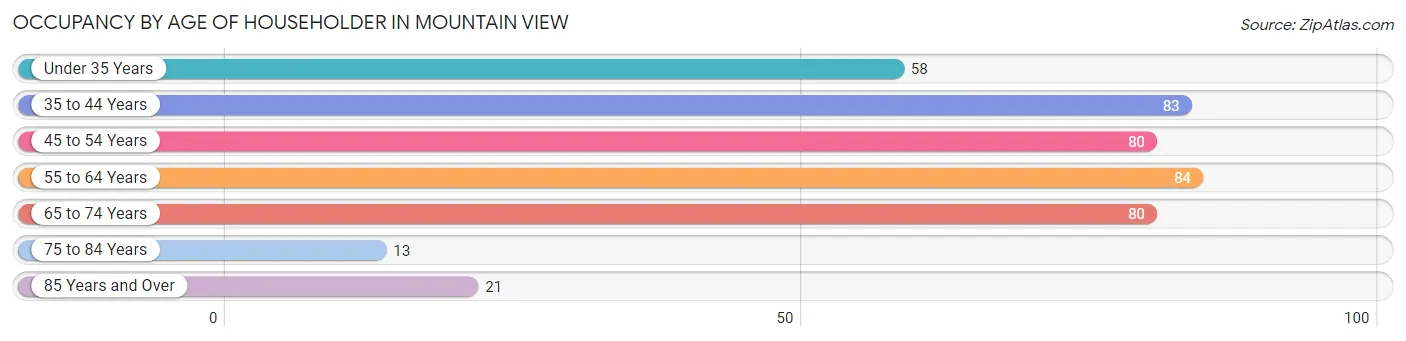
| Age Bracket | # Households | % Households |
| Under 35 Years | 58 | 13.8% |
| 35 to 44 Years | 83 | 19.8% |
| 45 to 54 Years | 80 | 19.1% |
| 55 to 64 Years | 84 | 20.1% |
| 65 to 74 Years | 80 | 19.1% |
| 75 to 84 Years | 13 | 3.1% |
| 85 Years and Over | 21 | 5.0% |
| Total | 419 | 100.0% |
Housing Finances in Mountain View
Median Income by Occupancy in Mountain View
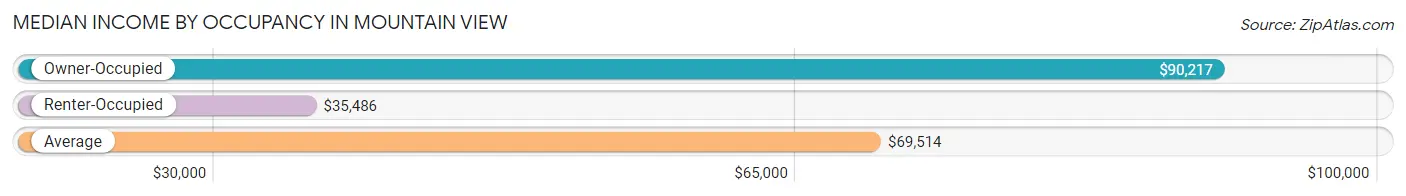
| Occupancy Type | # Households | Median Income |
| Owner-Occupied | 270 (64.4%) | $90,217 |
| Renter-Occupied | 149 (35.6%) | $35,486 |
| Average | 419 (100.0%) | $69,514 |
Occupancy by Householder Income Bracket in Mountain View
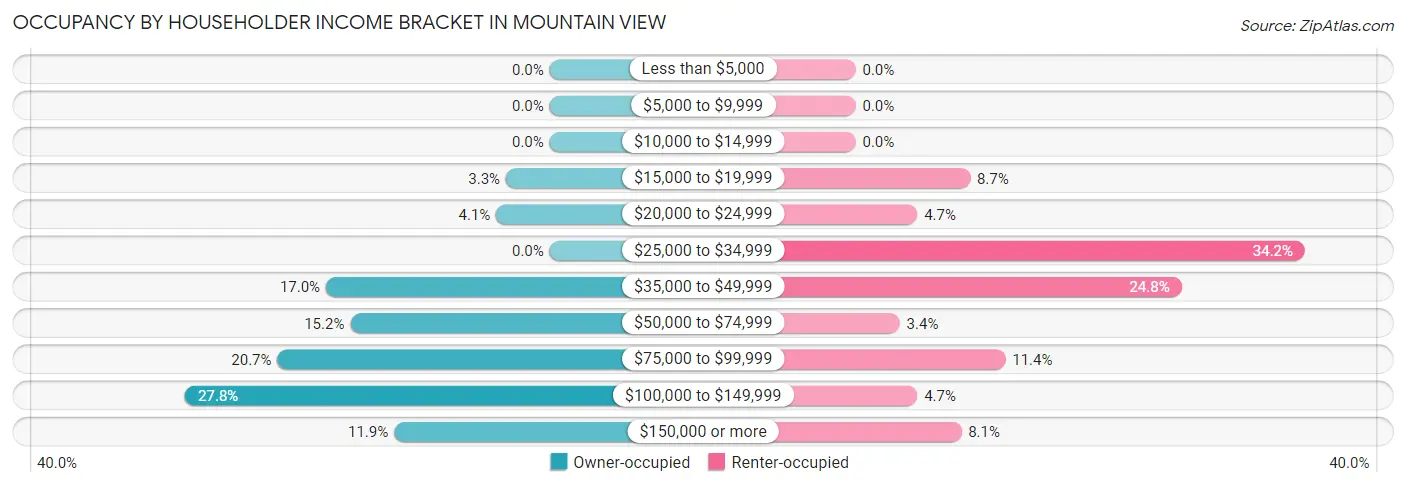
| Income Bracket | Owner-occupied | Renter-occupied |
| Less than $5,000 | 0 (0.0%) | 0 (0.0%) |
| $5,000 to $9,999 | 0 (0.0%) | 0 (0.0%) |
| $10,000 to $14,999 | 0 (0.0%) | 0 (0.0%) |
| $15,000 to $19,999 | 9 (3.3%) | 13 (8.7%) |
| $20,000 to $24,999 | 11 (4.1%) | 7 (4.7%) |
| $25,000 to $34,999 | 0 (0.0%) | 51 (34.2%) |
| $35,000 to $49,999 | 46 (17.0%) | 37 (24.8%) |
| $50,000 to $74,999 | 41 (15.2%) | 5 (3.4%) |
| $75,000 to $99,999 | 56 (20.7%) | 17 (11.4%) |
| $100,000 to $149,999 | 75 (27.8%) | 7 (4.7%) |
| $150,000 or more | 32 (11.8%) | 12 (8.1%) |
| Total | 270 (100.0%) | 149 (100.0%) |
Monthly Housing Cost Tiers in Mountain View
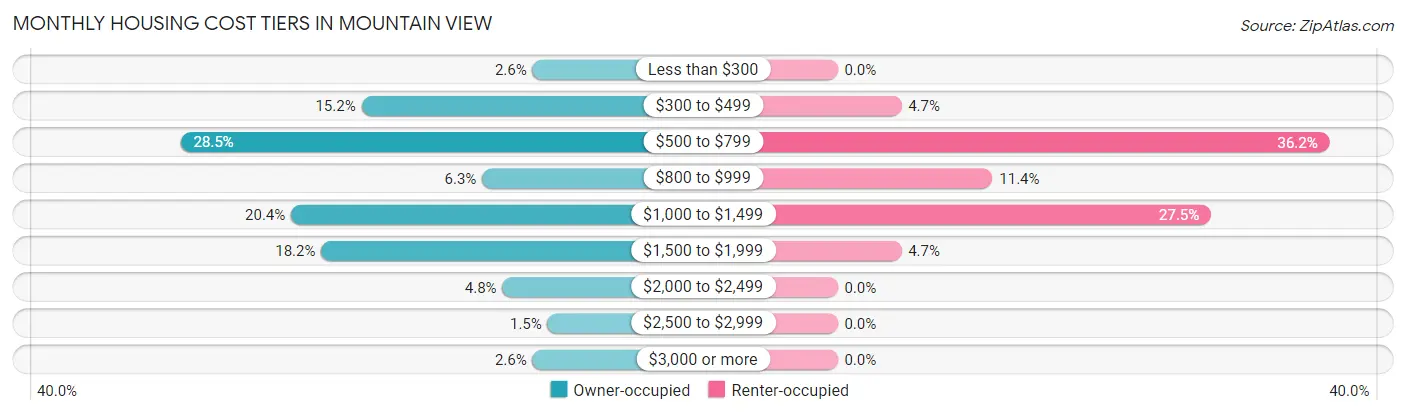
| Monthly Cost | Owner-occupied | Renter-occupied |
| Less than $300 | 7 (2.6%) | 0 (0.0%) |
| $300 to $499 | 41 (15.2%) | 7 (4.7%) |
| $500 to $799 | 77 (28.5%) | 54 (36.2%) |
| $800 to $999 | 17 (6.3%) | 17 (11.4%) |
| $1,000 to $1,499 | 55 (20.4%) | 41 (27.5%) |
| $1,500 to $1,999 | 49 (18.1%) | 7 (4.7%) |
| $2,000 to $2,499 | 13 (4.8%) | 0 (0.0%) |
| $2,500 to $2,999 | 4 (1.5%) | 0 (0.0%) |
| $3,000 or more | 7 (2.6%) | 0 (0.0%) |
| Total | 270 (100.0%) | 149 (100.0%) |
Physical Housing Characteristics in Mountain View
Housing Structures in Mountain View
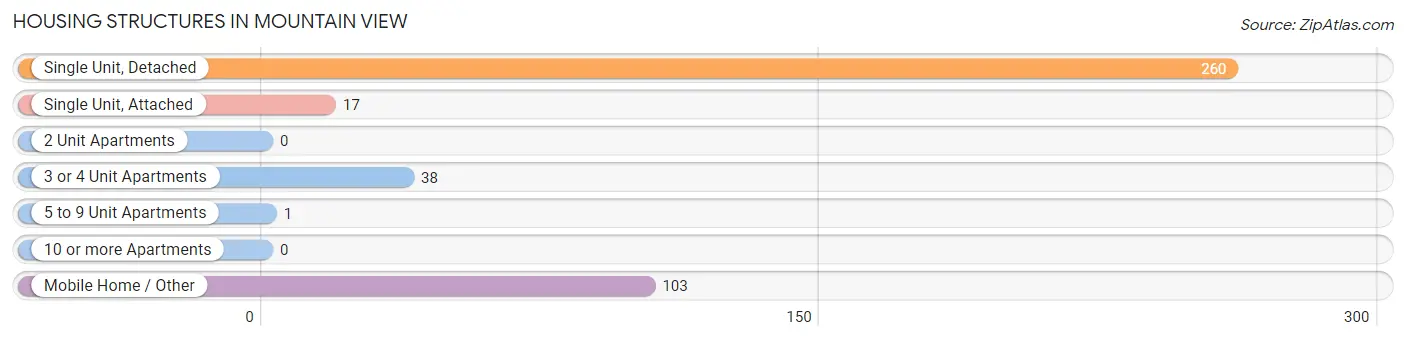
| Structure Type | # Housing Units | % Housing Units |
| Single Unit, Detached | 260 | 62.1% |
| Single Unit, Attached | 17 | 4.1% |
| 2 Unit Apartments | 0 | 0.0% |
| 3 or 4 Unit Apartments | 38 | 9.1% |
| 5 to 9 Unit Apartments | 1 | 0.2% |
| 10 or more Apartments | 0 | 0.0% |
| Mobile Home / Other | 103 | 24.6% |
| Total | 419 | 100.0% |
Housing Structures by Occupancy in Mountain View
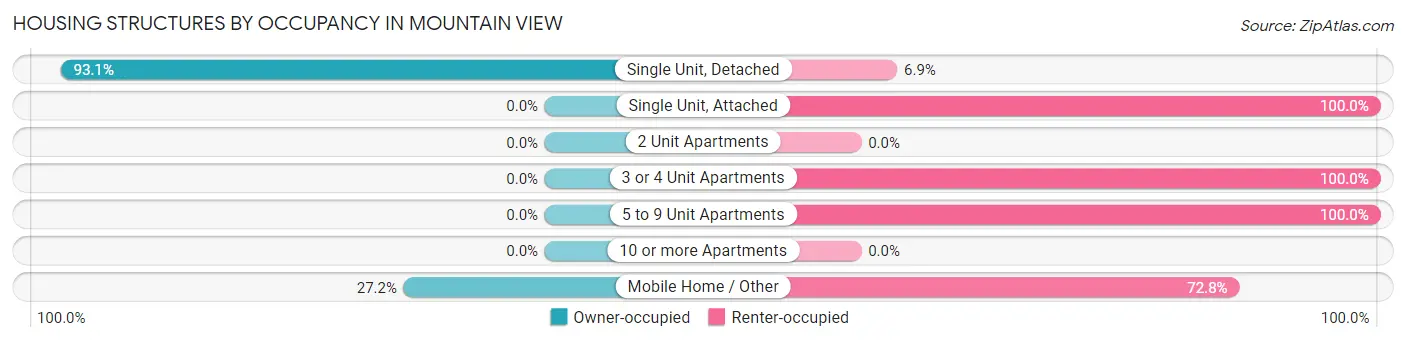
| Structure Type | Owner-occupied | Renter-occupied |
| Single Unit, Detached | 242 (93.1%) | 18 (6.9%) |
| Single Unit, Attached | 0 (0.0%) | 17 (100.0%) |
| 2 Unit Apartments | 0 (0.0%) | 0 (0.0%) |
| 3 or 4 Unit Apartments | 0 (0.0%) | 38 (100.0%) |
| 5 to 9 Unit Apartments | 0 (0.0%) | 1 (100.0%) |
| 10 or more Apartments | 0 (0.0%) | 0 (0.0%) |
| Mobile Home / Other | 28 (27.2%) | 75 (72.8%) |
| Total | 270 (64.4%) | 149 (35.6%) |
Housing Structures by Number of Rooms in Mountain View
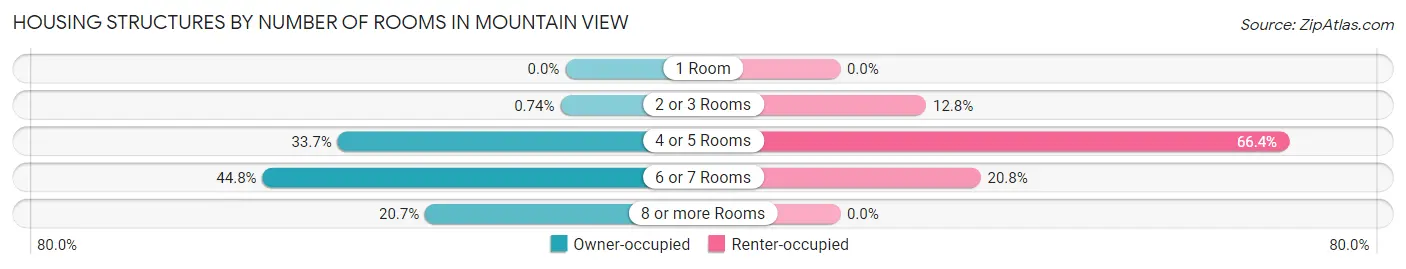
| Number of Rooms | Owner-occupied | Renter-occupied |
| 1 Room | 0 (0.0%) | 0 (0.0%) |
| 2 or 3 Rooms | 2 (0.7%) | 19 (12.8%) |
| 4 or 5 Rooms | 91 (33.7%) | 99 (66.4%) |
| 6 or 7 Rooms | 121 (44.8%) | 31 (20.8%) |
| 8 or more Rooms | 56 (20.7%) | 0 (0.0%) |
| Total | 270 (100.0%) | 149 (100.0%) |
Housing Structure by Heating Type in Mountain View
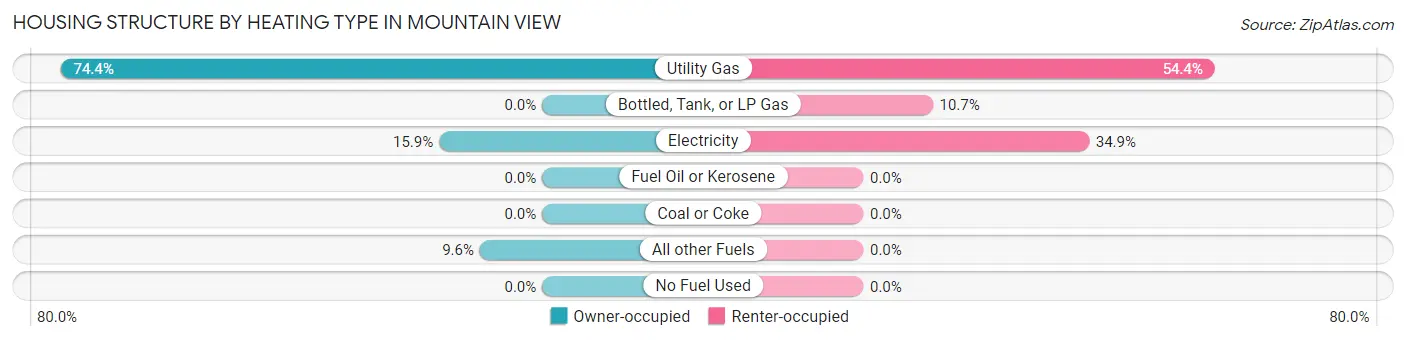
| Heating Type | Owner-occupied | Renter-occupied |
| Utility Gas | 201 (74.4%) | 81 (54.4%) |
| Bottled, Tank, or LP Gas | 0 (0.0%) | 16 (10.7%) |
| Electricity | 43 (15.9%) | 52 (34.9%) |
| Fuel Oil or Kerosene | 0 (0.0%) | 0 (0.0%) |
| Coal or Coke | 0 (0.0%) | 0 (0.0%) |
| All other Fuels | 26 (9.6%) | 0 (0.0%) |
| No Fuel Used | 0 (0.0%) | 0 (0.0%) |
| Total | 270 (100.0%) | 149 (100.0%) |
Household Vehicle Usage in Mountain View
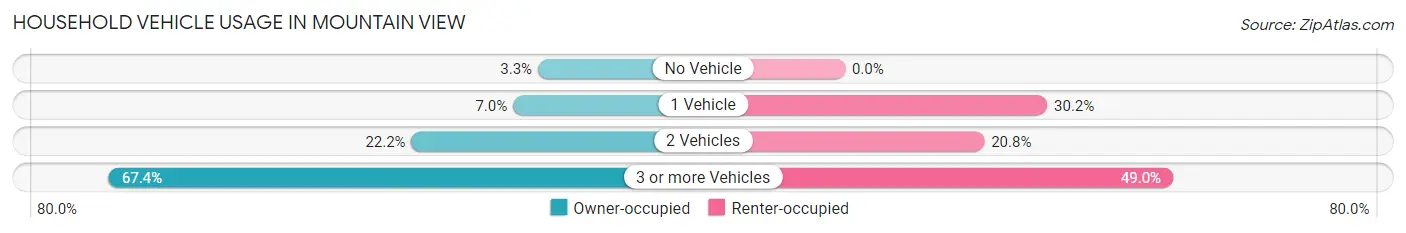
| Vehicles per Household | Owner-occupied | Renter-occupied |
| No Vehicle | 9 (3.3%) | 0 (0.0%) |
| 1 Vehicle | 19 (7.0%) | 45 (30.2%) |
| 2 Vehicles | 60 (22.2%) | 31 (20.8%) |
| 3 or more Vehicles | 182 (67.4%) | 73 (49.0%) |
| Total | 270 (100.0%) | 149 (100.0%) |
Real Estate & Mortgages in Mountain View
Real Estate and Mortgage Overview in Mountain View
| Characteristic | Without Mortgage | With Mortgage |
| Housing Units | 107 | 163 |
| Median Property Value | $269,600 | $221,700 |
| Median Household Income | $74,821 | $25 |
| Monthly Housing Costs | $518 | $7 |
| Real Estate Taxes | $1,345 | $0 |
Property Value by Mortgage Status in Mountain View
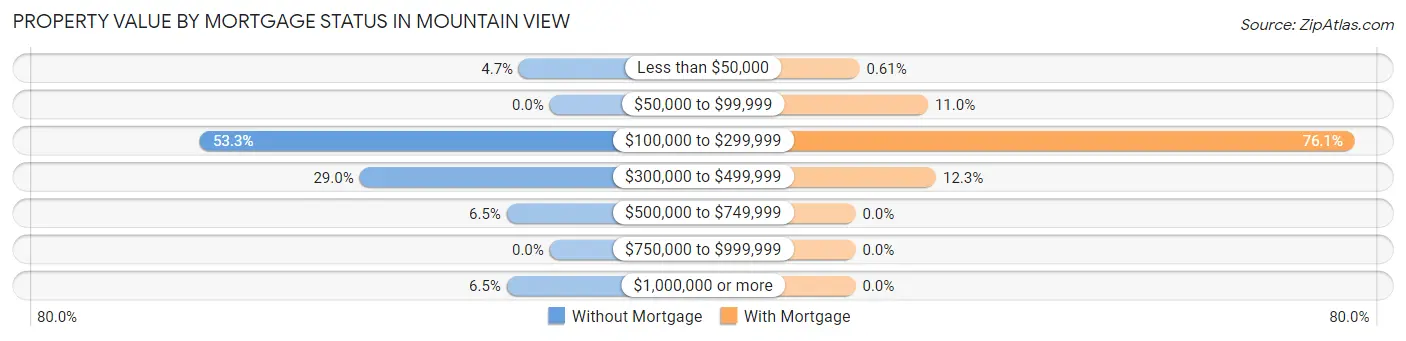
| Property Value | Without Mortgage | With Mortgage |
| Less than $50,000 | 5 (4.7%) | 1 (0.6%) |
| $50,000 to $99,999 | 0 (0.0%) | 18 (11.0%) |
| $100,000 to $299,999 | 57 (53.3%) | 124 (76.1%) |
| $300,000 to $499,999 | 31 (29.0%) | 20 (12.3%) |
| $500,000 to $749,999 | 7 (6.5%) | 0 (0.0%) |
| $750,000 to $999,999 | 0 (0.0%) | 0 (0.0%) |
| $1,000,000 or more | 7 (6.5%) | 0 (0.0%) |
| Total | 107 (100.0%) | 163 (100.0%) |
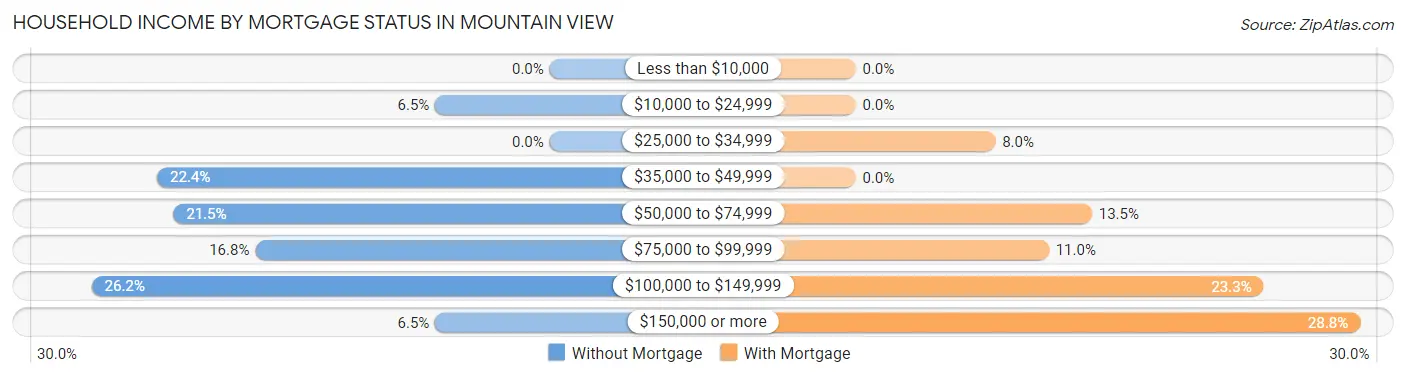
Household Income by Mortgage Status in Mountain View
| Household Income | Without Mortgage | With Mortgage |
| Less than $10,000 | 0 (0.0%) | 0 (0.0%) |
| $10,000 to $24,999 | 7 (6.5%) | 0 (0.0%) |
| $25,000 to $34,999 | 0 (0.0%) | 13 (8.0%) |
| $35,000 to $49,999 | 24 (22.4%) | 0 (0.0%) |
| $50,000 to $74,999 | 23 (21.5%) | 22 (13.5%) |
| $75,000 to $99,999 | 18 (16.8%) | 18 (11.0%) |
| $100,000 to $149,999 | 28 (26.2%) | 38 (23.3%) |
| $150,000 or more | 7 (6.5%) | 47 (28.8%) |
| Total | 107 (100.0%) | 163 (100.0%) |
Property Value to Household Income Ratio in Mountain View
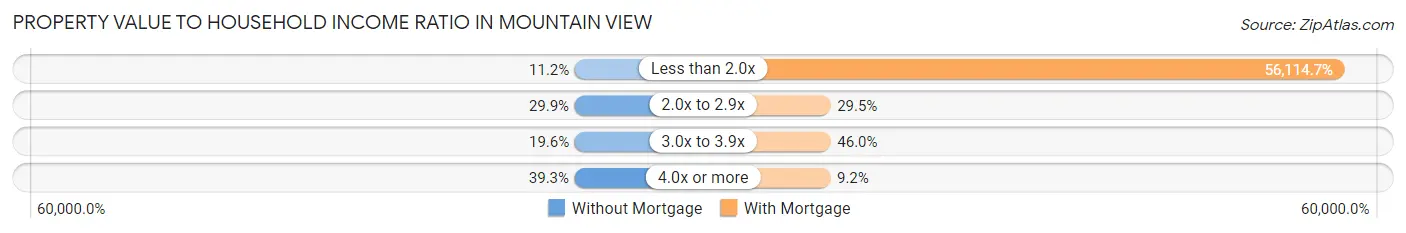
| Value-to-Income Ratio | Without Mortgage | With Mortgage |
| Less than 2.0x | 12 (11.2%) | 91,467 (56,114.7%) |
| 2.0x to 2.9x | 32 (29.9%) | 48 (29.4%) |
| 3.0x to 3.9x | 21 (19.6%) | 75 (46.0%) |
| 4.0x or more | 42 (39.3%) | 15 (9.2%) |
| Total | 107 (100.0%) | 163 (100.0%) |
Real Estate Taxes by Mortgage Status in Mountain View
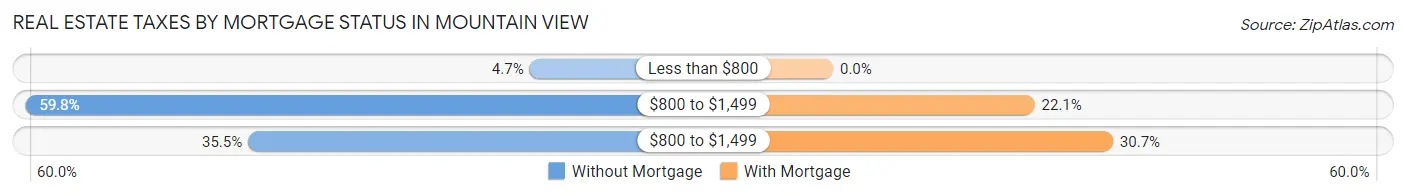
| Property Taxes | Without Mortgage | With Mortgage |
| Less than $800 | 5 (4.7%) | 0 (0.0%) |
| $800 to $1,499 | 64 (59.8%) | 36 (22.1%) |
| $800 to $1,499 | 38 (35.5%) | 50 (30.7%) |
| Total | 107 (100.0%) | 163 (100.0%) |
Health & Disability in Mountain View
Health Insurance Coverage by Age in Mountain View
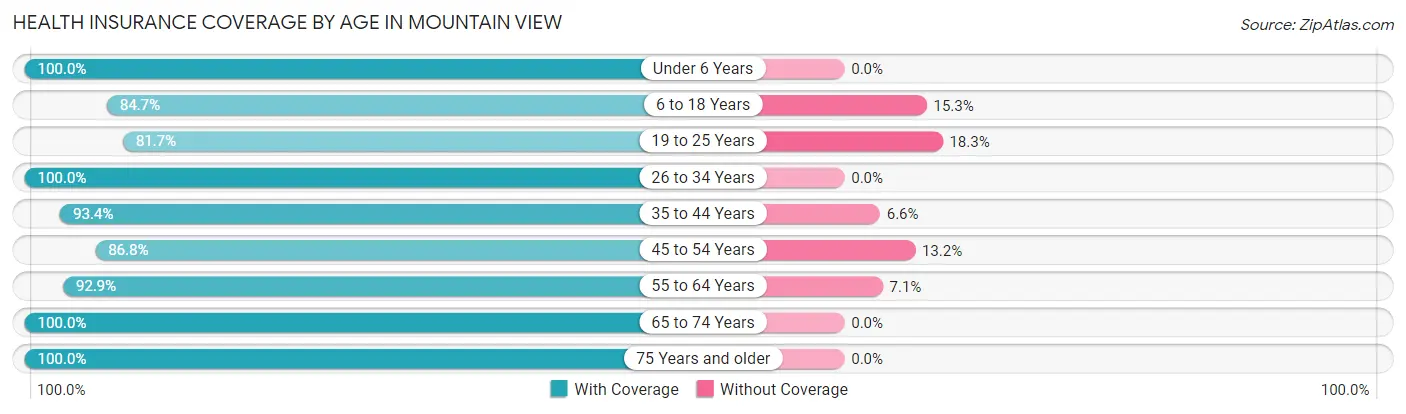
| Age Bracket | With Coverage | Without Coverage |
| Under 6 Years | 47 (100.0%) | 0 (0.0%) |
| 6 to 18 Years | 221 (84.7%) | 40 (15.3%) |
| 19 to 25 Years | 58 (81.7%) | 13 (18.3%) |
| 26 to 34 Years | 89 (100.0%) | 0 (0.0%) |
| 35 to 44 Years | 141 (93.4%) | 10 (6.6%) |
| 45 to 54 Years | 112 (86.8%) | 17 (13.2%) |
| 55 to 64 Years | 130 (92.9%) | 10 (7.1%) |
| 65 to 74 Years | 170 (100.0%) | 0 (0.0%) |
| 75 Years and older | 56 (100.0%) | 0 (0.0%) |
| Total | 1,024 (91.9%) | 90 (8.1%) |
Health Insurance Coverage by Citizenship Status in Mountain View
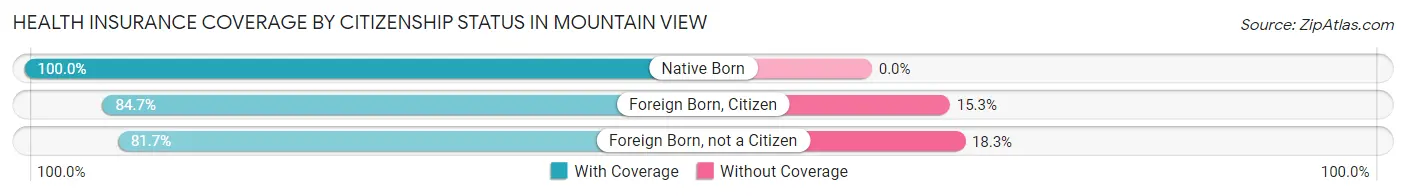
| Citizenship Status | With Coverage | Without Coverage |
| Native Born | 47 (100.0%) | 0 (0.0%) |
| Foreign Born, Citizen | 221 (84.7%) | 40 (15.3%) |
| Foreign Born, not a Citizen | 58 (81.7%) | 13 (18.3%) |
Health Insurance Coverage by Household Income in Mountain View
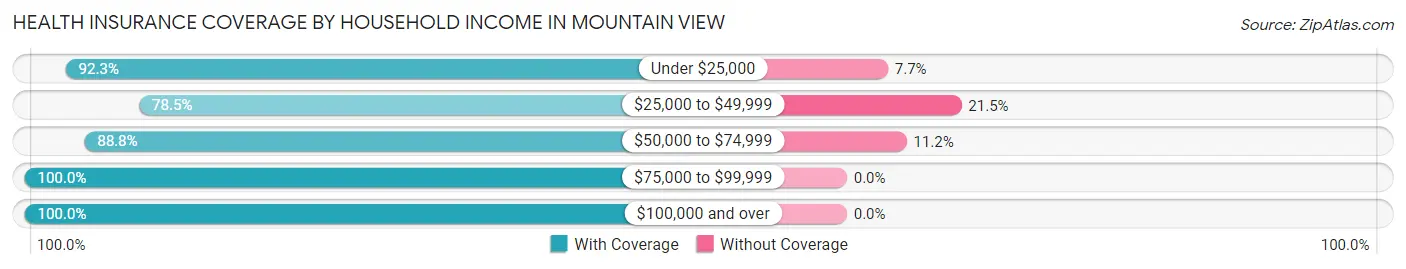
| Household Income | With Coverage | Without Coverage |
| Under $25,000 | 84 (92.3%) | 7 (7.7%) |
| $25,000 to $49,999 | 245 (78.5%) | 67 (21.5%) |
| $50,000 to $74,999 | 127 (88.8%) | 16 (11.2%) |
| $75,000 to $99,999 | 187 (100.0%) | 0 (0.0%) |
| $100,000 and over | 381 (100.0%) | 0 (0.0%) |
Public vs Private Health Insurance Coverage by Age in Mountain View
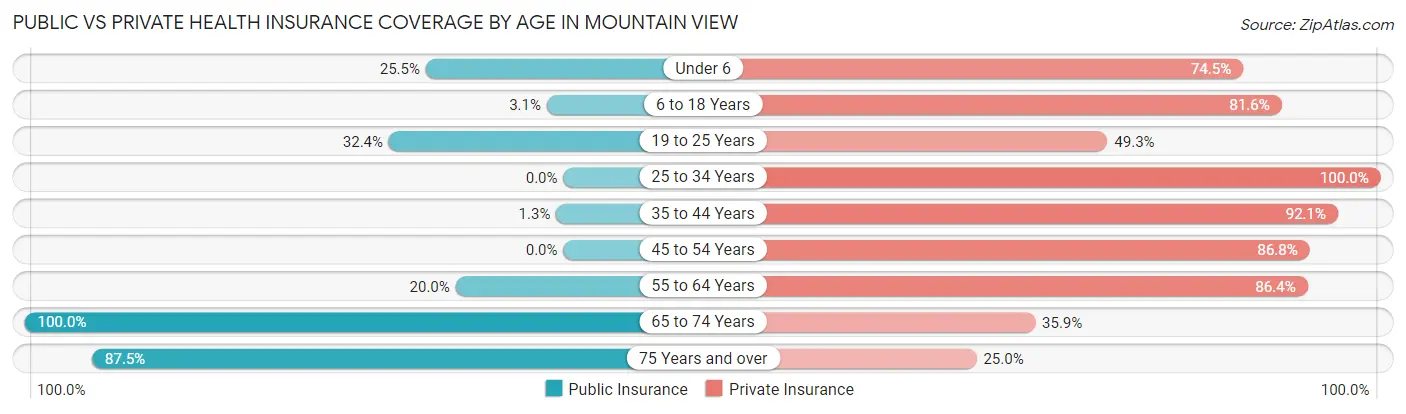
| Age Bracket | Public Insurance | Private Insurance |
| Under 6 | 12 (25.5%) | 35 (74.5%) |
| 6 to 18 Years | 8 (3.1%) | 213 (81.6%) |
| 19 to 25 Years | 23 (32.4%) | 35 (49.3%) |
| 25 to 34 Years | 0 (0.0%) | 89 (100.0%) |
| 35 to 44 Years | 2 (1.3%) | 139 (92.0%) |
| 45 to 54 Years | 0 (0.0%) | 112 (86.8%) |
| 55 to 64 Years | 28 (20.0%) | 121 (86.4%) |
| 65 to 74 Years | 170 (100.0%) | 61 (35.9%) |
| 75 Years and over | 49 (87.5%) | 14 (25.0%) |
| Total | 292 (26.2%) | 819 (73.5%) |
Disability Status by Sex by Age in Mountain View
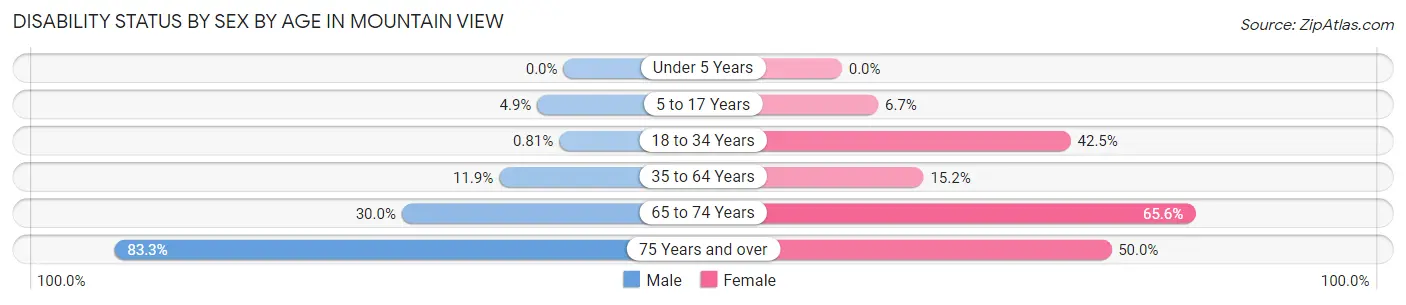
| Age Bracket | Male | Female |
| Under 5 Years | 0 (0.0%) | 0 (0.0%) |
| 5 to 17 Years | 7 (4.9%) | 6 (6.7%) |
| 18 to 34 Years | 1 (0.8%) | 31 (42.5%) |
| 35 to 64 Years | 21 (11.9%) | 37 (15.2%) |
| 65 to 74 Years | 24 (30.0%) | 59 (65.6%) |
| 75 Years and over | 35 (83.3%) | 7 (50.0%) |
Disability Class by Sex by Age in Mountain View
Disability Class: Hearing Difficulty
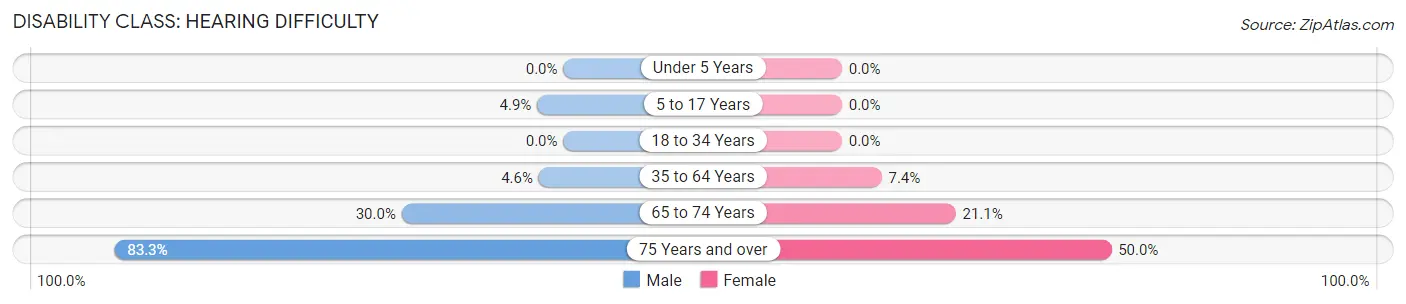
| Age Bracket | Male | Female |
| Under 5 Years | 0 (0.0%) | 0 (0.0%) |
| 5 to 17 Years | 7 (4.9%) | 0 (0.0%) |
| 18 to 34 Years | 0 (0.0%) | 0 (0.0%) |
| 35 to 64 Years | 8 (4.5%) | 18 (7.4%) |
| 65 to 74 Years | 24 (30.0%) | 19 (21.1%) |
| 75 Years and over | 35 (83.3%) | 7 (50.0%) |
Disability Class: Vision Difficulty
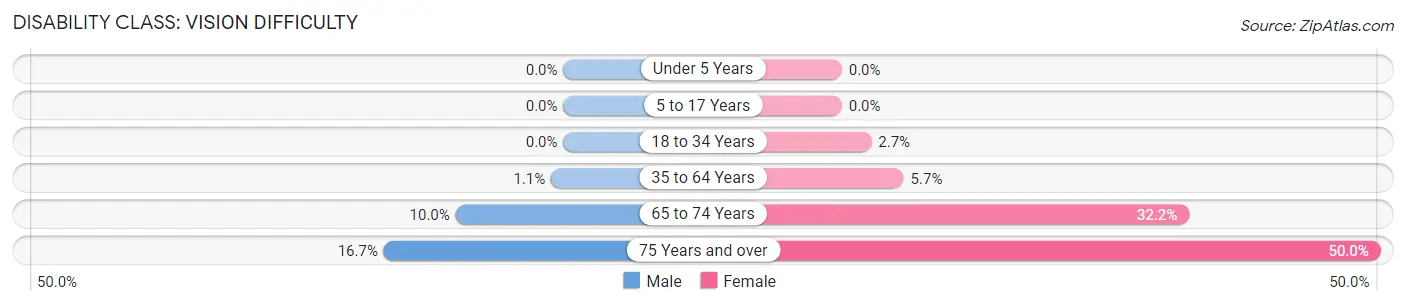
| Age Bracket | Male | Female |
| Under 5 Years | 0 (0.0%) | 0 (0.0%) |
| 5 to 17 Years | 0 (0.0%) | 0 (0.0%) |
| 18 to 34 Years | 0 (0.0%) | 2 (2.7%) |
| 35 to 64 Years | 2 (1.1%) | 14 (5.7%) |
| 65 to 74 Years | 8 (10.0%) | 29 (32.2%) |
| 75 Years and over | 7 (16.7%) | 7 (50.0%) |
Disability Class: Cognitive Difficulty
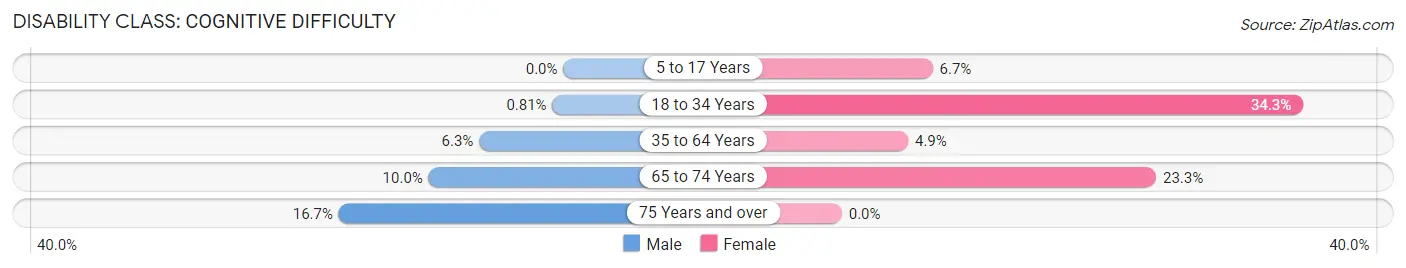
| Age Bracket | Male | Female |
| 5 to 17 Years | 0 (0.0%) | 6 (6.7%) |
| 18 to 34 Years | 1 (0.8%) | 25 (34.3%) |
| 35 to 64 Years | 11 (6.2%) | 12 (4.9%) |
| 65 to 74 Years | 8 (10.0%) | 21 (23.3%) |
| 75 Years and over | 7 (16.7%) | 0 (0.0%) |
Disability Class: Ambulatory Difficulty
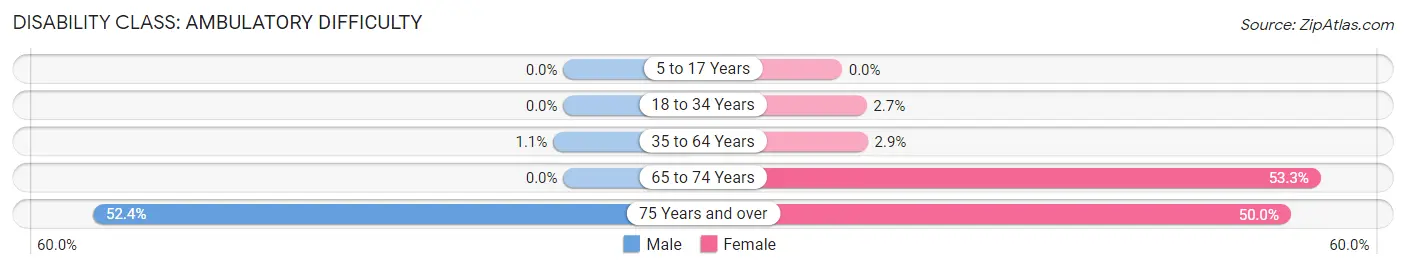
| Age Bracket | Male | Female |
| 5 to 17 Years | 0 (0.0%) | 0 (0.0%) |
| 18 to 34 Years | 0 (0.0%) | 2 (2.7%) |
| 35 to 64 Years | 2 (1.1%) | 7 (2.9%) |
| 65 to 74 Years | 0 (0.0%) | 48 (53.3%) |
| 75 Years and over | 22 (52.4%) | 7 (50.0%) |
Disability Class: Self-Care Difficulty
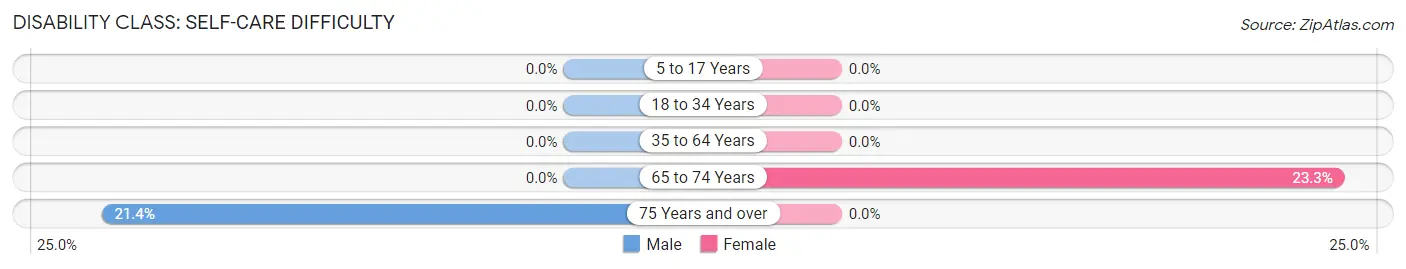
| Age Bracket | Male | Female |
| 5 to 17 Years | 0 (0.0%) | 0 (0.0%) |
| 18 to 34 Years | 0 (0.0%) | 0 (0.0%) |
| 35 to 64 Years | 0 (0.0%) | 0 (0.0%) |
| 65 to 74 Years | 0 (0.0%) | 21 (23.3%) |
| 75 Years and over | 9 (21.4%) | 0 (0.0%) |
Technology Access in Mountain View
Computing Device Access in Mountain View
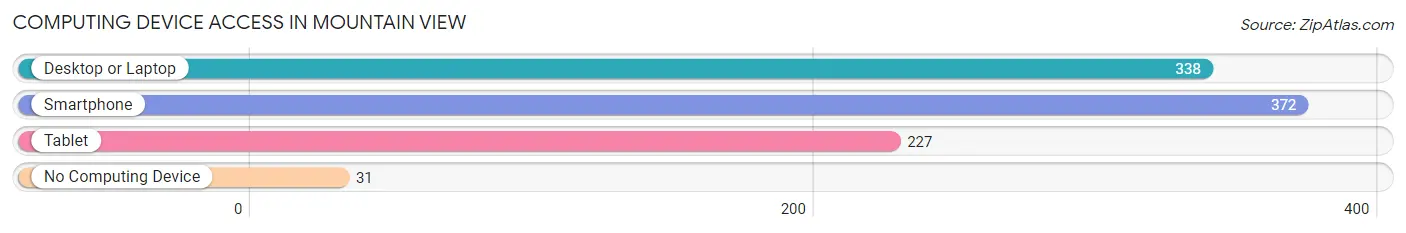
| Device Type | # Households | % Households |
| Desktop or Laptop | 338 | 80.7% |
| Smartphone | 372 | 88.8% |
| Tablet | 227 | 54.2% |
| No Computing Device | 31 | 7.4% |
| Total | 419 | 100.0% |
Internet Access in Mountain View
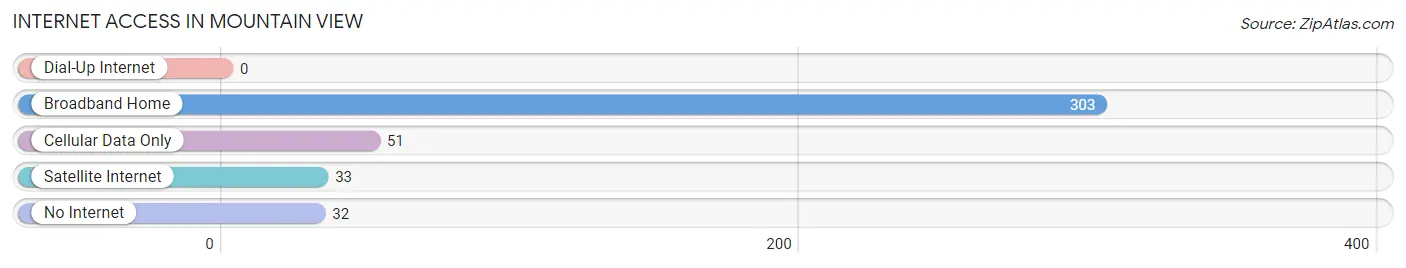
| Internet Type | # Households | % Households |
| Dial-Up Internet | 0 | 0.0% |
| Broadband Home | 303 | 72.3% |
| Cellular Data Only | 51 | 12.2% |
| Satellite Internet | 33 | 7.9% |
| No Internet | 32 | 7.6% |
| Total | 419 | 100.0% |
Mountain View Summary
Mountain View, Wyoming is a small town located in the southwestern part of the state, in Uinta County. It is situated at the base of the Uinta Mountains, and is surrounded by the Bridger-Teton National Forest. The town has a population of approximately 1,000 people, and is known for its rural, small-town atmosphere.
History
Mountain View was first settled in the late 1800s by homesteaders who were drawn to the area by its abundant natural resources. The town was officially incorporated in 1909, and was named for its location at the base of the Uinta Mountains. In the early 1900s, the town was a hub for the local timber industry, and the railroad was a major source of transportation for the area.
In the 1950s, the town began to experience a decline in population as the timber industry declined and the railroad was abandoned. However, in the late 1970s, the town experienced a resurgence in population as people began to move to the area for its recreational opportunities. Today, Mountain View is a popular destination for outdoor enthusiasts, and the town has become a hub for tourism in the region.
Geography
Mountain View is located in southwestern Wyoming, in Uinta County. The town is situated at the base of the Uinta Mountains, and is surrounded by the Bridger-Teton National Forest. The town is located at an elevation of 6,400 feet, and has a total area of 1.2 square miles. The town is located approximately 40 miles south of Evanston, Wyoming, and is approximately 80 miles east of Salt Lake City, Utah.
Economy
Mountain View’s economy is largely based on tourism and recreation. The town is a popular destination for outdoor enthusiasts, and the surrounding area offers a variety of activities, including hiking, camping, fishing, and skiing. The town is also home to several small businesses, including restaurants, shops, and lodging.
Demographics
As of the 2010 census, Mountain View had a population of 1,000 people. The town has a median household income of $41,250, and the median age is 44. The town is predominantly white (94.2%), with small percentages of Native American (2.2%), Hispanic (1.7%), and African American (1.1%) populations.
Conclusion
Mountain View, Wyoming is a small town located in the southwestern part of the state, in Uinta County. It is situated at the base of the Uinta Mountains, and is surrounded by the Bridger-Teton National Forest. The town has a population of approximately 1,000 people, and is known for its rural, small-town atmosphere. The town’s economy is largely based on tourism and recreation, and the town is a popular destination for outdoor enthusiasts. The town is predominantly white, with small percentages of Native American, Hispanic, and African American populations.
Common Questions
What is Per Capita Income in Mountain View?
Per Capita income in Mountain View is $32,711.
What is the Median Family Income in Mountain View?
Median Family Income in Mountain View is $90,272.
What is the Median Household income in Mountain View?
Median Household Income in Mountain View is $69,514.
What is Income or Wage Gap in Mountain View?
Income or Wage Gap in Mountain View is 51.3%.
Women in Mountain View earn 48.7 cents for every dollar earned by a man.
What is Inequality or Gini Index in Mountain View?
Inequality or Gini Index in Mountain View is 0.37.
What is the Total Population of Mountain View?
Total Population of Mountain View is 1,114.
What is the Total Male Population of Mountain View?
Total Male Population of Mountain View is 580.
What is the Total Female Population of Mountain View?
Total Female Population of Mountain View is 534.
What is the Ratio of Males per 100 Females in Mountain View?
There are 108.61 Males per 100 Females in Mountain View.
What is the Ratio of Females per 100 Males in Mountain View?
There are 92.07 Females per 100 Males in Mountain View.
What is the Median Population Age in Mountain View?
Median Population Age in Mountain View is 40.3 Years.
What is the Average Family Size in Mountain View
Average Family Size in Mountain View is 3.2 People.
What is the Average Household Size in Mountain View
Average Household Size in Mountain View is 2.7 People.
How Large is the Labor Force in Mountain View?
There are 541 People in the Labor Forcein in Mountain View.
What is the Percentage of People in the Labor Force in Mountain View?
58.5% of People are in the Labor Force in Mountain View.
What is the Unemployment Rate in Mountain View?
Unemployment Rate in Mountain View is 4.8%.