Wilson, WY Map & Demographics
Wilson Map
Wilson Overview
$96,141
PER CAPITA INCOME
$128,981
AVG HOUSEHOLD INCOME
40.5%
WAGE / INCOME GAP [ % ]
59.5¢/ $1
WAGE / INCOME GAP [ $ ]
0.53
INEQUALITY / GINI INDEX
1,303
TOTAL POPULATION
721
MALE POPULATION
582
FEMALE POPULATION
123.88
MALES / 100 FEMALES
80.72
FEMALES / 100 MALES
47.0
MEDIAN AGE
2.4
AVG FAMILY SIZE
2.2
AVG HOUSEHOLD SIZE
753
LABOR FORCE [ PEOPLE ]
65.9%
PERCENT IN LABOR FORCE
Wilson Zip Codes
Wilson Area Codes
Income in Wilson
Income Overview in Wilson
| Characteristic | Number | Measure |
| Per Capita Income | 1,303 | $96,141 |
| Median Family Income | 364 | $0 |
| Mean Family Income | 364 | $244,460 |
| Median Household Income | 582 | $128,981 |
| Mean Household Income | 582 | $204,199 |
| Income Deficit | 364 | $0 |
| Wage / Income Gap (%) | 1,303 | 40.49% |
| Wage / Income Gap ($) | 1,303 | 59.51¢ per $1 |
| Gini / Inequality Index | 1,303 | 0.53 |
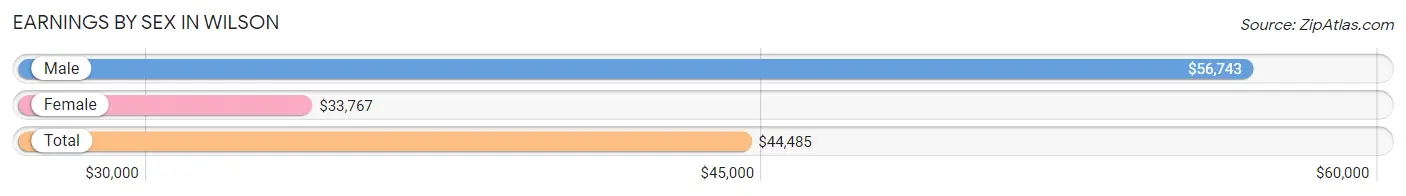
Earnings by Sex in Wilson
Average Earnings in Wilson are $44,485, $56,743 for men and $33,767 for women, a difference of 40.5%.
| Sex | Number | Average Earnings |
| Male | 535 (63.2%) | $56,743 |
| Female | 312 (36.8%) | $33,767 |
| Total | 847 (100.0%) | $44,485 |
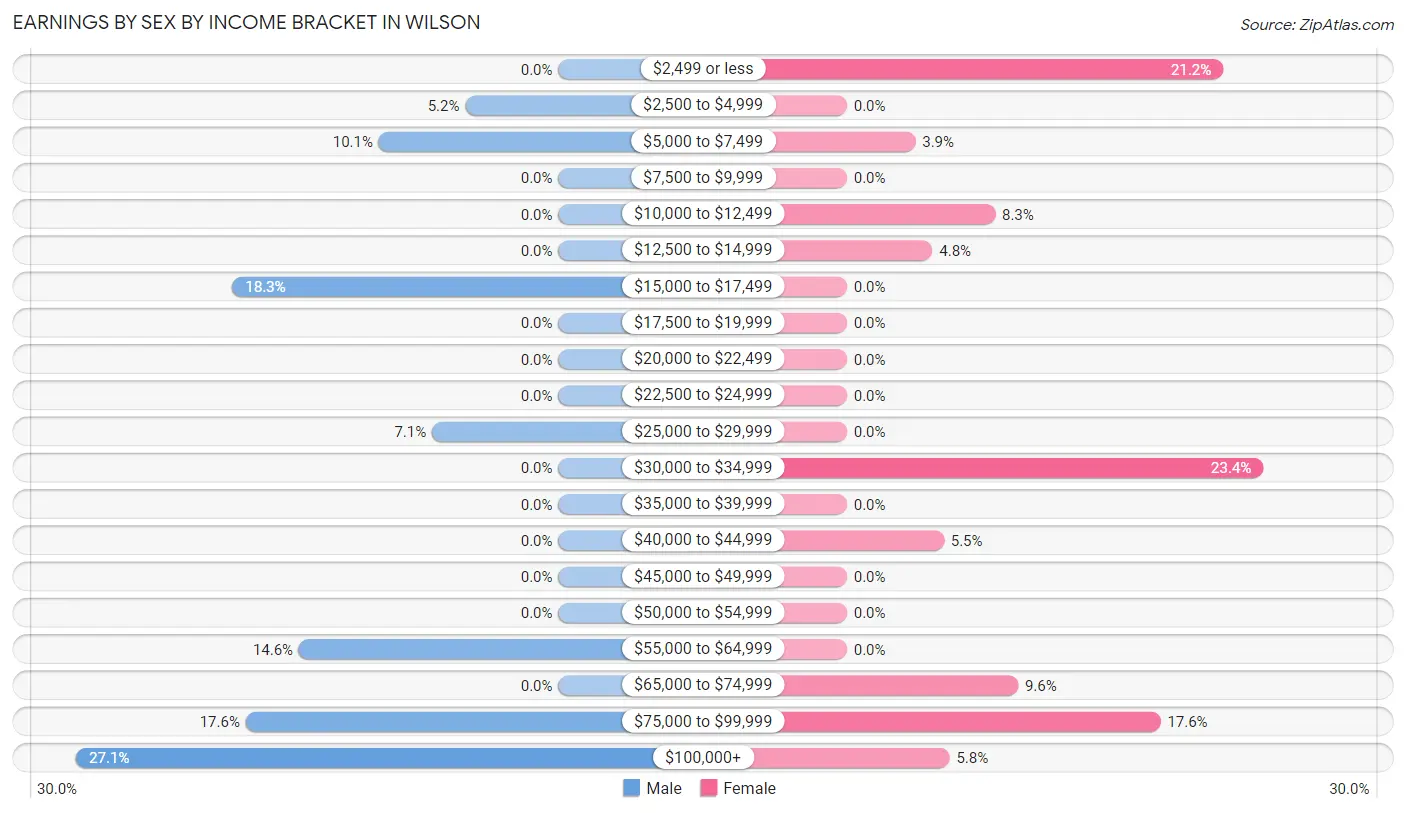
Earnings by Sex by Income Bracket in Wilson
The most common earnings brackets in Wilson are $100,000+ for men (145 | 27.1%) and $30,000 to $34,999 for women (73 | 23.4%).
| Income | Male | Female |
| $2,499 or less | 0 (0.0%) | 66 (21.1%) |
| $2,500 to $4,999 | 28 (5.2%) | 0 (0.0%) |
| $5,000 to $7,499 | 54 (10.1%) | 12 (3.8%) |
| $7,500 to $9,999 | 0 (0.0%) | 0 (0.0%) |
| $10,000 to $12,499 | 0 (0.0%) | 26 (8.3%) |
| $12,500 to $14,999 | 0 (0.0%) | 15 (4.8%) |
| $15,000 to $17,499 | 98 (18.3%) | 0 (0.0%) |
| $17,500 to $19,999 | 0 (0.0%) | 0 (0.0%) |
| $20,000 to $22,499 | 0 (0.0%) | 0 (0.0%) |
| $22,500 to $24,999 | 0 (0.0%) | 0 (0.0%) |
| $25,000 to $29,999 | 38 (7.1%) | 0 (0.0%) |
| $30,000 to $34,999 | 0 (0.0%) | 73 (23.4%) |
| $35,000 to $39,999 | 0 (0.0%) | 0 (0.0%) |
| $40,000 to $44,999 | 0 (0.0%) | 17 (5.4%) |
| $45,000 to $49,999 | 0 (0.0%) | 0 (0.0%) |
| $50,000 to $54,999 | 0 (0.0%) | 0 (0.0%) |
| $55,000 to $64,999 | 78 (14.6%) | 0 (0.0%) |
| $65,000 to $74,999 | 0 (0.0%) | 30 (9.6%) |
| $75,000 to $99,999 | 94 (17.6%) | 55 (17.6%) |
| $100,000+ | 145 (27.1%) | 18 (5.8%) |
| Total | 535 (100.0%) | 312 (100.0%) |
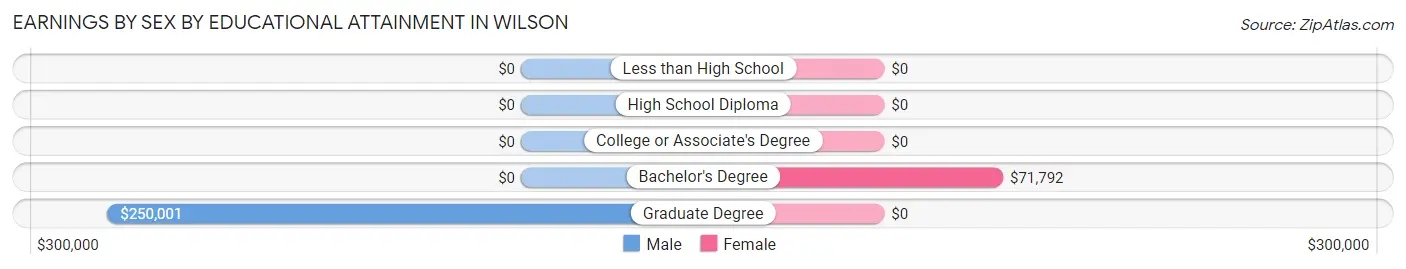
Earnings by Sex by Educational Attainment in Wilson
Average earnings in Wilson are $57,236 for men and $34,144 for women, a difference of 40.4%. Men with an educational attainment of graduate degree enjoy the highest average annual earnings of $250,001, while those with graduate degree education earn the least with $250,001. Women with an educational attainment of bachelor's degree earn the most with the average annual earnings of $71,792, while those with bachelor's degree education have the smallest earnings of $71,792.
| Educational Attainment | Male Income | Female Income |
| Less than High School | - | - |
| High School Diploma | - | - |
| College or Associate's Degree | - | - |
| Bachelor's Degree | - | - |
| Graduate Degree | $250,001 | $0 |
| Total | $57,236 | $34,144 |
Family Income in Wilson
Family Income Brackets in Wilson
According to the Wilson family income data, there are 154 families falling into the $200,000+ income range, which is the most common income bracket and makes up 42.3% of all families.
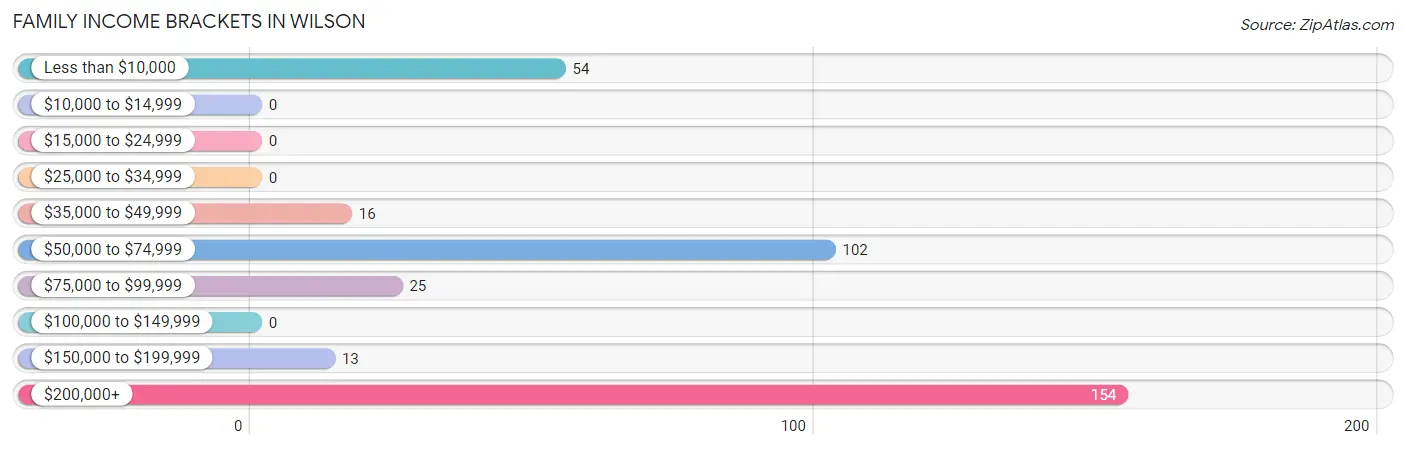
| Income Bracket | # Families | % Families |
| Less than $10,000 | 54 | 14.8% |
| $10,000 to $14,999 | 0 | 0.0% |
| $15,000 to $24,999 | 0 | 0.0% |
| $25,000 to $34,999 | 0 | 0.0% |
| $35,000 to $49,999 | 16 | 4.4% |
| $50,000 to $74,999 | 102 | 28.0% |
| $75,000 to $99,999 | 25 | 6.9% |
| $100,000 to $149,999 | 0 | 0.0% |
| $150,000 to $199,999 | 13 | 3.6% |
| $200,000+ | 154 | 42.3% |
Family Income by Famaliy Size in Wilson
3-person families (107 | 29.4%) account for the highest median family income in Wilson with $239,236 per family, while 3-person families (107 | 29.4%) have the highest median income of $79,745 per family member.
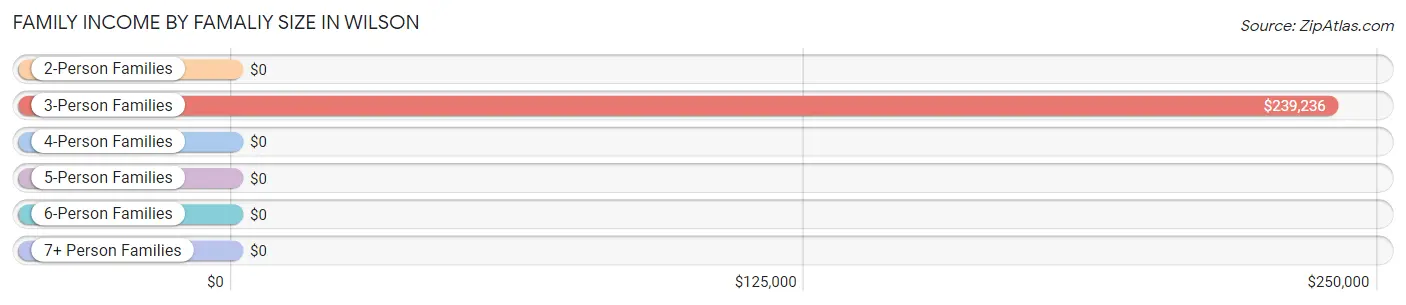
| Income Bracket | # Families | Median Income |
| 2-Person Families | 197 (54.1%) | $0 |
| 3-Person Families | 107 (29.4%) | $239,236 |
| 4-Person Families | 14 (3.8%) | $0 |
| 5-Person Families | 46 (12.6%) | $0 |
| 6-Person Families | 0 (0.0%) | $0 |
| 7+ Person Families | 0 (0.0%) | $0 |
| Total | 364 (100.0%) | $0 |
Family Income by Number of Earners in Wilson
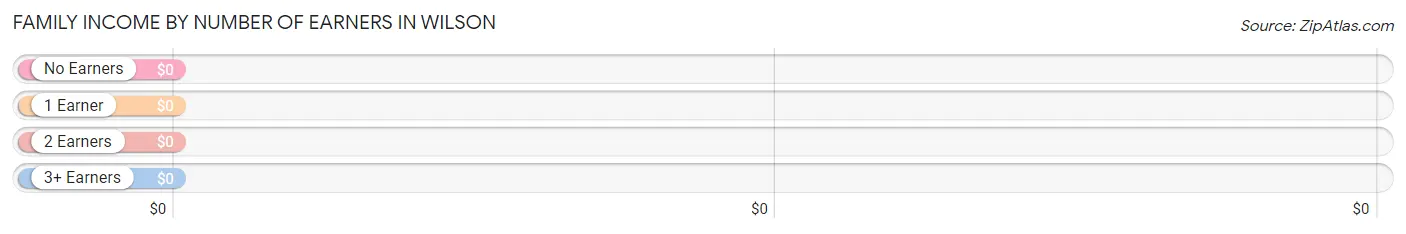
| Number of Earners | # Families | Median Income |
| No Earners | 51 (14.0%) | $0 |
| 1 Earner | 148 (40.7%) | $0 |
| 2 Earners | 149 (40.9%) | $0 |
| 3+ Earners | 16 (4.4%) | $0 |
| Total | 364 (100.0%) | $0 |
Household Income in Wilson
Household Income Brackets in Wilson
With 206 households falling in the category, the $200,000+ income range is the most frequent in Wilson, accounting for 35.4% of all households.
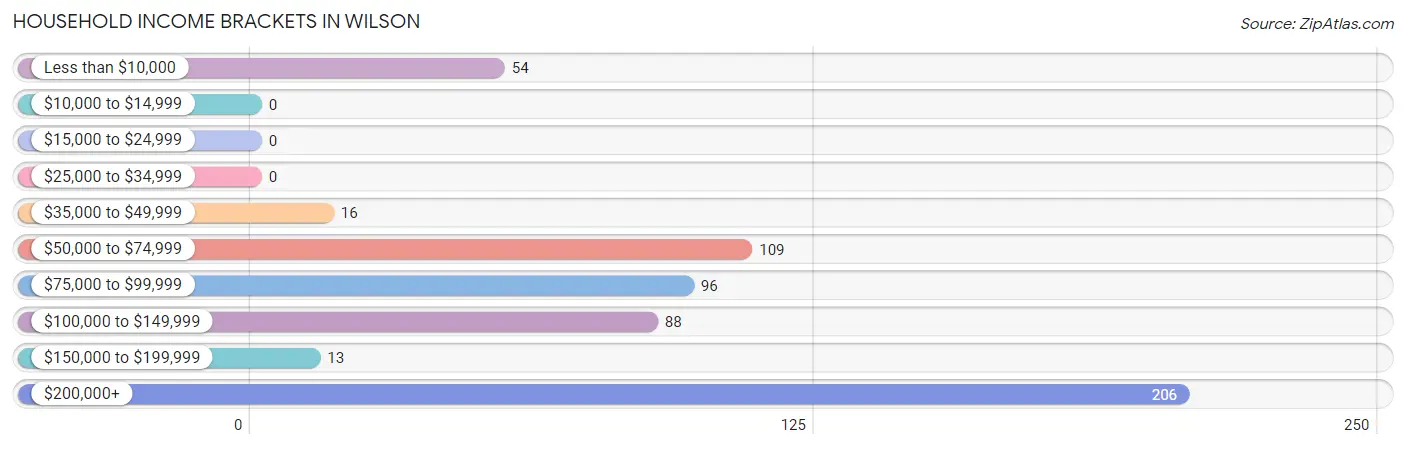
| Income Bracket | # Households | % Households |
| Less than $10,000 | 54 | 9.3% |
| $10,000 to $14,999 | 0 | 0.0% |
| $15,000 to $24,999 | 0 | 0.0% |
| $25,000 to $34,999 | 0 | 0.0% |
| $35,000 to $49,999 | 16 | 2.7% |
| $50,000 to $74,999 | 109 | 18.7% |
| $75,000 to $99,999 | 96 | 16.5% |
| $100,000 to $149,999 | 88 | 15.1% |
| $150,000 to $199,999 | 13 | 2.2% |
| $200,000+ | 206 | 35.4% |
Household Income by Householder Age in Wilson
The median household income in Wilson is $128,981, with the highest median household income of $205,870 found in the 65+ years age bracket for the primary householder. A total of 182 households (31.3%) fall into this category.
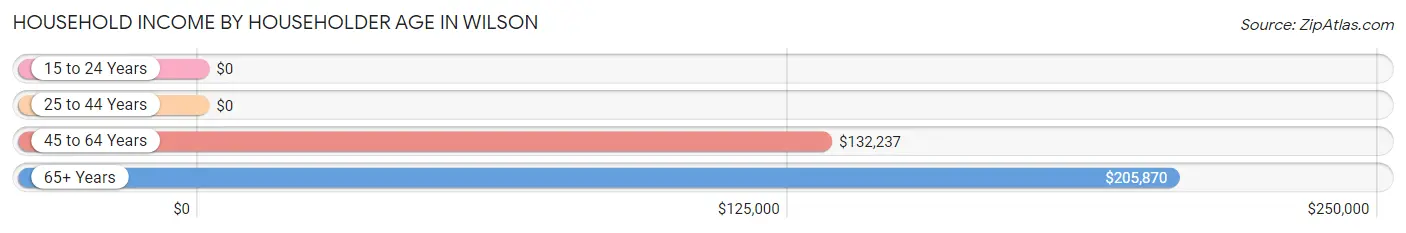
| Income Bracket | # Households | Median Income |
| 15 to 24 Years | 0 (0.0%) | $0 |
| 25 to 44 Years | 134 (23.0%) | $0 |
| 45 to 64 Years | 266 (45.7%) | $132,237 |
| 65+ Years | 182 (31.3%) | $205,870 |
| Total | 582 (100.0%) | $128,981 |
Poverty in Wilson
Income Below Poverty by Sex and Age in Wilson
With 11.1% poverty level for males and 5.8% for females among the residents of Wilson, under 5 year old males and 35 to 44 year old females are the most vulnerable to poverty, with 26 males (42.6%) and 34 females (22.5%) in their respective age groups living below the poverty level.
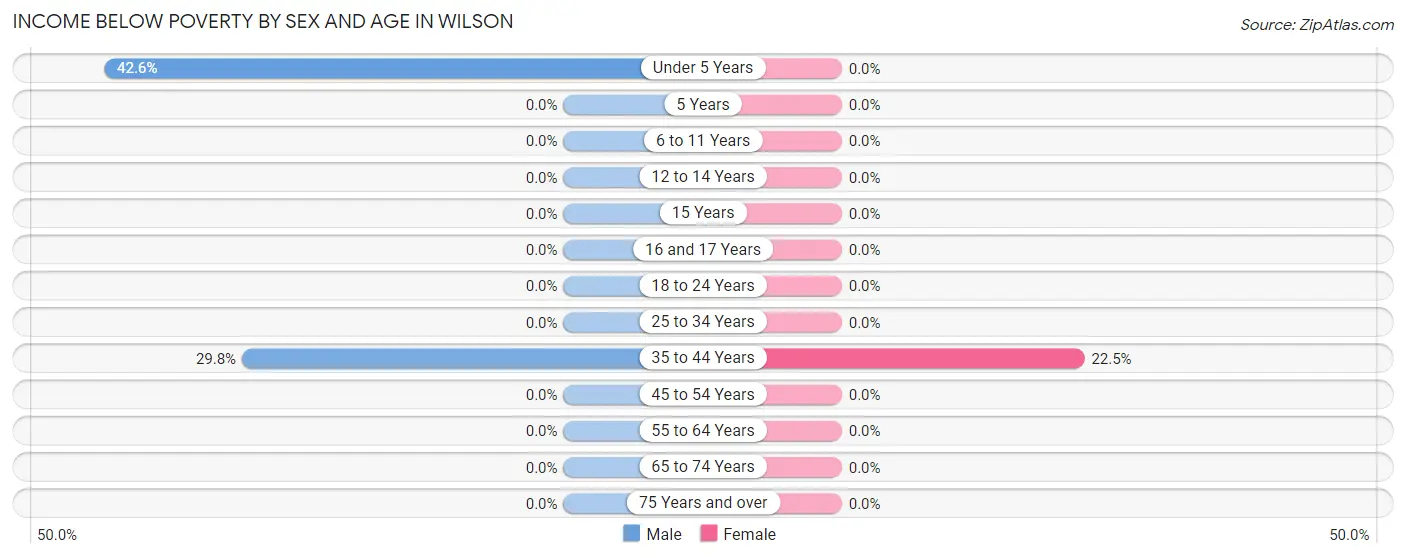
| Age Bracket | Male | Female |
| Under 5 Years | 26 (42.6%) | 0 (0.0%) |
| 5 Years | 0 (0.0%) | 0 (0.0%) |
| 6 to 11 Years | 0 (0.0%) | 0 (0.0%) |
| 12 to 14 Years | 0 (0.0%) | 0 (0.0%) |
| 15 Years | 0 (0.0%) | 0 (0.0%) |
| 16 and 17 Years | 0 (0.0%) | 0 (0.0%) |
| 18 to 24 Years | 0 (0.0%) | 0 (0.0%) |
| 25 to 34 Years | 0 (0.0%) | 0 (0.0%) |
| 35 to 44 Years | 54 (29.8%) | 34 (22.5%) |
| 45 to 54 Years | 0 (0.0%) | 0 (0.0%) |
| 55 to 64 Years | 0 (0.0%) | 0 (0.0%) |
| 65 to 74 Years | 0 (0.0%) | 0 (0.0%) |
| 75 Years and over | 0 (0.0%) | 0 (0.0%) |
| Total | 80 (11.1%) | 34 (5.8%) |
Income Above Poverty by Sex and Age in Wilson
According to the poverty statistics in Wilson, males aged 5 years and females aged 6 to 11 years are the age groups that are most secure financially, with 100.0% of males and 100.0% of females in these age groups living above the poverty line.
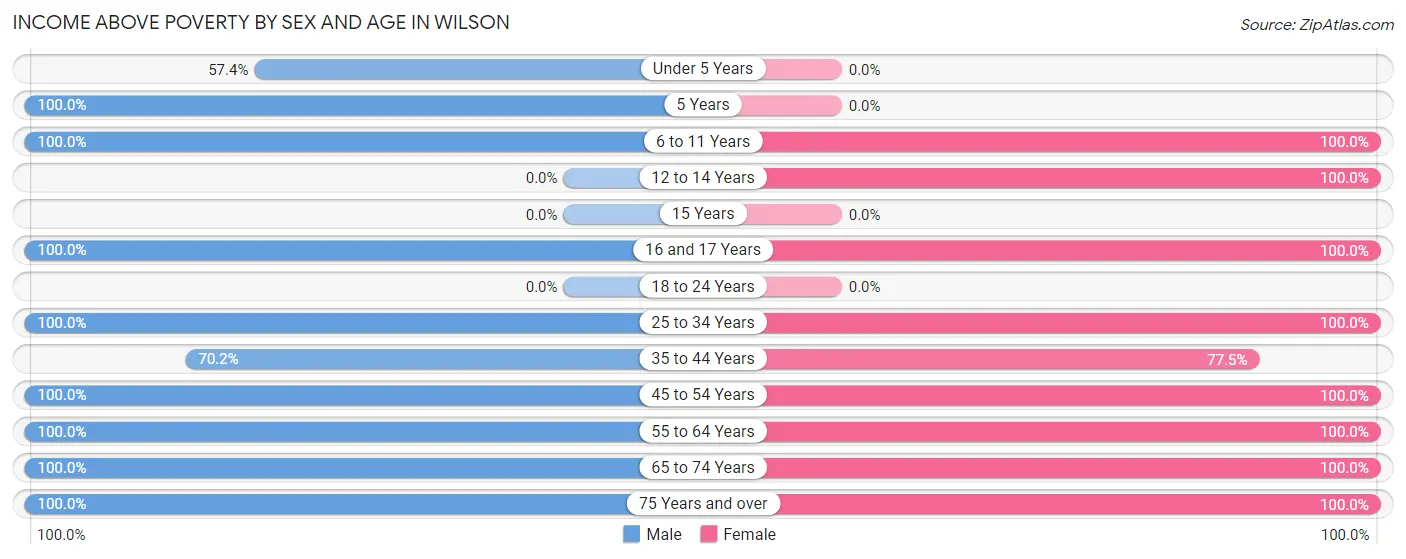
| Age Bracket | Male | Female |
| Under 5 Years | 35 (57.4%) | 0 (0.0%) |
| 5 Years | 9 (100.0%) | 0 (0.0%) |
| 6 to 11 Years | 14 (100.0%) | 58 (100.0%) |
| 12 to 14 Years | 0 (0.0%) | 19 (100.0%) |
| 15 Years | 0 (0.0%) | 0 (0.0%) |
| 16 and 17 Years | 28 (100.0%) | 22 (100.0%) |
| 18 to 24 Years | 0 (0.0%) | 0 (0.0%) |
| 25 to 34 Years | 20 (100.0%) | 46 (100.0%) |
| 35 to 44 Years | 127 (70.2%) | 117 (77.5%) |
| 45 to 54 Years | 111 (100.0%) | 36 (100.0%) |
| 55 to 64 Years | 114 (100.0%) | 161 (100.0%) |
| 65 to 74 Years | 155 (100.0%) | 75 (100.0%) |
| 75 Years and over | 28 (100.0%) | 14 (100.0%) |
| Total | 641 (88.9%) | 548 (94.2%) |
Income Below Poverty Among Married-Couple Families in Wilson
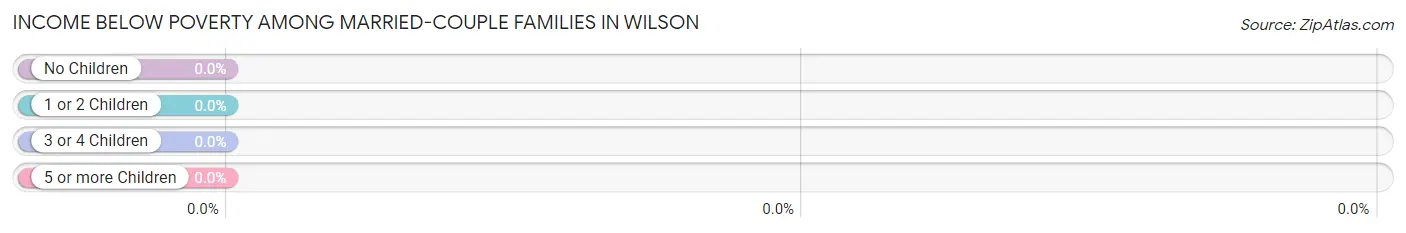
| Children | Above Poverty | Below Poverty |
| No Children | 161 (100.0%) | 0 (0.0%) |
| 1 or 2 Children | 78 (100.0%) | 0 (0.0%) |
| 3 or 4 Children | 46 (100.0%) | 0 (0.0%) |
| 5 or more Children | 0 (0.0%) | 0 (0.0%) |
| Total | 285 (100.0%) | 0 (0.0%) |
Income Below Poverty Among Single-Parent Households in Wilson
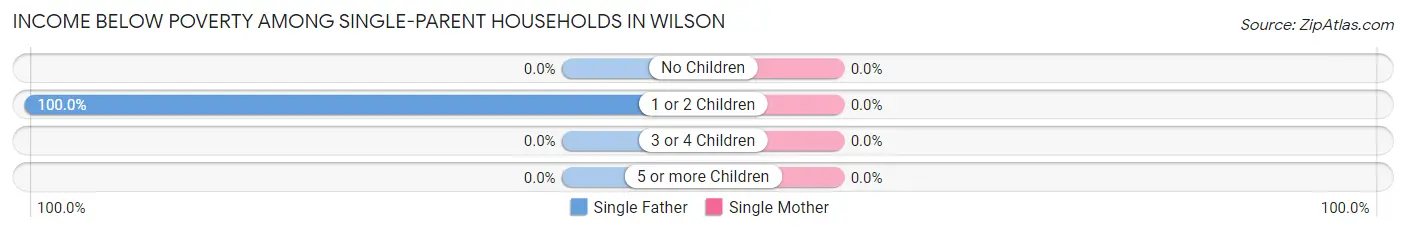
| Children | Single Father | Single Mother |
| No Children | 0 (0.0%) | 0 (0.0%) |
| 1 or 2 Children | 54 (100.0%) | 0 (0.0%) |
| 3 or 4 Children | 0 (0.0%) | 0 (0.0%) |
| 5 or more Children | 0 (0.0%) | 0 (0.0%) |
| Total | 54 (100.0%) | 0 (0.0%) |
Income Below Poverty Among Married-Couple vs Single-Parent Households in Wilson
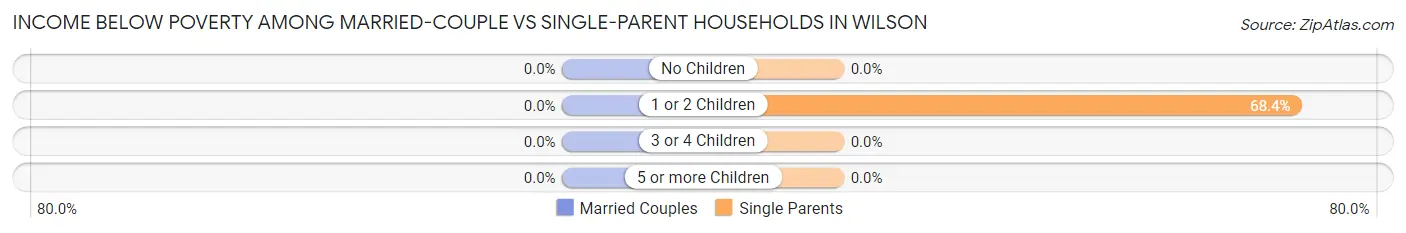
| Children | Married-Couple Families | Single-Parent Households |
| No Children | 0 (0.0%) | 0 (0.0%) |
| 1 or 2 Children | 0 (0.0%) | 54 (68.3%) |
| 3 or 4 Children | 0 (0.0%) | 0 (0.0%) |
| 5 or more Children | 0 (0.0%) | 0 (0.0%) |
| Total | 0 (0.0%) | 54 (68.3%) |
Race in Wilson
The most populous races in Wilson are White / Caucasian (1,275 | 97.9%), Hispanic or Latino (61 | 4.7%), and Asian (28 | 2.1%).
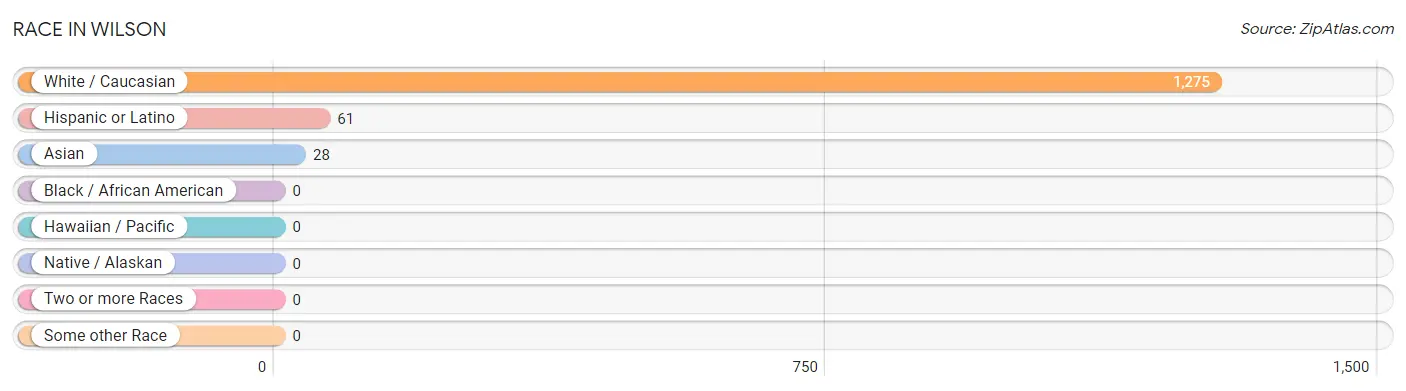
| Race | # Population | % Population |
| Asian | 28 | 2.1% |
| Black / African American | 0 | 0.0% |
| Hawaiian / Pacific | 0 | 0.0% |
| Hispanic or Latino | 61 | 4.7% |
| Native / Alaskan | 0 | 0.0% |
| White / Caucasian | 1,275 | 97.9% |
| Two or more Races | 0 | 0.0% |
| Some other Race | 0 | 0.0% |
| Total | 1,303 | 100.0% |
Ancestry in Wilson
The most populous ancestries reported in Wilson are English (304 | 23.3%), Irish (164 | 12.6%), German (140 | 10.7%), Scottish (119 | 9.1%), and Italian (90 | 6.9%), together accounting for 62.7% of all Wilson residents.
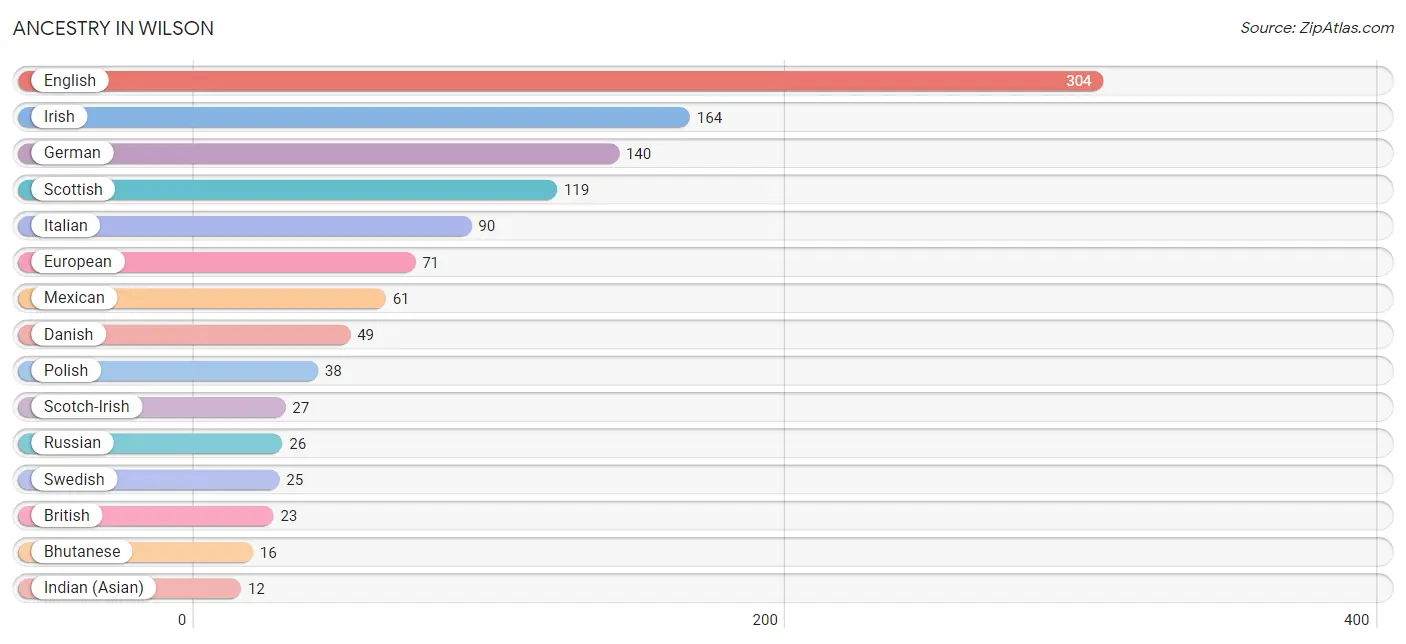
| Ancestry | # Population | % Population |
| Bhutanese | 16 | 1.2% |
| British | 23 | 1.8% |
| Danish | 49 | 3.8% |
| English | 304 | 23.3% |
| European | 71 | 5.4% |
| German | 140 | 10.7% |
| Indian (Asian) | 12 | 0.9% |
| Irish | 164 | 12.6% |
| Italian | 90 | 6.9% |
| Mexican | 61 | 4.7% |
| Polish | 38 | 2.9% |
| Russian | 26 | 2.0% |
| Scotch-Irish | 27 | 2.1% |
| Scottish | 119 | 9.1% |
| Swedish | 25 | 1.9% | View All 15 Rows |
Immigrants in Wilson
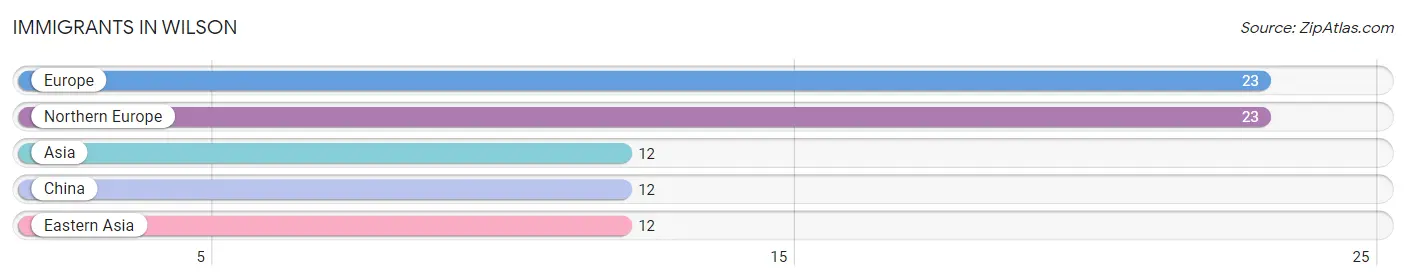
The most numerous immigrant groups reported in Wilson came from Europe (23 | 1.8%), Northern Europe (23 | 1.8%), Asia (12 | 0.9%), China (12 | 0.9%), and Eastern Asia (12 | 0.9%), together accounting for 6.3% of all Wilson residents.
| Immigration Origin | # Population | % Population |
| Asia | 12 | 0.9% |
| China | 12 | 0.9% |
| Eastern Asia | 12 | 0.9% |
| Europe | 23 | 1.8% |
| Northern Europe | 23 | 1.8% | View All 5 Rows |
Sex and Age in Wilson
Sex and Age in Wilson
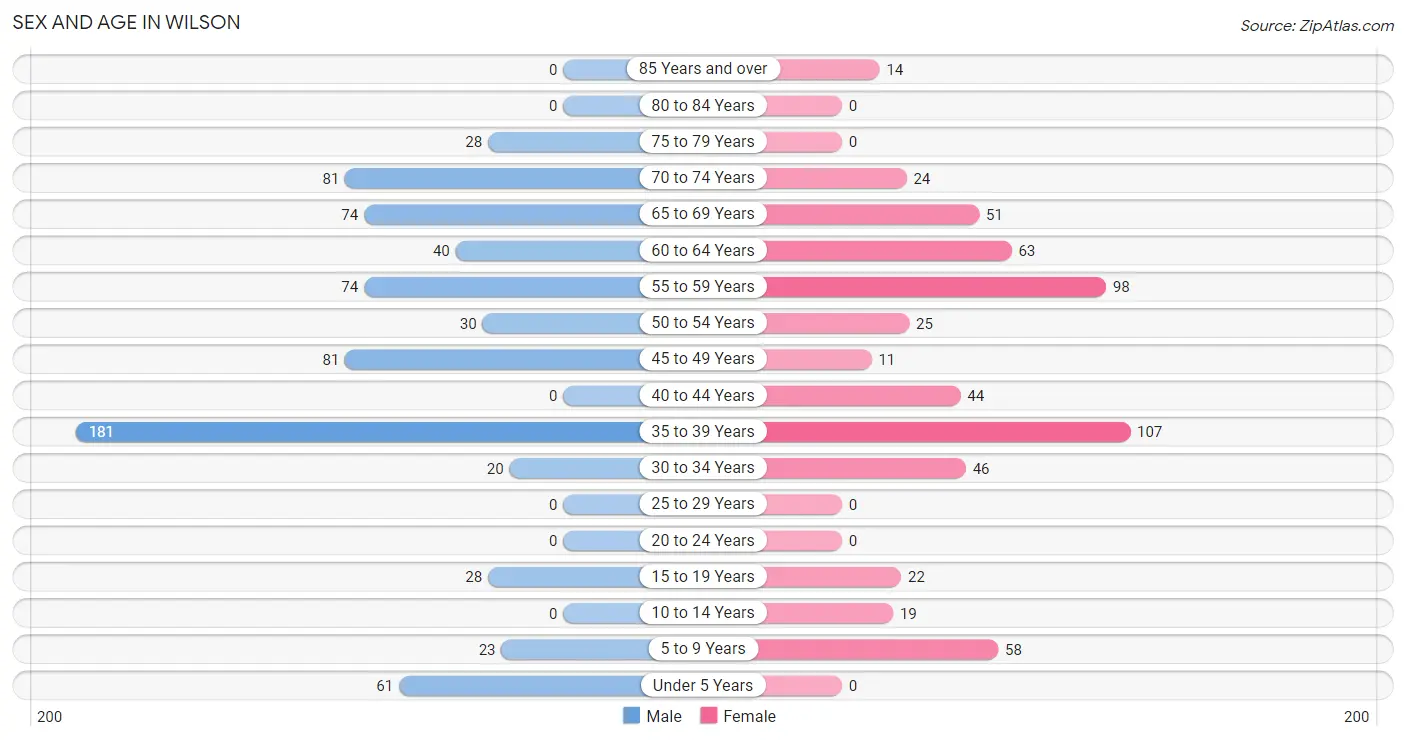
The most populous age groups in Wilson are 35 to 39 Years (181 | 25.1%) for men and 35 to 39 Years (107 | 18.4%) for women.
| Age Bracket | Male | Female |
| Under 5 Years | 61 (8.5%) | 0 (0.0%) |
| 5 to 9 Years | 23 (3.2%) | 58 (10.0%) |
| 10 to 14 Years | 0 (0.0%) | 19 (3.3%) |
| 15 to 19 Years | 28 (3.9%) | 22 (3.8%) |
| 20 to 24 Years | 0 (0.0%) | 0 (0.0%) |
| 25 to 29 Years | 0 (0.0%) | 0 (0.0%) |
| 30 to 34 Years | 20 (2.8%) | 46 (7.9%) |
| 35 to 39 Years | 181 (25.1%) | 107 (18.4%) |
| 40 to 44 Years | 0 (0.0%) | 44 (7.6%) |
| 45 to 49 Years | 81 (11.2%) | 11 (1.9%) |
| 50 to 54 Years | 30 (4.2%) | 25 (4.3%) |
| 55 to 59 Years | 74 (10.3%) | 98 (16.8%) |
| 60 to 64 Years | 40 (5.6%) | 63 (10.8%) |
| 65 to 69 Years | 74 (10.3%) | 51 (8.8%) |
| 70 to 74 Years | 81 (11.2%) | 24 (4.1%) |
| 75 to 79 Years | 28 (3.9%) | 0 (0.0%) |
| 80 to 84 Years | 0 (0.0%) | 0 (0.0%) |
| 85 Years and over | 0 (0.0%) | 14 (2.4%) |
| Total | 721 (100.0%) | 582 (100.0%) |
Families and Households in Wilson
Median Family Size in Wilson
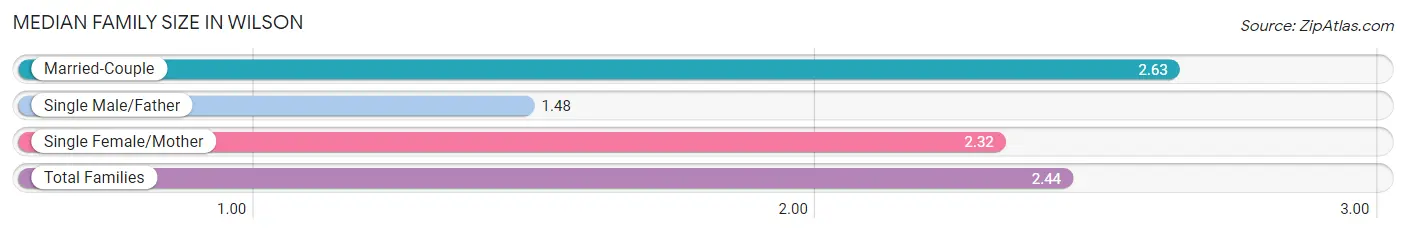
The median family size in Wilson is 2.44 persons per family, with married-couple families (285 | 78.3%) accounting for the largest median family size of 2.63 persons per family. On the other hand, single male/father families (54 | 14.8%) represent the smallest median family size with 1.48 persons per family.
| Family Type | # Families | Family Size |
| Married-Couple | 285 (78.3%) | 2.63 |
| Single Male/Father | 54 (14.8%) | 1.48 |
| Single Female/Mother | 25 (6.9%) | 2.32 |
| Total Families | 364 (100.0%) | 2.44 |
Median Household Size in Wilson
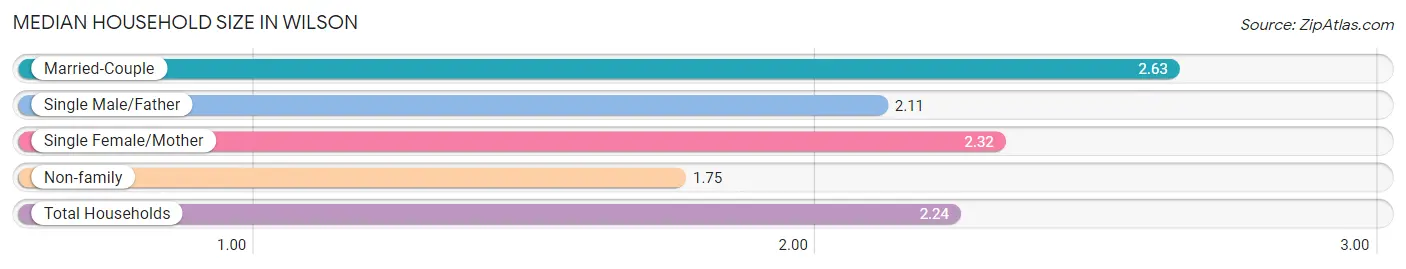
The median household size in Wilson is 2.24 persons per household, with married-couple households (285 | 49.0%) accounting for the largest median household size of 2.63 persons per household. non-family households (218 | 37.5%) represent the smallest median household size with 1.75 persons per household.
| Household Type | # Households | Household Size |
| Married-Couple | 285 (49.0%) | 2.63 |
| Single Male/Father | 54 (9.3%) | 2.11 |
| Single Female/Mother | 25 (4.3%) | 2.32 |
| Non-family | 218 (37.5%) | 1.75 |
| Total Households | 582 (100.0%) | 2.24 |
Household Size by Marriage Status in Wilson
Out of a total of 582 households in Wilson, 364 (62.5%) are family households, while 218 (37.5%) are nonfamily households. The most numerous type of family households are 3-person households, comprising 161, and the most common type of nonfamily households are 2-person households, comprising 116.
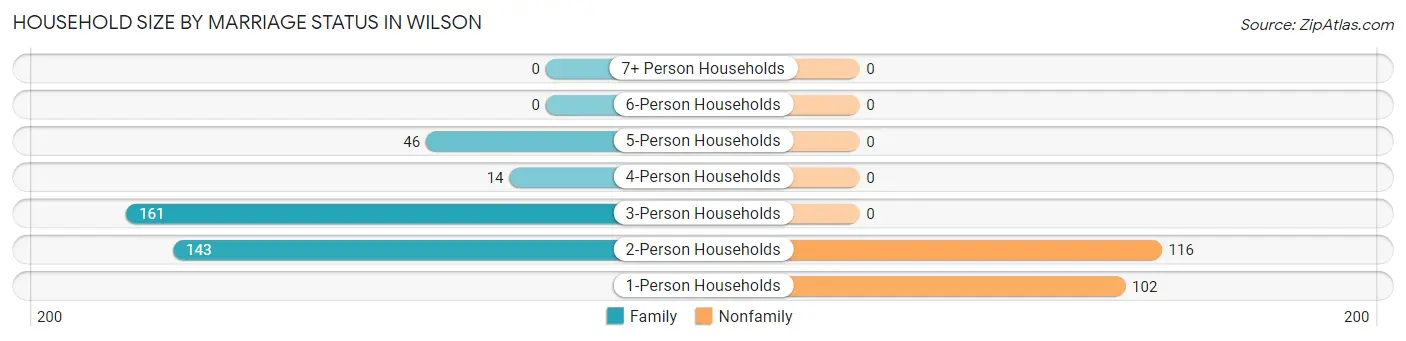
| Household Size | Family Households | Nonfamily Households |
| 1-Person Households | - | 102 (17.5%) |
| 2-Person Households | 143 (24.6%) | 116 (19.9%) |
| 3-Person Households | 161 (27.7%) | 0 (0.0%) |
| 4-Person Households | 14 (2.4%) | 0 (0.0%) |
| 5-Person Households | 46 (7.9%) | 0 (0.0%) |
| 6-Person Households | 0 (0.0%) | 0 (0.0%) |
| 7+ Person Households | 0 (0.0%) | 0 (0.0%) |
| Total | 364 (62.5%) | 218 (37.5%) |
Female Fertility in Wilson
Fertility by Age in Wilson
| Age Bracket | Women with Births | Births / 1,000 Women |
| 15 to 19 years | 0 (0.0%) | 0.0 |
| 20 to 34 years | 0 (0.0%) | 0.0 |
| 35 to 50 years | 0 (0.0%) | 0.0 |
| Total | 0 (0.0%) | 0.0 |
Fertility by Age by Marriage Status in Wilson
| Age Bracket | Married | Unmarried |
| 15 to 19 years | 0 (0.0%) | 0 (0.0%) |
| 20 to 34 years | 0 (0.0%) | 0 (0.0%) |
| 35 to 50 years | 0 (0.0%) | 0 (0.0%) |
| Total | 0 (0.0%) | 0 (0.0%) |
Fertility by Education in Wilson
| Educational Attainment | Women with Births | Births / 1,000 Women |
| Less than High School | 0 (0.0%) | 0.0 |
| High School Diploma | 0 (0.0%) | 0.0 |
| College or Associate's Degree | 0 (0.0%) | 0.0 |
| Bachelor's Degree | 0 (0.0%) | 0.0 |
| Graduate Degree | 0 (0.0%) | 0.0 |
| Total | 0 (0.0%) | 0.0 |
Fertility by Education by Marriage Status in Wilson
| Educational Attainment | Married | Unmarried |
| Less than High School | 0 (0.0%) | 0 (0.0%) |
| High School Diploma | 0 (0.0%) | 0 (0.0%) |
| College or Associate's Degree | 0 (0.0%) | 0 (0.0%) |
| Bachelor's Degree | 0 (0.0%) | 0 (0.0%) |
| Graduate Degree | 0 (0.0%) | 0 (0.0%) |
| Total | 0 (0.0%) | 0 (0.0%) |
Employment Characteristics in Wilson
Employment by Class of Employer in Wilson
Among the 680 employed individuals in Wilson, private company employees (283 | 41.6%), self-employed (not incorporated) (211 | 31.0%), and not-for-profit organizations (101 | 14.8%) make up the most common classes of employment.
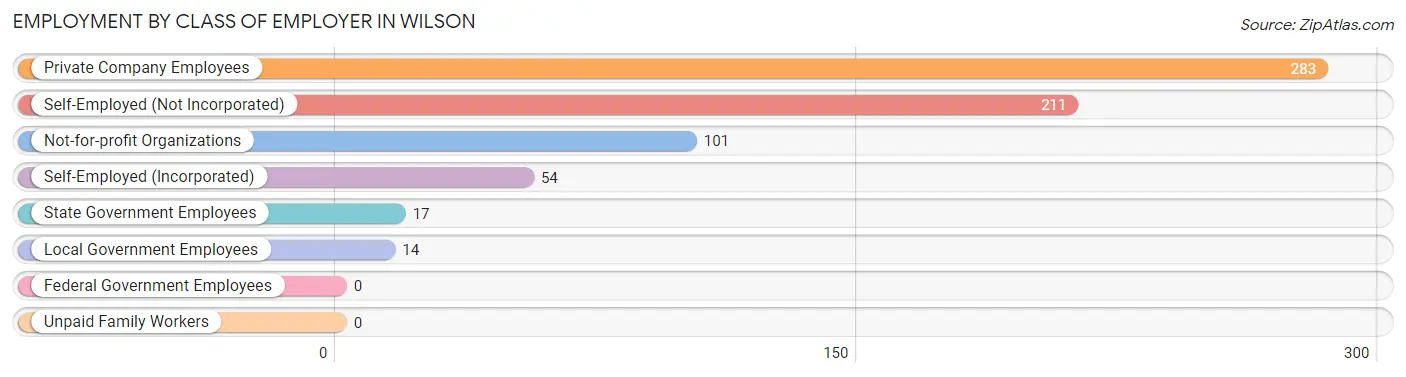
| Employer Class | # Employees | % Employees |
| Private Company Employees | 283 | 41.6% |
| Self-Employed (Incorporated) | 54 | 7.9% |
| Self-Employed (Not Incorporated) | 211 | 31.0% |
| Not-for-profit Organizations | 101 | 14.8% |
| Local Government Employees | 14 | 2.1% |
| State Government Employees | 17 | 2.5% |
| Federal Government Employees | 0 | 0.0% |
| Unpaid Family Workers | 0 | 0.0% |
| Total | 680 | 100.0% |
Employment Status by Age in Wilson
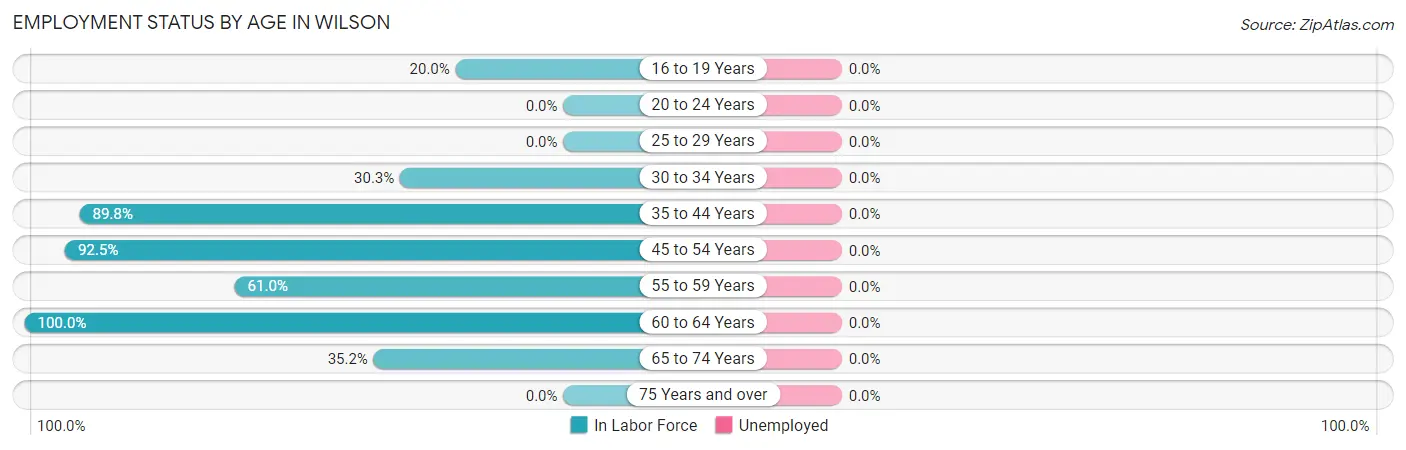
| Age Bracket | In Labor Force | Unemployed |
| 16 to 19 Years | 10 (20.0%) | 0 (0.0%) |
| 20 to 24 Years | 0 (0.0%) | 0 (0.0%) |
| 25 to 29 Years | 0 (0.0%) | 0 (0.0%) |
| 30 to 34 Years | 20 (30.3%) | 0 (0.0%) |
| 35 to 44 Years | 298 (89.8%) | 0 (0.0%) |
| 45 to 54 Years | 136 (92.5%) | 0 (0.0%) |
| 55 to 59 Years | 105 (61.0%) | 0 (0.0%) |
| 60 to 64 Years | 103 (100.0%) | 0 (0.0%) |
| 65 to 74 Years | 81 (35.2%) | 0 (0.0%) |
| 75 Years and over | 0 (0.0%) | 0 (0.0%) |
| Total | 753 (65.9%) | 0 (0.0%) |
Employment Status by Educational Attainment in Wilson
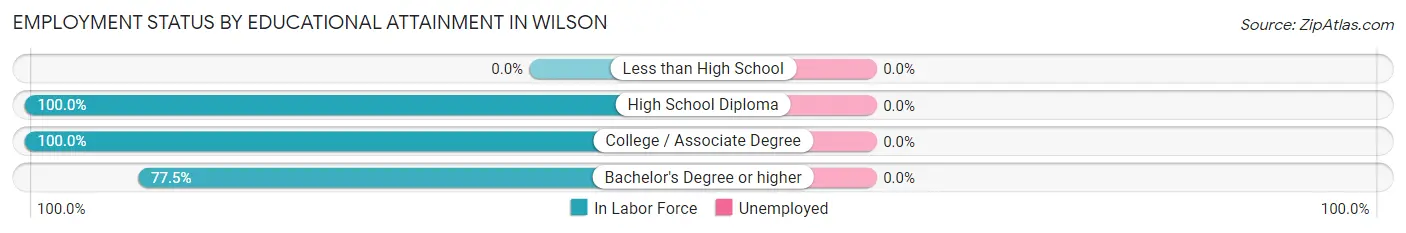
| Educational Attainment | In Labor Force | Unemployed |
| Less than High School | 0 (0.0%) | 0 (0.0%) |
| High School Diploma | 7 (100.0%) | 0 (0.0%) |
| College / Associate Degree | 111 (100.0%) | 0 (0.0%) |
| Bachelor's Degree or higher | 544 (77.5%) | 0 (0.0%) |
| Total | 662 (80.7%) | 0 (0.0%) |
Employment Occupations by Sex in Wilson
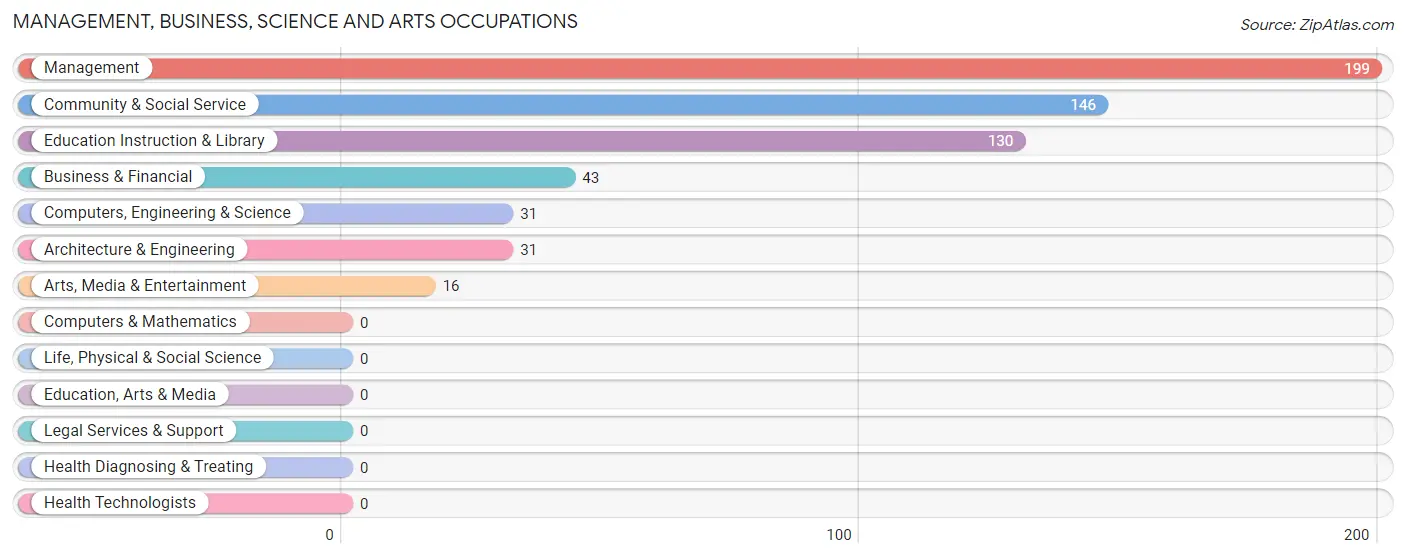
Management, Business, Science and Arts Occupations
The most common Management, Business, Science and Arts occupations in Wilson are Management (199 | 26.4%), Community & Social Service (146 | 19.4%), Education Instruction & Library (130 | 17.3%), Business & Financial (43 | 5.7%), and Computers, Engineering & Science (31 | 4.1%).
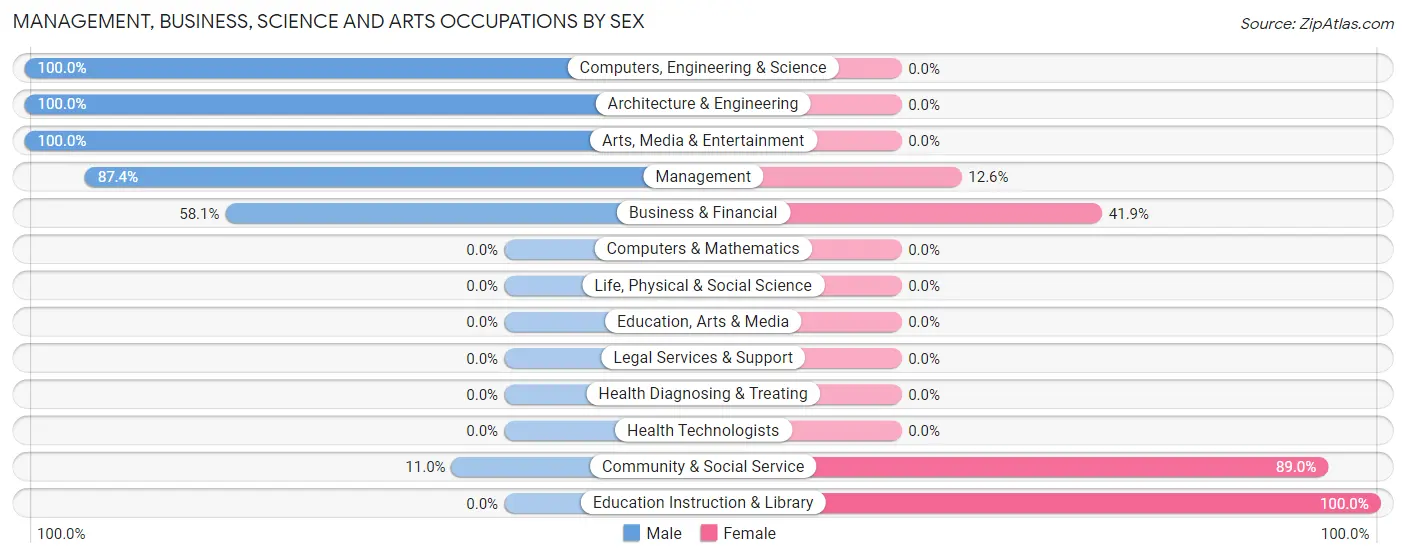
Management, Business, Science and Arts Occupations by Sex
Within the Management, Business, Science and Arts occupations in Wilson, the most male-oriented occupations are Computers, Engineering & Science (100.0%), Architecture & Engineering (100.0%), and Arts, Media & Entertainment (100.0%), while the most female-oriented occupations are Education Instruction & Library (100.0%), Community & Social Service (89.0%), and Business & Financial (41.9%).
| Occupation | Male | Female |
| Management | 174 (87.4%) | 25 (12.6%) |
| Business & Financial | 25 (58.1%) | 18 (41.9%) |
| Computers, Engineering & Science | 31 (100.0%) | 0 (0.0%) |
| Computers & Mathematics | 0 (0.0%) | 0 (0.0%) |
| Architecture & Engineering | 31 (100.0%) | 0 (0.0%) |
| Life, Physical & Social Science | 0 (0.0%) | 0 (0.0%) |
| Community & Social Service | 16 (11.0%) | 130 (89.0%) |
| Education, Arts & Media | 0 (0.0%) | 0 (0.0%) |
| Legal Services & Support | 0 (0.0%) | 0 (0.0%) |
| Education Instruction & Library | 0 (0.0%) | 130 (100.0%) |
| Arts, Media & Entertainment | 16 (100.0%) | 0 (0.0%) |
| Health Diagnosing & Treating | 0 (0.0%) | 0 (0.0%) |
| Health Technologists | 0 (0.0%) | 0 (0.0%) |
| Total (Category) | 246 (58.7%) | 173 (41.3%) |
| Total (Overall) | 507 (67.3%) | 246 (32.7%) |
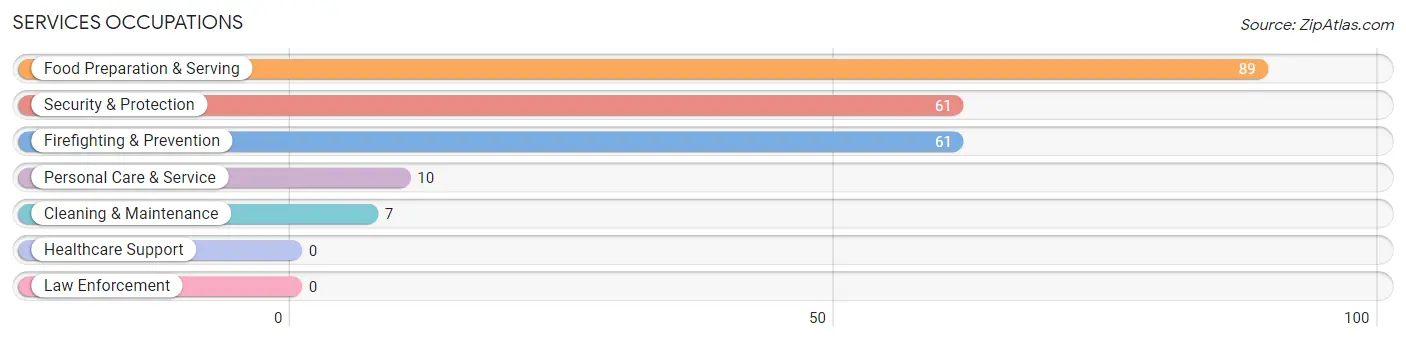
Services Occupations
The most common Services occupations in Wilson are Food Preparation & Serving (89 | 11.8%), Security & Protection (61 | 8.1%), Firefighting & Prevention (61 | 8.1%), Personal Care & Service (10 | 1.3%), and Cleaning & Maintenance (7 | 0.9%).
Services Occupations by Sex
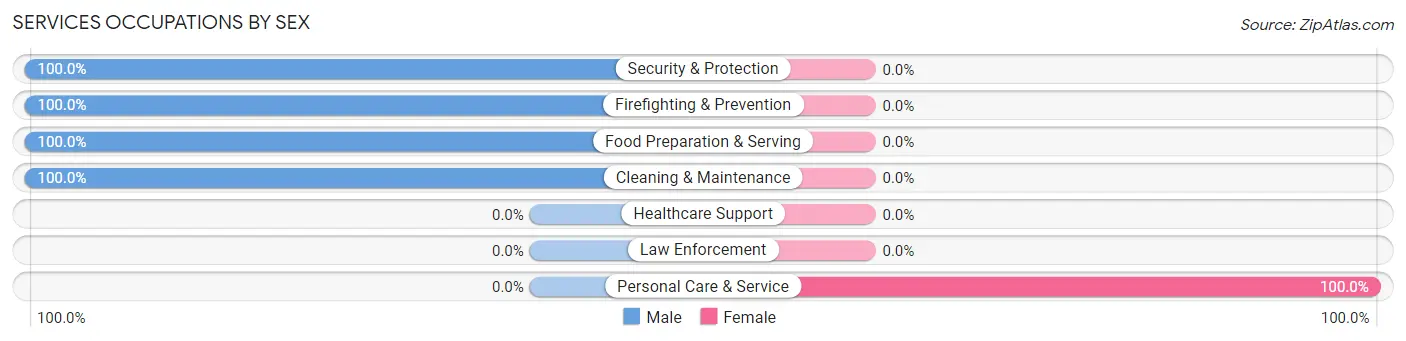
| Occupation | Male | Female |
| Healthcare Support | 0 (0.0%) | 0 (0.0%) |
| Security & Protection | 61 (100.0%) | 0 (0.0%) |
| Firefighting & Prevention | 61 (100.0%) | 0 (0.0%) |
| Law Enforcement | 0 (0.0%) | 0 (0.0%) |
| Food Preparation & Serving | 89 (100.0%) | 0 (0.0%) |
| Cleaning & Maintenance | 7 (100.0%) | 0 (0.0%) |
| Personal Care & Service | 0 (0.0%) | 10 (100.0%) |
| Total (Category) | 157 (94.0%) | 10 (6.0%) |
| Total (Overall) | 507 (67.3%) | 246 (32.7%) |
Sales and Office Occupations
The most common Sales and Office occupations in Wilson are Office & Administration (63 | 8.4%), and Sales & Related (59 | 7.8%).
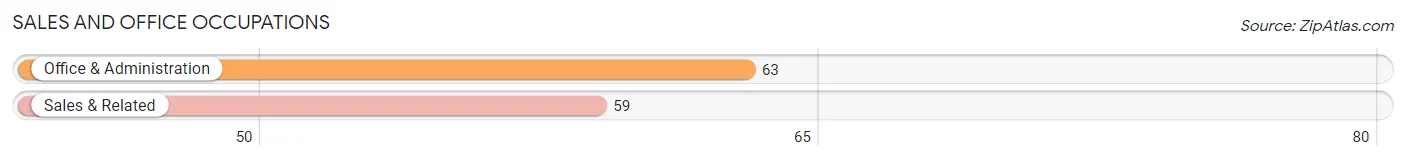
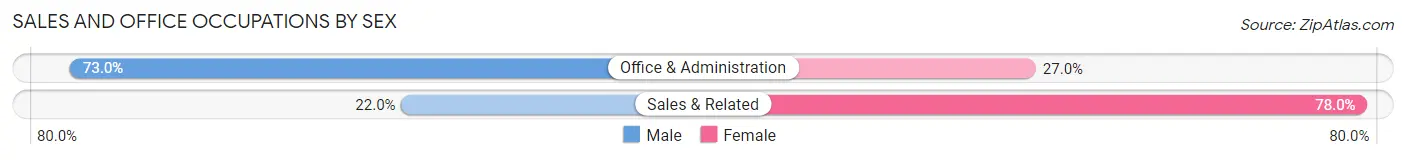
Sales and Office Occupations by Sex
| Occupation | Male | Female |
| Sales & Related | 13 (22.0%) | 46 (78.0%) |
| Office & Administration | 46 (73.0%) | 17 (27.0%) |
| Total (Category) | 59 (48.4%) | 63 (51.6%) |
| Total (Overall) | 507 (67.3%) | 246 (32.7%) |
Natural Resources, Construction and Maintenance Occupations
The most common Natural Resources, Construction and Maintenance occupations in Wilson are , and Installation, Maintenance & Repair (25 | 3.3%).
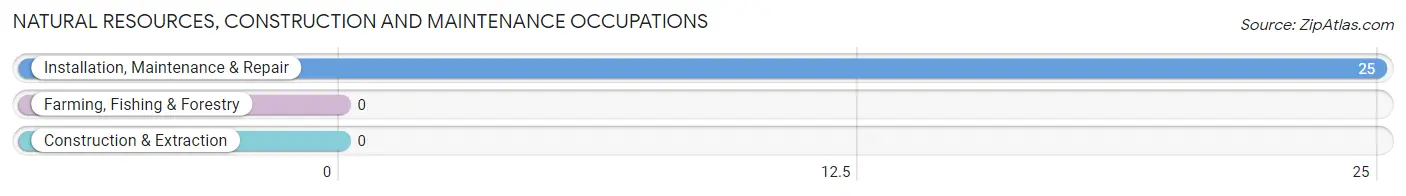
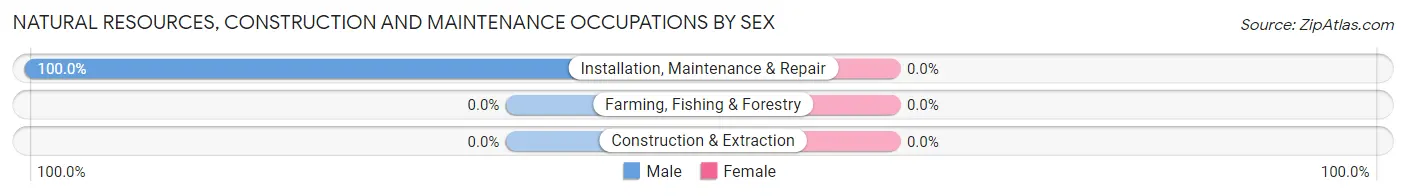
Natural Resources, Construction and Maintenance Occupations by Sex
| Occupation | Male | Female |
| Farming, Fishing & Forestry | 0 (0.0%) | 0 (0.0%) |
| Construction & Extraction | 0 (0.0%) | 0 (0.0%) |
| Installation, Maintenance & Repair | 25 (100.0%) | 0 (0.0%) |
| Total (Category) | 25 (100.0%) | 0 (0.0%) |
| Total (Overall) | 507 (67.3%) | 246 (32.7%) |
Production, Transportation and Moving Occupations
The most common Production, Transportation and Moving occupations in Wilson are , and Production (20 | 2.7%).
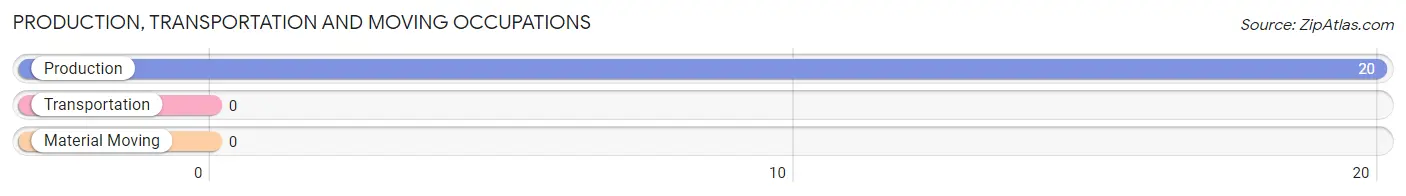
Production, Transportation and Moving Occupations by Sex
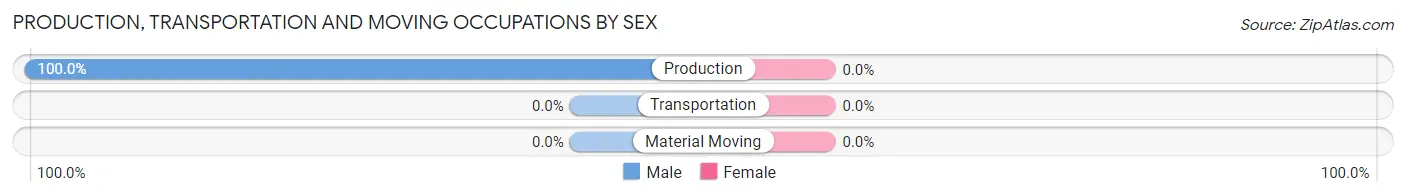
| Occupation | Male | Female |
| Production | 20 (100.0%) | 0 (0.0%) |
| Transportation | 0 (0.0%) | 0 (0.0%) |
| Material Moving | 0 (0.0%) | 0 (0.0%) |
| Total (Category) | 20 (100.0%) | 0 (0.0%) |
| Total (Overall) | 507 (67.3%) | 246 (32.7%) |
Employment Industries by Sex in Wilson
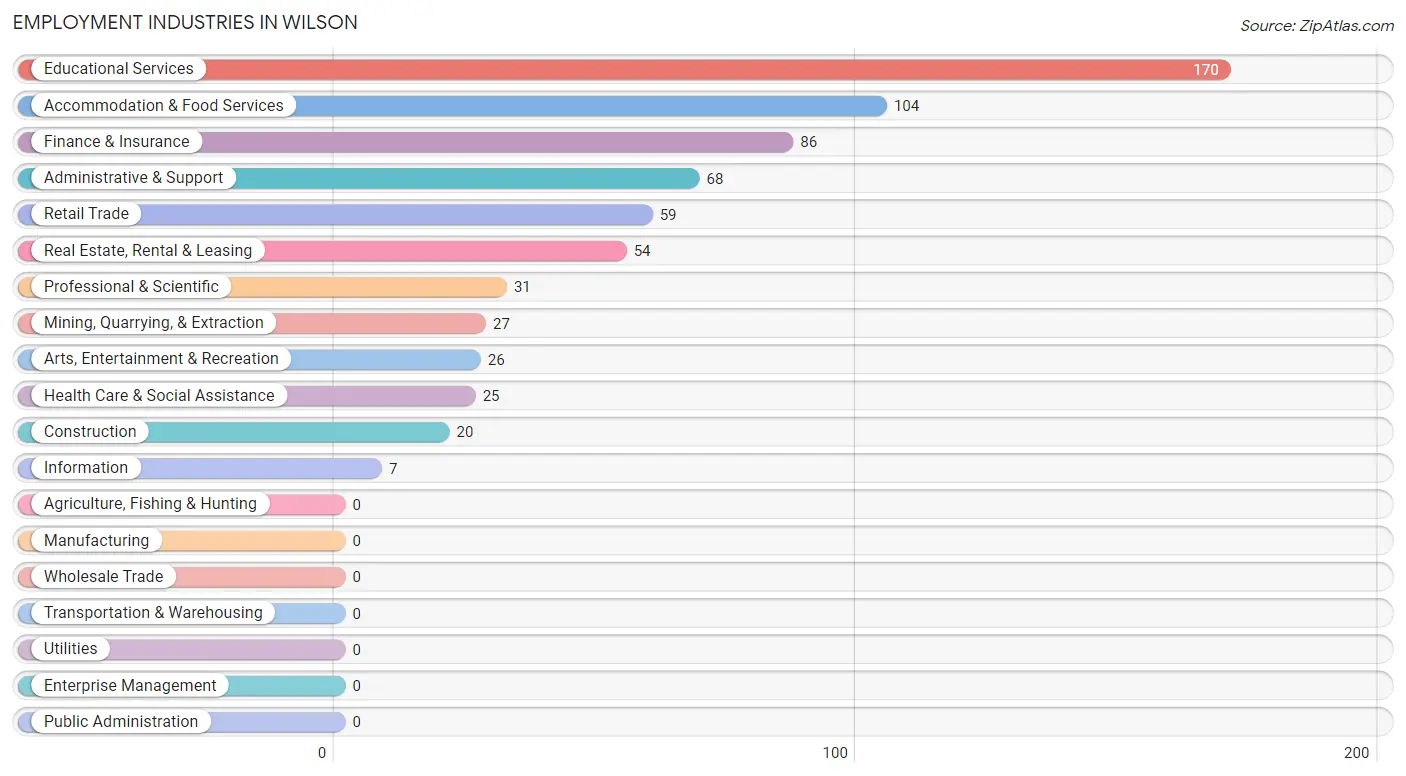
Employment Industries in Wilson
The major employment industries in Wilson include Educational Services (170 | 22.6%), Accommodation & Food Services (104 | 13.8%), Finance & Insurance (86 | 11.4%), Administrative & Support (68 | 9.0%), and Retail Trade (59 | 7.8%).
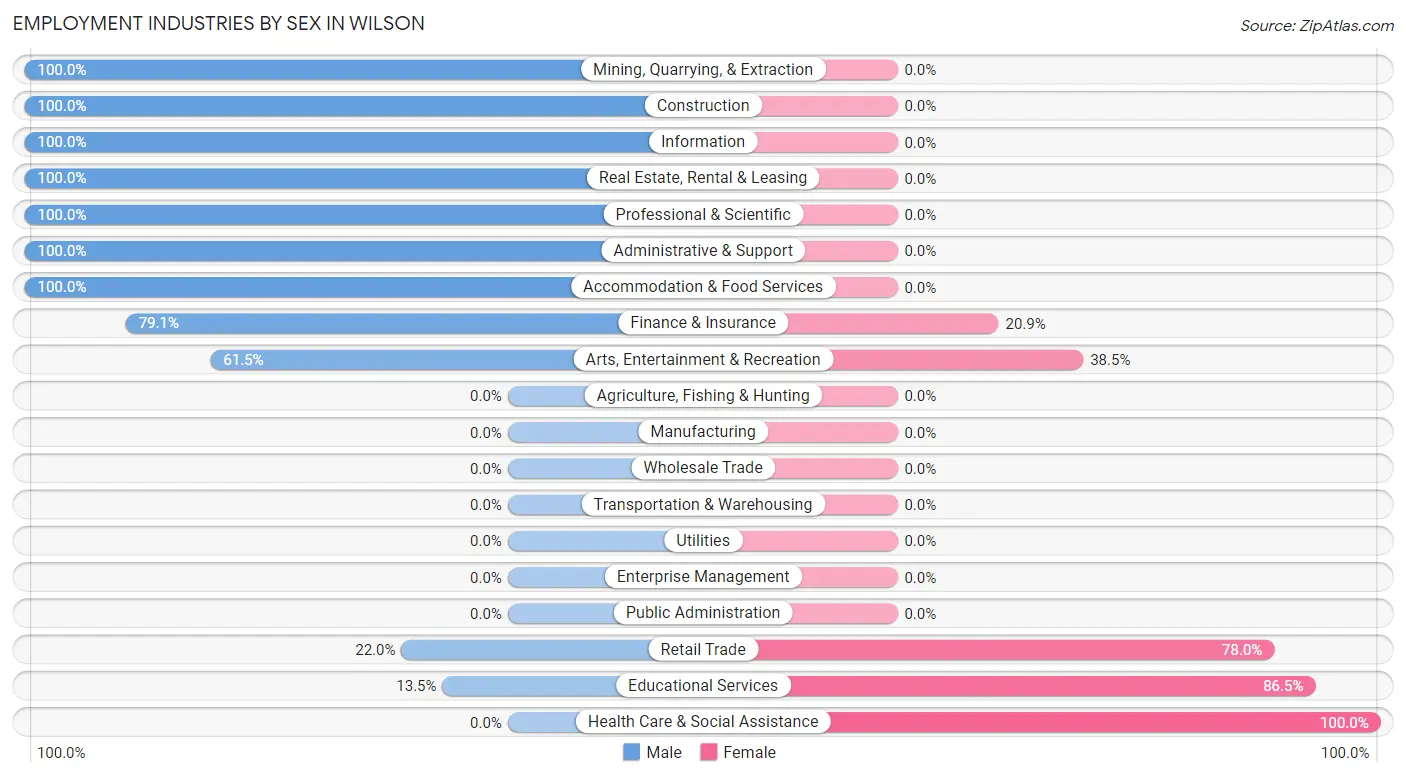
Employment Industries by Sex in Wilson
The Wilson industries that see more men than women are Mining, Quarrying, & Extraction (100.0%), Construction (100.0%), and Information (100.0%), whereas the industries that tend to have a higher number of women are Health Care & Social Assistance (100.0%), Educational Services (86.5%), and Retail Trade (78.0%).
| Industry | Male | Female |
| Agriculture, Fishing & Hunting | 0 (0.0%) | 0 (0.0%) |
| Mining, Quarrying, & Extraction | 27 (100.0%) | 0 (0.0%) |
| Construction | 20 (100.0%) | 0 (0.0%) |
| Manufacturing | 0 (0.0%) | 0 (0.0%) |
| Wholesale Trade | 0 (0.0%) | 0 (0.0%) |
| Retail Trade | 13 (22.0%) | 46 (78.0%) |
| Transportation & Warehousing | 0 (0.0%) | 0 (0.0%) |
| Utilities | 0 (0.0%) | 0 (0.0%) |
| Information | 7 (100.0%) | 0 (0.0%) |
| Finance & Insurance | 68 (79.1%) | 18 (20.9%) |
| Real Estate, Rental & Leasing | 54 (100.0%) | 0 (0.0%) |
| Professional & Scientific | 31 (100.0%) | 0 (0.0%) |
| Enterprise Management | 0 (0.0%) | 0 (0.0%) |
| Administrative & Support | 68 (100.0%) | 0 (0.0%) |
| Educational Services | 23 (13.5%) | 147 (86.5%) |
| Health Care & Social Assistance | 0 (0.0%) | 25 (100.0%) |
| Arts, Entertainment & Recreation | 16 (61.5%) | 10 (38.5%) |
| Accommodation & Food Services | 104 (100.0%) | 0 (0.0%) |
| Public Administration | 0 (0.0%) | 0 (0.0%) |
| Total | 507 (67.3%) | 246 (32.7%) |
Education in Wilson
School Enrollment in Wilson
The most common levels of schooling among the 188 students in Wilson are high school (50 | 26.6%), elementary school (43 | 22.9%), and kindergarten (29 | 15.4%).
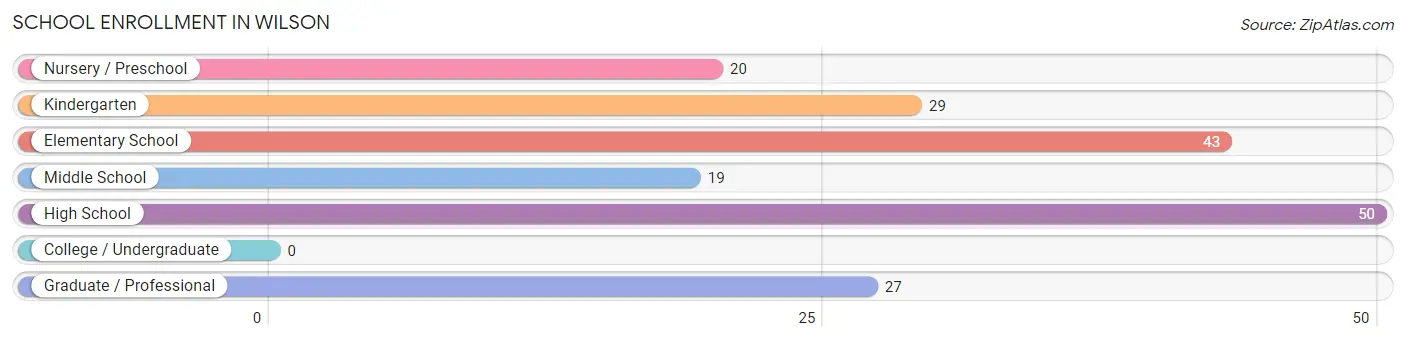
| School Level | # Students | % Students |
| Nursery / Preschool | 20 | 10.6% |
| Kindergarten | 29 | 15.4% |
| Elementary School | 43 | 22.9% |
| Middle School | 19 | 10.1% |
| High School | 50 | 26.6% |
| College / Undergraduate | 0 | 0.0% |
| Graduate / Professional | 27 | 14.4% |
| Total | 188 | 100.0% |
School Enrollment by Age by Funding Source in Wilson
Out of a total of 188 students who are enrolled in schools in Wilson, 95 (50.5%) attend a private institution, while the remaining 93 (49.5%) are enrolled in public schools. The age group of 35 years and over has the highest likelihood of being enrolled in private schools, with 27 (100.0% in the age bracket) enrolled. Conversely, the age group of 3 to 4 year olds has the lowest likelihood of being enrolled in a private school, with 11 (100.0% in the age bracket) attending a public institution.
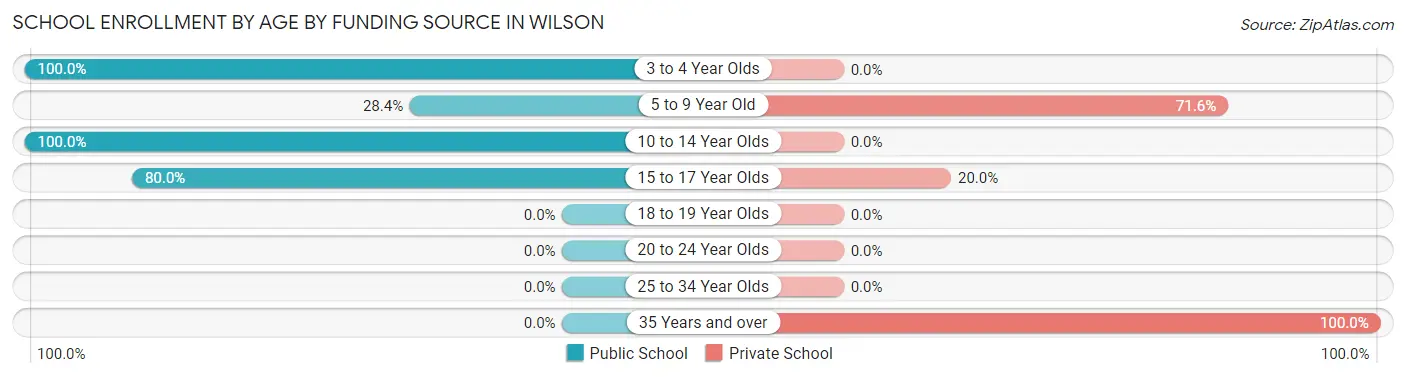
| Age Bracket | Public School | Private School |
| 3 to 4 Year Olds | 11 (100.0%) | 0 (0.0%) |
| 5 to 9 Year Old | 23 (28.4%) | 58 (71.6%) |
| 10 to 14 Year Olds | 19 (100.0%) | 0 (0.0%) |
| 15 to 17 Year Olds | 40 (80.0%) | 10 (20.0%) |
| 18 to 19 Year Olds | 0 (0.0%) | 0 (0.0%) |
| 20 to 24 Year Olds | 0 (0.0%) | 0 (0.0%) |
| 25 to 34 Year Olds | 0 (0.0%) | 0 (0.0%) |
| 35 Years and over | 0 (0.0%) | 27 (100.0%) |
| Total | 93 (49.5%) | 95 (50.5%) |
Educational Attainment by Field of Study in Wilson
Business (205 | 19.1%), education (138 | 12.8%), psychology (124 | 11.5%), science & technology (106 | 9.9%), and arts & humanities (91 | 8.5%) are the most common fields of study among 1,075 individuals in Wilson who have obtained a bachelor's degree or higher.
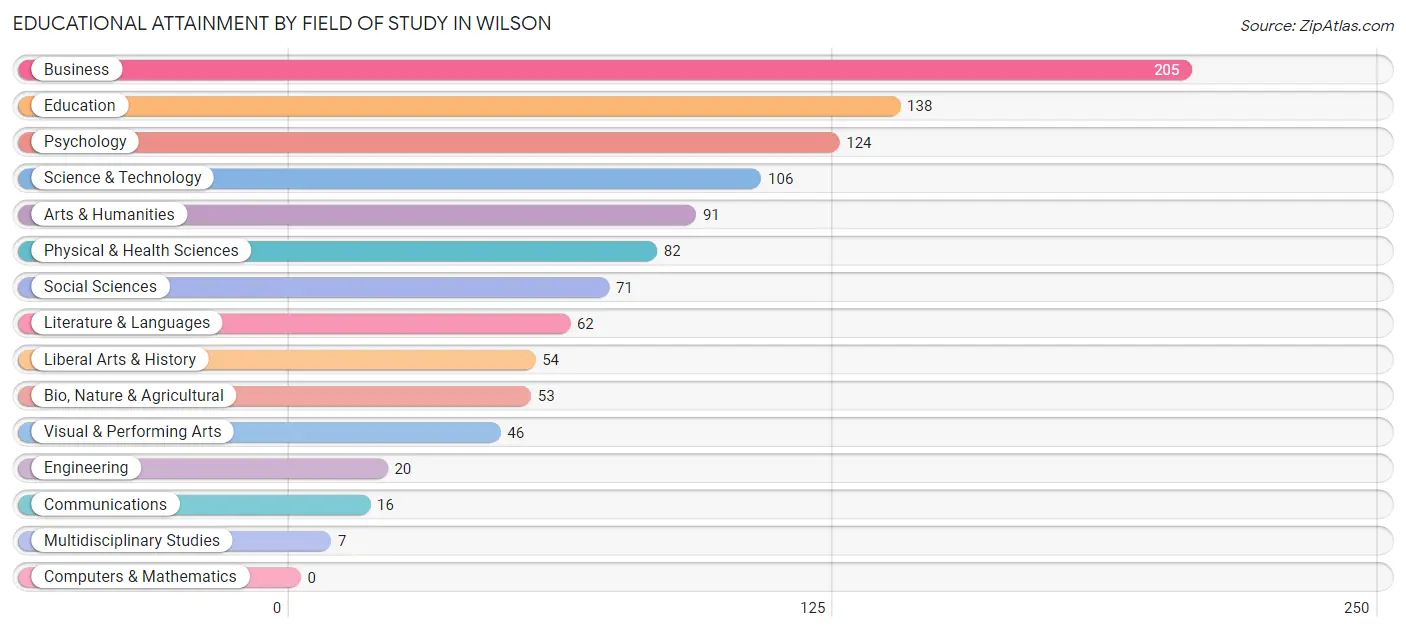
| Field of Study | # Graduates | % Graduates |
| Computers & Mathematics | 0 | 0.0% |
| Bio, Nature & Agricultural | 53 | 4.9% |
| Physical & Health Sciences | 82 | 7.6% |
| Psychology | 124 | 11.5% |
| Social Sciences | 71 | 6.6% |
| Engineering | 20 | 1.9% |
| Multidisciplinary Studies | 7 | 0.6% |
| Science & Technology | 106 | 9.9% |
| Business | 205 | 19.1% |
| Education | 138 | 12.8% |
| Literature & Languages | 62 | 5.8% |
| Liberal Arts & History | 54 | 5.0% |
| Visual & Performing Arts | 46 | 4.3% |
| Communications | 16 | 1.5% |
| Arts & Humanities | 91 | 8.5% |
| Total | 1,075 | 100.0% |
Transportation & Commute in Wilson
Vehicle Availability by Sex in Wilson
The most prevalent vehicle ownership categories in Wilson are males with 2 vehicles (384, accounting for 75.7%) and females with 2 vehicles (123, making up 222.0%).
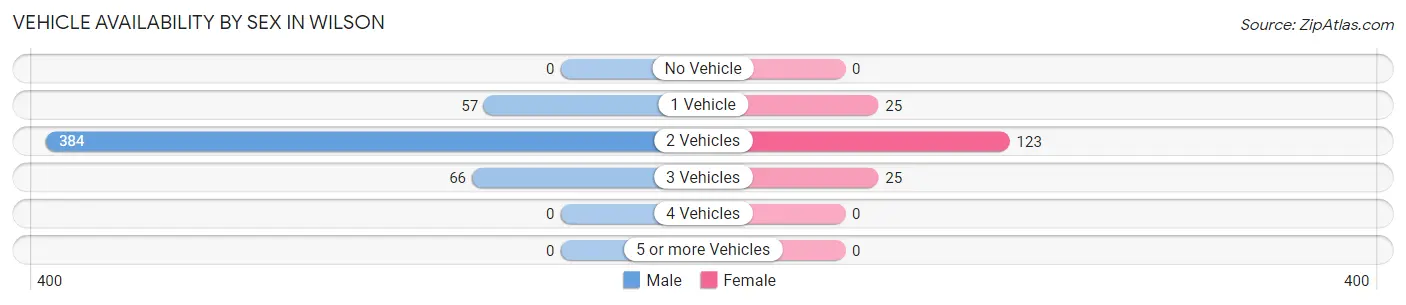
| Vehicles Available | Male | Female |
| No Vehicle | 0 (0.0%) | 0 (0.0%) |
| 1 Vehicle | 57 (11.2%) | 25 (14.4%) |
| 2 Vehicles | 384 (75.7%) | 123 (71.1%) |
| 3 Vehicles | 66 (13.0%) | 25 (14.4%) |
| 4 Vehicles | 0 (0.0%) | 0 (0.0%) |
| 5 or more Vehicles | 0 (0.0%) | 0 (0.0%) |
| Total | 507 (100.0%) | 173 (100.0%) |
Commute Time in Wilson
The most frequently occuring commute durations in Wilson are 20 to 24 minutes (227 commuters, 42.5%), 5 to 9 minutes (111 commuters, 20.8%), and 15 to 19 minutes (62 commuters, 11.6%).
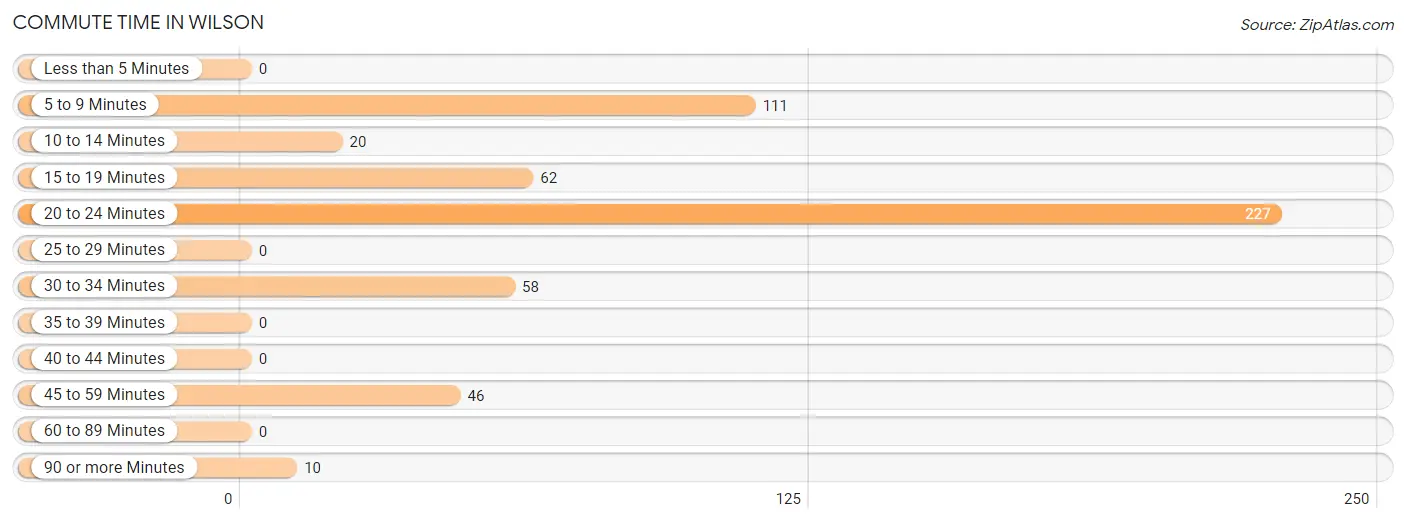
| Commute Time | # Commuters | % Commuters |
| Less than 5 Minutes | 0 | 0.0% |
| 5 to 9 Minutes | 111 | 20.8% |
| 10 to 14 Minutes | 20 | 3.7% |
| 15 to 19 Minutes | 62 | 11.6% |
| 20 to 24 Minutes | 227 | 42.5% |
| 25 to 29 Minutes | 0 | 0.0% |
| 30 to 34 Minutes | 58 | 10.9% |
| 35 to 39 Minutes | 0 | 0.0% |
| 40 to 44 Minutes | 0 | 0.0% |
| 45 to 59 Minutes | 46 | 8.6% |
| 60 to 89 Minutes | 0 | 0.0% |
| 90 or more Minutes | 10 | 1.9% |
Commute Time by Sex in Wilson
The most common commute times in Wilson are 20 to 24 minutes (184 commuters, 48.7%) for males and 15 to 19 minutes (55 commuters, 35.3%) for females.
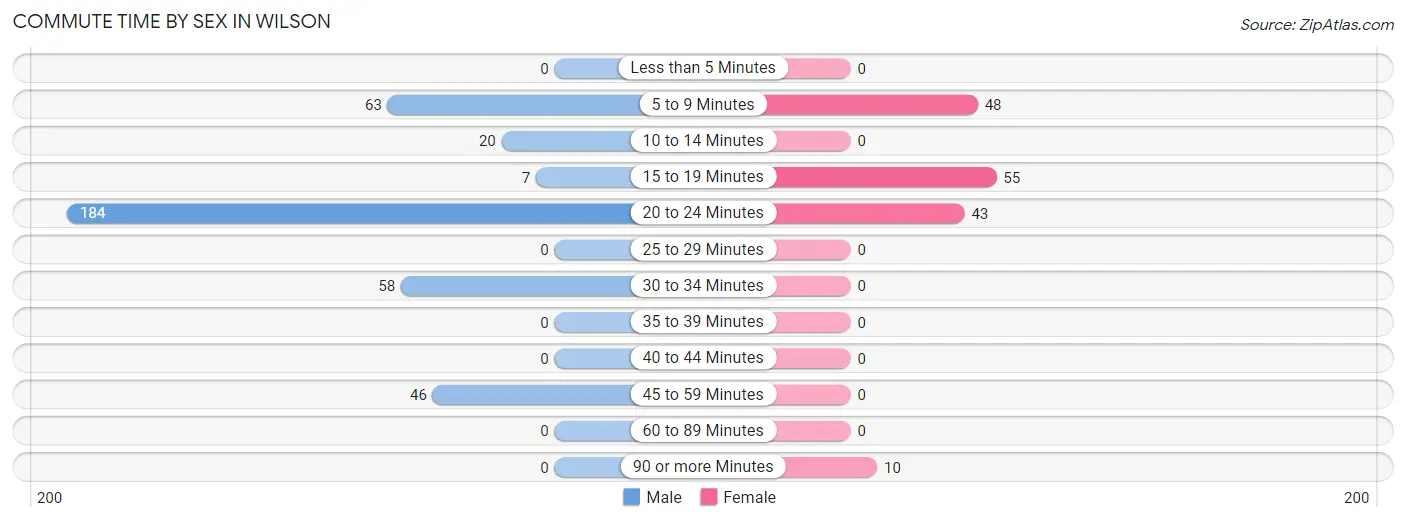
| Commute Time | Male | Female |
| Less than 5 Minutes | 0 (0.0%) | 0 (0.0%) |
| 5 to 9 Minutes | 63 (16.7%) | 48 (30.8%) |
| 10 to 14 Minutes | 20 (5.3%) | 0 (0.0%) |
| 15 to 19 Minutes | 7 (1.8%) | 55 (35.3%) |
| 20 to 24 Minutes | 184 (48.7%) | 43 (27.6%) |
| 25 to 29 Minutes | 0 (0.0%) | 0 (0.0%) |
| 30 to 34 Minutes | 58 (15.3%) | 0 (0.0%) |
| 35 to 39 Minutes | 0 (0.0%) | 0 (0.0%) |
| 40 to 44 Minutes | 0 (0.0%) | 0 (0.0%) |
| 45 to 59 Minutes | 46 (12.2%) | 0 (0.0%) |
| 60 to 89 Minutes | 0 (0.0%) | 0 (0.0%) |
| 90 or more Minutes | 0 (0.0%) | 10 (6.4%) |
Time of Departure to Work by Sex in Wilson
The most frequent times of departure to work in Wilson are 9:00 AM to 9:59 AM (137, 36.2%) for males and 7:00 AM to 7:29 AM (60, 38.5%) for females.
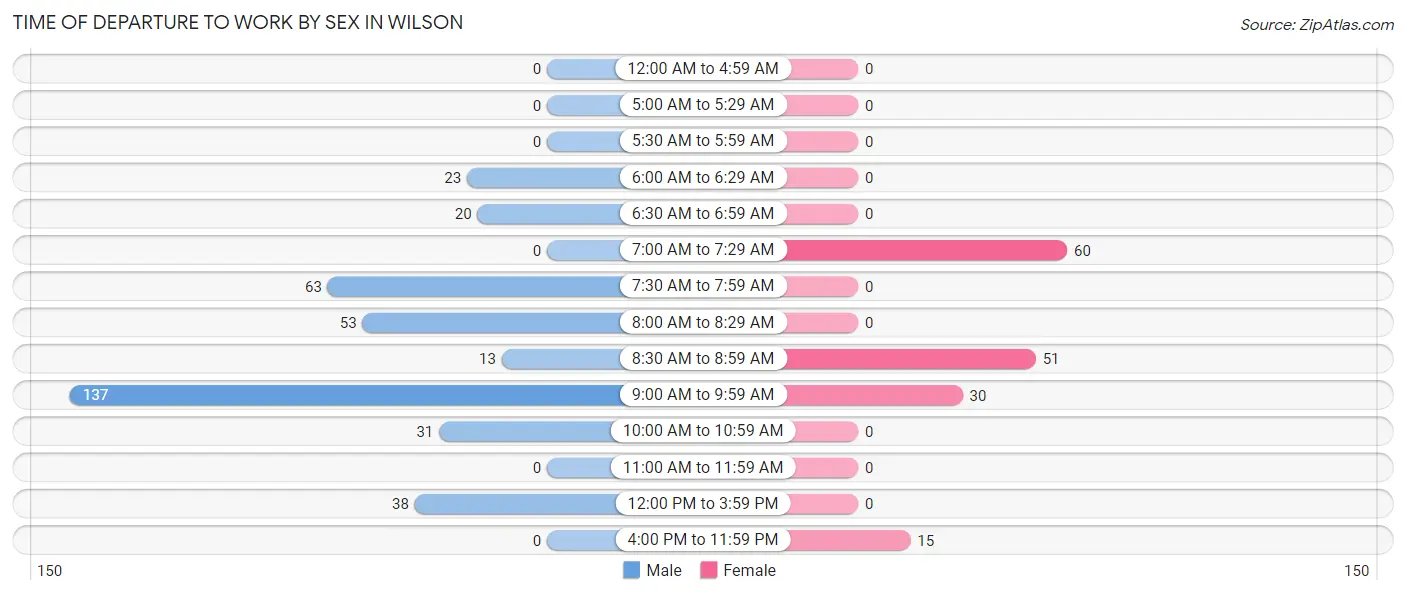
| Time of Departure | Male | Female |
| 12:00 AM to 4:59 AM | 0 (0.0%) | 0 (0.0%) |
| 5:00 AM to 5:29 AM | 0 (0.0%) | 0 (0.0%) |
| 5:30 AM to 5:59 AM | 0 (0.0%) | 0 (0.0%) |
| 6:00 AM to 6:29 AM | 23 (6.1%) | 0 (0.0%) |
| 6:30 AM to 6:59 AM | 20 (5.3%) | 0 (0.0%) |
| 7:00 AM to 7:29 AM | 0 (0.0%) | 60 (38.5%) |
| 7:30 AM to 7:59 AM | 63 (16.7%) | 0 (0.0%) |
| 8:00 AM to 8:29 AM | 53 (14.0%) | 0 (0.0%) |
| 8:30 AM to 8:59 AM | 13 (3.4%) | 51 (32.7%) |
| 9:00 AM to 9:59 AM | 137 (36.2%) | 30 (19.2%) |
| 10:00 AM to 10:59 AM | 31 (8.2%) | 0 (0.0%) |
| 11:00 AM to 11:59 AM | 0 (0.0%) | 0 (0.0%) |
| 12:00 PM to 3:59 PM | 38 (10.1%) | 0 (0.0%) |
| 4:00 PM to 11:59 PM | 0 (0.0%) | 15 (9.6%) |
| Total | 378 (100.0%) | 156 (100.0%) |
Housing Occupancy in Wilson
Occupancy by Ownership in Wilson
Of the total 582 dwellings in Wilson, owner-occupied units account for 517 (88.8%), while renter-occupied units make up 65 (11.2%).
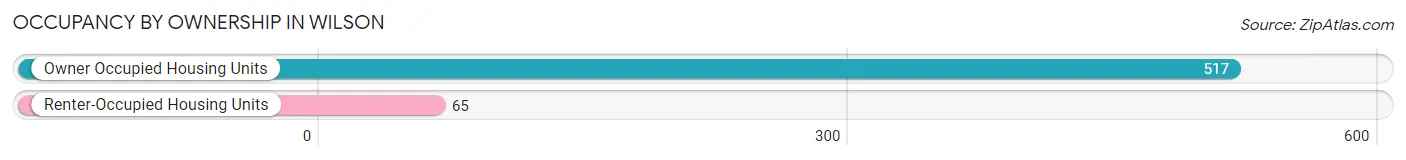
| Occupancy | # Housing Units | % Housing Units |
| Owner Occupied Housing Units | 517 | 88.8% |
| Renter-Occupied Housing Units | 65 | 11.2% |
| Total Occupied Housing Units | 582 | 100.0% |
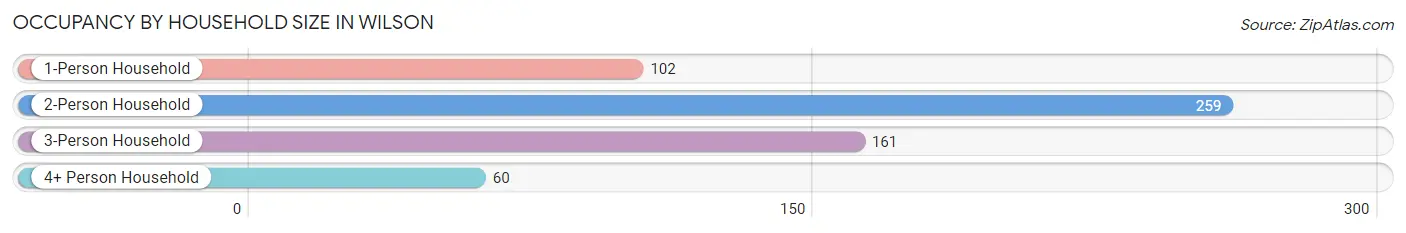
Occupancy by Household Size in Wilson
| Household Size | # Housing Units | % Housing Units |
| 1-Person Household | 102 | 17.5% |
| 2-Person Household | 259 | 44.5% |
| 3-Person Household | 161 | 27.7% |
| 4+ Person Household | 60 | 10.3% |
| Total Housing Units | 582 | 100.0% |
Occupancy by Ownership by Household Size in Wilson
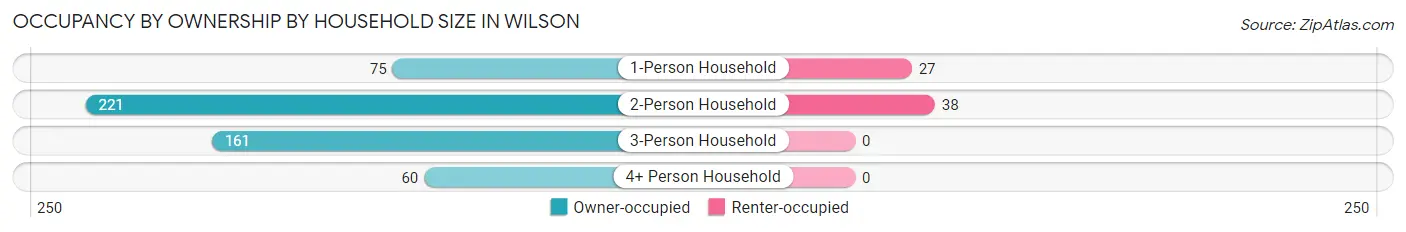
| Household Size | Owner-occupied | Renter-occupied |
| 1-Person Household | 75 (73.5%) | 27 (26.5%) |
| 2-Person Household | 221 (85.3%) | 38 (14.7%) |
| 3-Person Household | 161 (100.0%) | 0 (0.0%) |
| 4+ Person Household | 60 (100.0%) | 0 (0.0%) |
| Total Housing Units | 517 (88.8%) | 65 (11.2%) |
Occupancy by Educational Attainment in Wilson
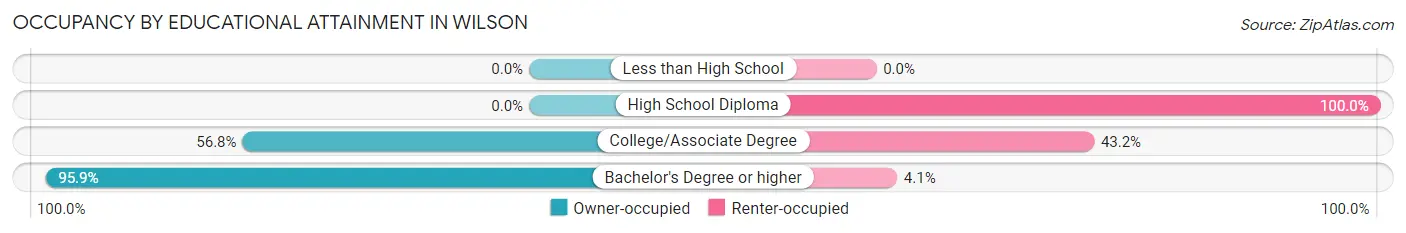
| Household Size | Owner-occupied | Renter-occupied |
| Less than High School | 0 (0.0%) | 0 (0.0%) |
| High School Diploma | 0 (0.0%) | 7 (100.0%) |
| College/Associate Degree | 50 (56.8%) | 38 (43.2%) |
| Bachelor's Degree or higher | 467 (95.9%) | 20 (4.1%) |
Occupancy by Age of Householder in Wilson
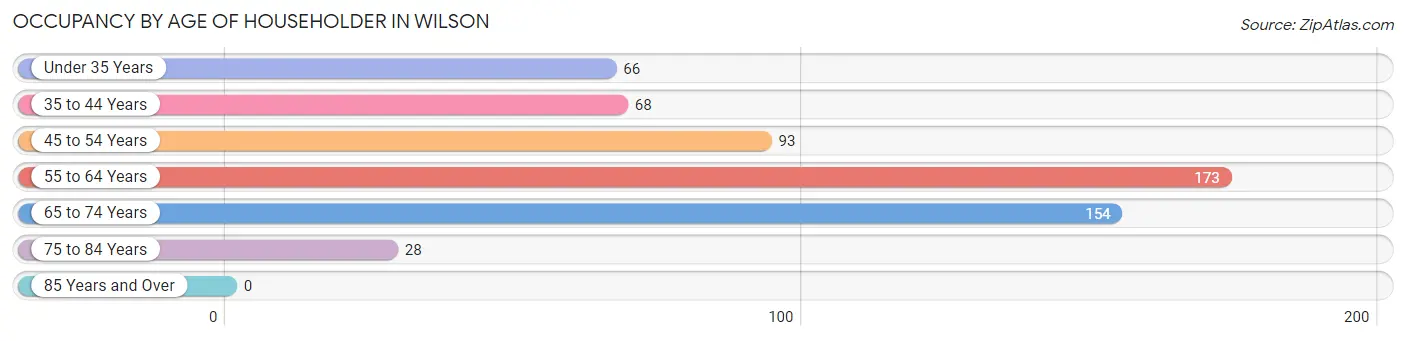
| Age Bracket | # Households | % Households |
| Under 35 Years | 66 | 11.3% |
| 35 to 44 Years | 68 | 11.7% |
| 45 to 54 Years | 93 | 16.0% |
| 55 to 64 Years | 173 | 29.7% |
| 65 to 74 Years | 154 | 26.5% |
| 75 to 84 Years | 28 | 4.8% |
| 85 Years and Over | 0 | 0.0% |
| Total | 582 | 100.0% |
Housing Finances in Wilson
Median Income by Occupancy in Wilson
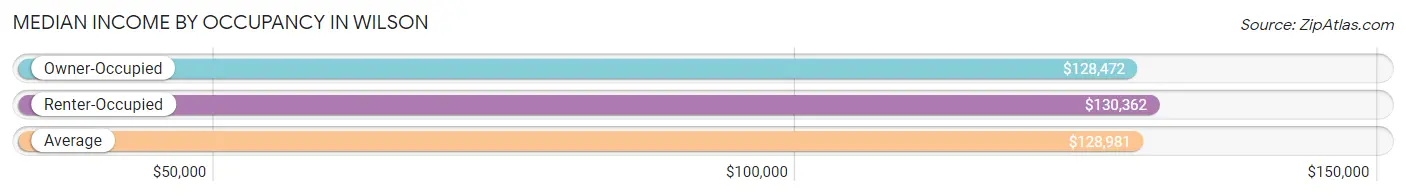
| Occupancy Type | # Households | Median Income |
| Owner-Occupied | 517 (88.8%) | $128,472 |
| Renter-Occupied | 65 (11.2%) | $130,362 |
| Average | 582 (100.0%) | $128,981 |
Occupancy by Householder Income Bracket in Wilson
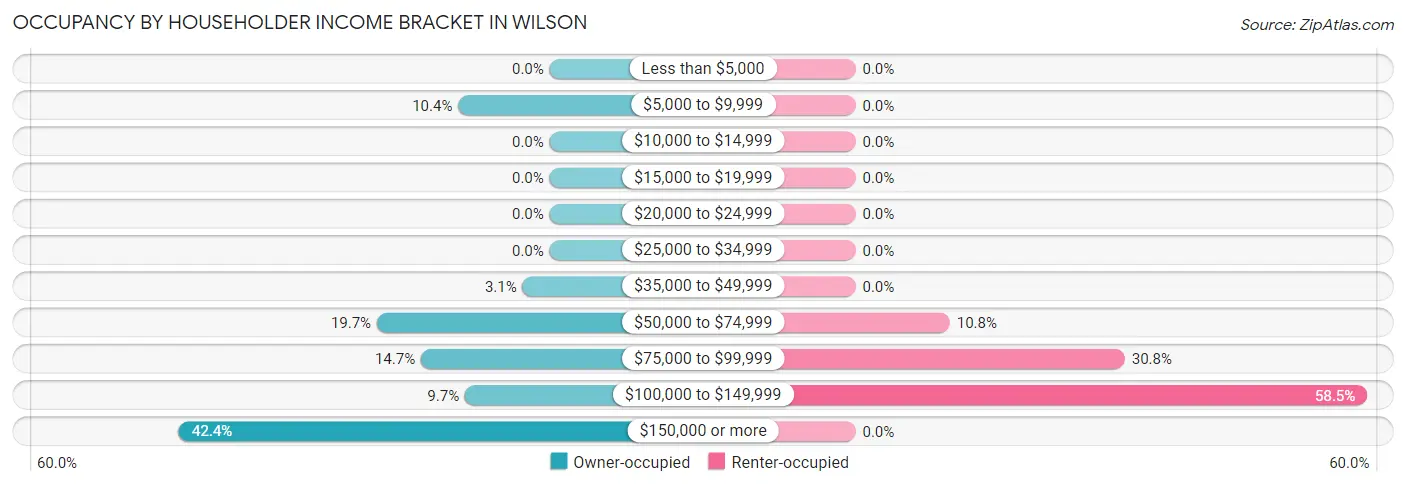
| Income Bracket | Owner-occupied | Renter-occupied |
| Less than $5,000 | 0 (0.0%) | 0 (0.0%) |
| $5,000 to $9,999 | 54 (10.4%) | 0 (0.0%) |
| $10,000 to $14,999 | 0 (0.0%) | 0 (0.0%) |
| $15,000 to $19,999 | 0 (0.0%) | 0 (0.0%) |
| $20,000 to $24,999 | 0 (0.0%) | 0 (0.0%) |
| $25,000 to $34,999 | 0 (0.0%) | 0 (0.0%) |
| $35,000 to $49,999 | 16 (3.1%) | 0 (0.0%) |
| $50,000 to $74,999 | 102 (19.7%) | 7 (10.8%) |
| $75,000 to $99,999 | 76 (14.7%) | 20 (30.8%) |
| $100,000 to $149,999 | 50 (9.7%) | 38 (58.5%) |
| $150,000 or more | 219 (42.4%) | 0 (0.0%) |
| Total | 517 (100.0%) | 65 (100.0%) |
Monthly Housing Cost Tiers in Wilson
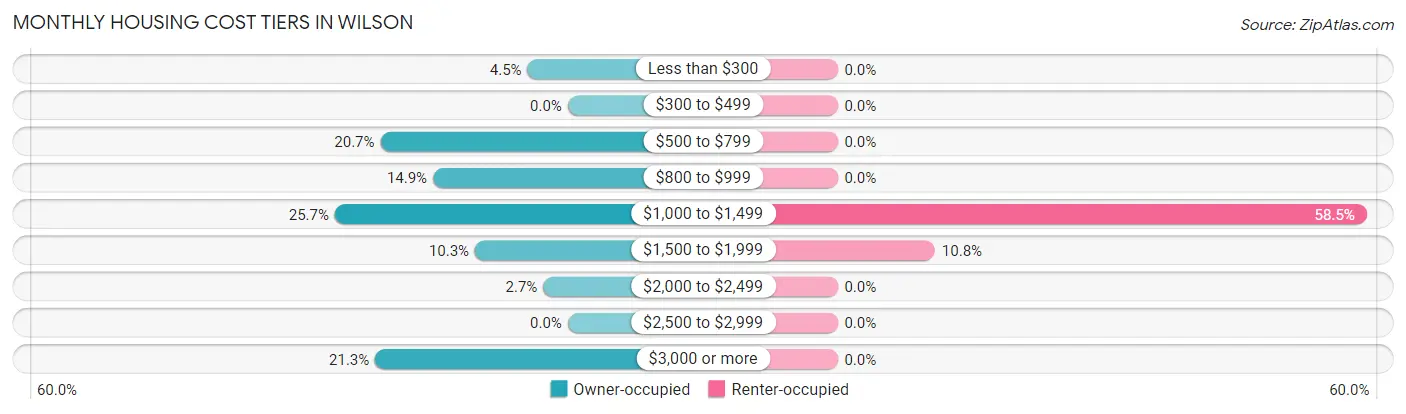
| Monthly Cost | Owner-occupied | Renter-occupied |
| Less than $300 | 23 (4.4%) | 0 (0.0%) |
| $300 to $499 | 0 (0.0%) | 0 (0.0%) |
| $500 to $799 | 107 (20.7%) | 0 (0.0%) |
| $800 to $999 | 77 (14.9%) | 0 (0.0%) |
| $1,000 to $1,499 | 133 (25.7%) | 38 (58.5%) |
| $1,500 to $1,999 | 53 (10.2%) | 7 (10.8%) |
| $2,000 to $2,499 | 14 (2.7%) | 0 (0.0%) |
| $2,500 to $2,999 | 0 (0.0%) | 0 (0.0%) |
| $3,000 or more | 110 (21.3%) | 0 (0.0%) |
| Total | 517 (100.0%) | 65 (100.0%) |
Physical Housing Characteristics in Wilson
Housing Structures in Wilson
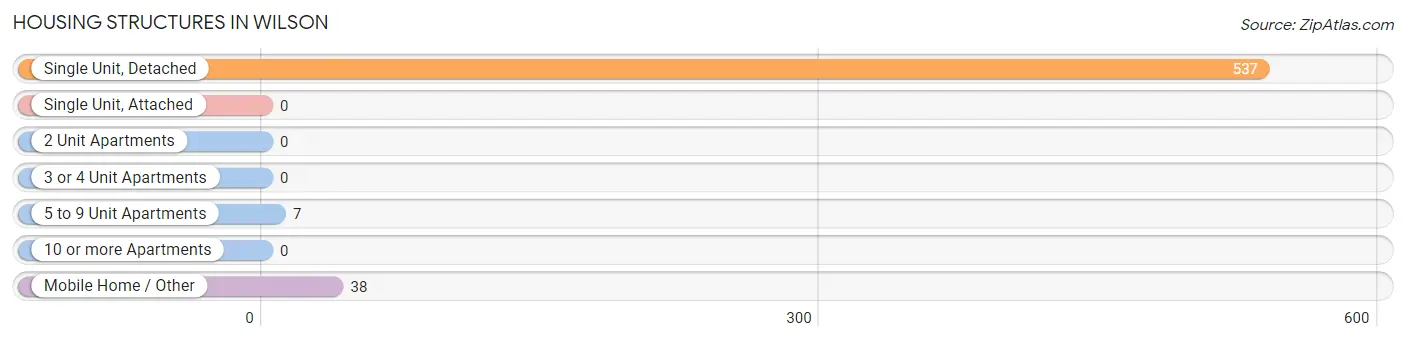
| Structure Type | # Housing Units | % Housing Units |
| Single Unit, Detached | 537 | 92.3% |
| Single Unit, Attached | 0 | 0.0% |
| 2 Unit Apartments | 0 | 0.0% |
| 3 or 4 Unit Apartments | 0 | 0.0% |
| 5 to 9 Unit Apartments | 7 | 1.2% |
| 10 or more Apartments | 0 | 0.0% |
| Mobile Home / Other | 38 | 6.5% |
| Total | 582 | 100.0% |
Housing Structures by Occupancy in Wilson
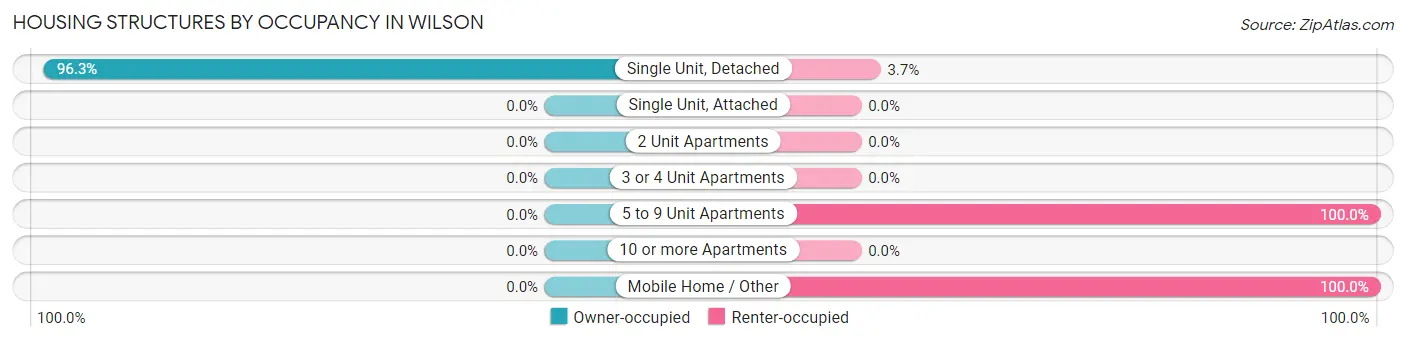
| Structure Type | Owner-occupied | Renter-occupied |
| Single Unit, Detached | 517 (96.3%) | 20 (3.7%) |
| Single Unit, Attached | 0 (0.0%) | 0 (0.0%) |
| 2 Unit Apartments | 0 (0.0%) | 0 (0.0%) |
| 3 or 4 Unit Apartments | 0 (0.0%) | 0 (0.0%) |
| 5 to 9 Unit Apartments | 0 (0.0%) | 7 (100.0%) |
| 10 or more Apartments | 0 (0.0%) | 0 (0.0%) |
| Mobile Home / Other | 0 (0.0%) | 38 (100.0%) |
| Total | 517 (88.8%) | 65 (11.2%) |
Housing Structures by Number of Rooms in Wilson
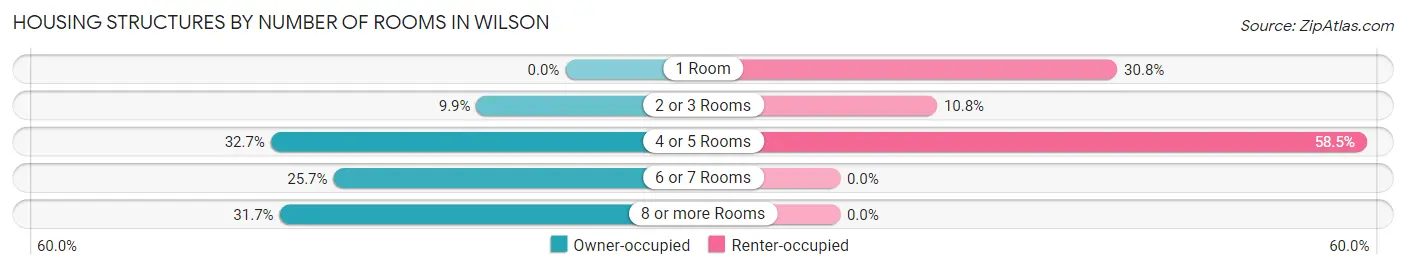
| Number of Rooms | Owner-occupied | Renter-occupied |
| 1 Room | 0 (0.0%) | 20 (30.8%) |
| 2 or 3 Rooms | 51 (9.9%) | 7 (10.8%) |
| 4 or 5 Rooms | 169 (32.7%) | 38 (58.5%) |
| 6 or 7 Rooms | 133 (25.7%) | 0 (0.0%) |
| 8 or more Rooms | 164 (31.7%) | 0 (0.0%) |
| Total | 517 (100.0%) | 65 (100.0%) |
Housing Structure by Heating Type in Wilson
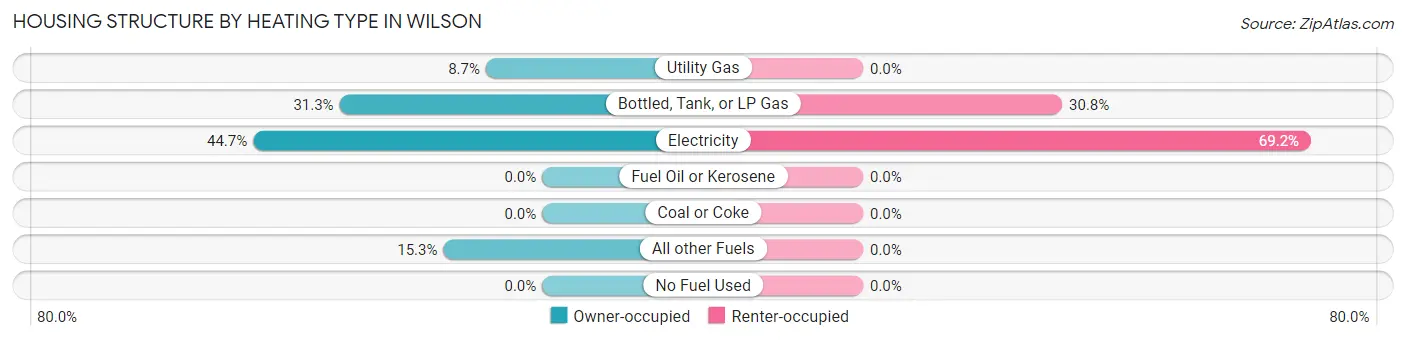
| Heating Type | Owner-occupied | Renter-occupied |
| Utility Gas | 45 (8.7%) | 0 (0.0%) |
| Bottled, Tank, or LP Gas | 162 (31.3%) | 20 (30.8%) |
| Electricity | 231 (44.7%) | 45 (69.2%) |
| Fuel Oil or Kerosene | 0 (0.0%) | 0 (0.0%) |
| Coal or Coke | 0 (0.0%) | 0 (0.0%) |
| All other Fuels | 79 (15.3%) | 0 (0.0%) |
| No Fuel Used | 0 (0.0%) | 0 (0.0%) |
| Total | 517 (100.0%) | 65 (100.0%) |
Household Vehicle Usage in Wilson
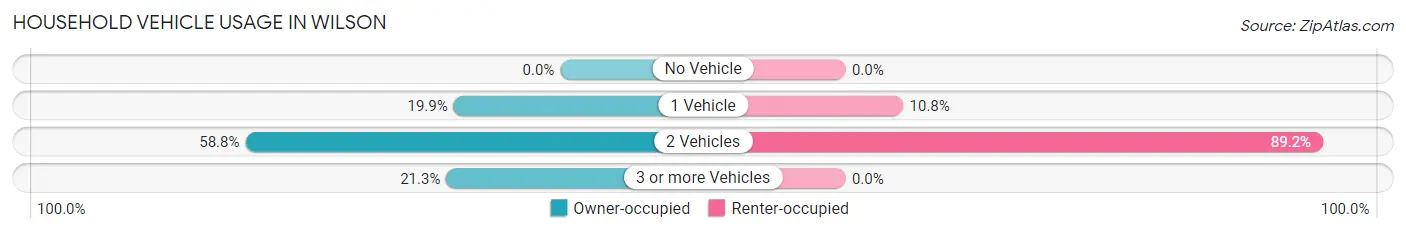
| Vehicles per Household | Owner-occupied | Renter-occupied |
| No Vehicle | 0 (0.0%) | 0 (0.0%) |
| 1 Vehicle | 103 (19.9%) | 7 (10.8%) |
| 2 Vehicles | 304 (58.8%) | 58 (89.2%) |
| 3 or more Vehicles | 110 (21.3%) | 0 (0.0%) |
| Total | 517 (100.0%) | 65 (100.0%) |
Real Estate & Mortgages in Wilson
Real Estate and Mortgage Overview in Wilson
| Characteristic | Without Mortgage | With Mortgage |
| Housing Units | 295 | 222 |
| Median Property Value | - | - |
| Median Household Income | $96,838 | $135 |
| Monthly Housing Costs | $956 | $110 |
| Real Estate Taxes | - | - |
Property Value by Mortgage Status in Wilson
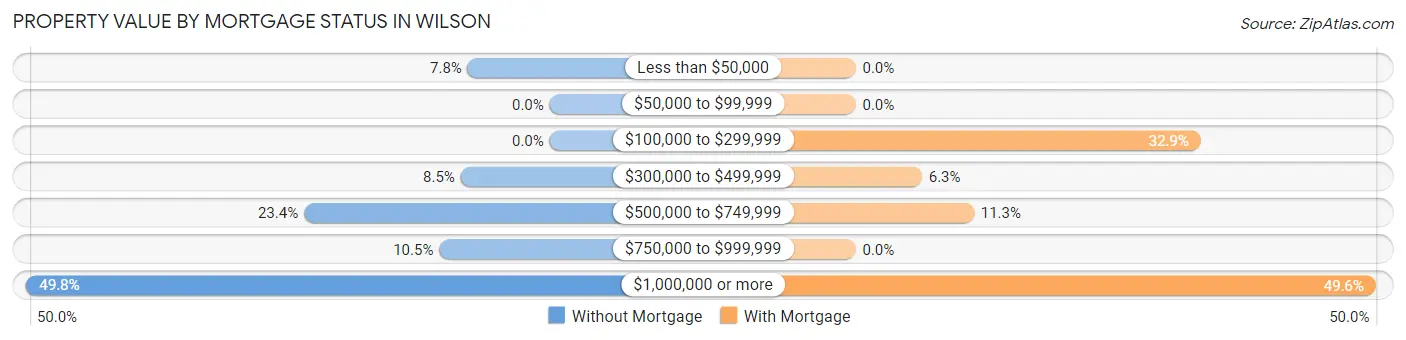
| Property Value | Without Mortgage | With Mortgage |
| Less than $50,000 | 23 (7.8%) | 0 (0.0%) |
| $50,000 to $99,999 | 0 (0.0%) | 0 (0.0%) |
| $100,000 to $299,999 | 0 (0.0%) | 73 (32.9%) |
| $300,000 to $499,999 | 25 (8.5%) | 14 (6.3%) |
| $500,000 to $749,999 | 69 (23.4%) | 25 (11.3%) |
| $750,000 to $999,999 | 31 (10.5%) | 0 (0.0%) |
| $1,000,000 or more | 147 (49.8%) | 110 (49.5%) |
| Total | 295 (100.0%) | 222 (100.0%) |
Household Income by Mortgage Status in Wilson
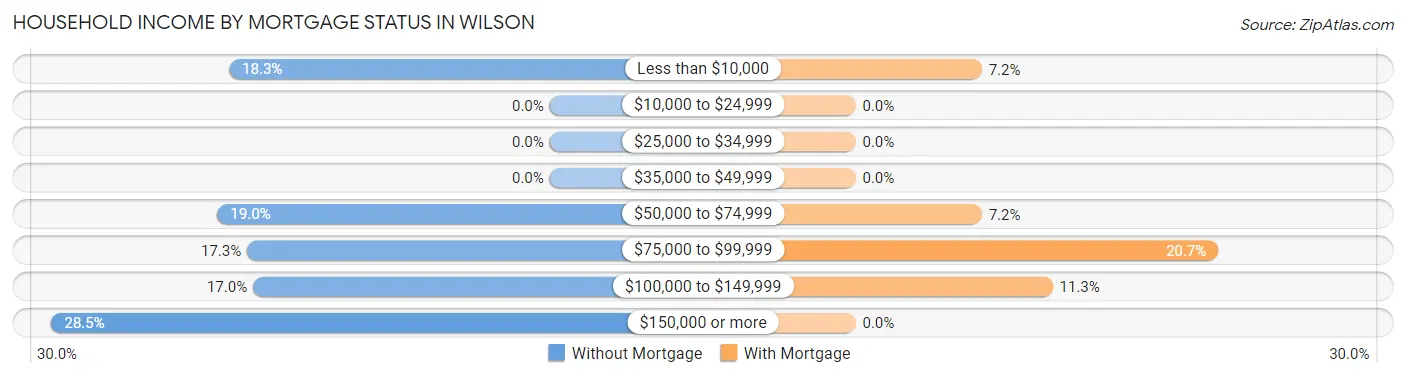
| Household Income | Without Mortgage | With Mortgage |
| Less than $10,000 | 54 (18.3%) | 16 (7.2%) |
| $10,000 to $24,999 | 0 (0.0%) | 0 (0.0%) |
| $25,000 to $34,999 | 0 (0.0%) | 0 (0.0%) |
| $35,000 to $49,999 | 0 (0.0%) | 0 (0.0%) |
| $50,000 to $74,999 | 56 (19.0%) | 16 (7.2%) |
| $75,000 to $99,999 | 51 (17.3%) | 46 (20.7%) |
| $100,000 to $149,999 | 50 (17.0%) | 25 (11.3%) |
| $150,000 or more | 84 (28.5%) | 0 (0.0%) |
| Total | 295 (100.0%) | 222 (100.0%) |
Property Value to Household Income Ratio in Wilson
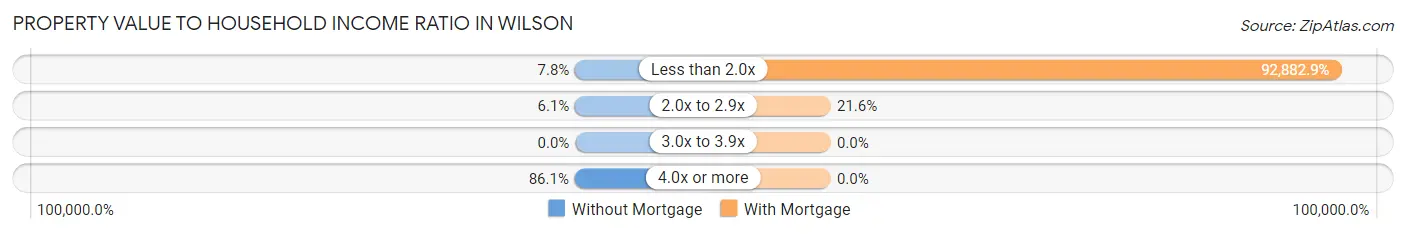
| Value-to-Income Ratio | Without Mortgage | With Mortgage |
| Less than 2.0x | 23 (7.8%) | 206,200 (92,882.9%) |
| 2.0x to 2.9x | 18 (6.1%) | 48 (21.6%) |
| 3.0x to 3.9x | 0 (0.0%) | 0 (0.0%) |
| 4.0x or more | 254 (86.1%) | 0 (0.0%) |
| Total | 295 (100.0%) | 222 (100.0%) |
Real Estate Taxes by Mortgage Status in Wilson
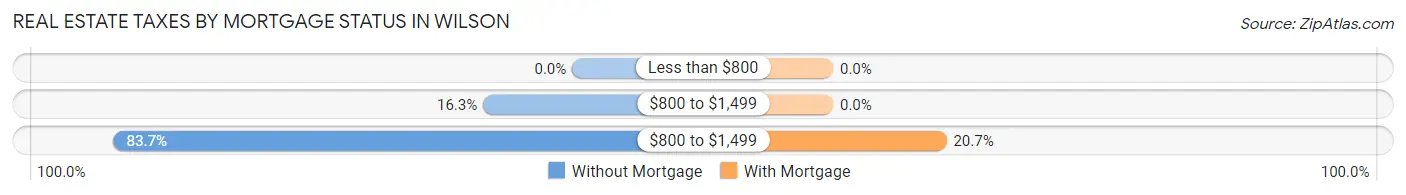
| Property Taxes | Without Mortgage | With Mortgage |
| Less than $800 | 0 (0.0%) | 0 (0.0%) |
| $800 to $1,499 | 48 (16.3%) | 0 (0.0%) |
| $800 to $1,499 | 247 (83.7%) | 46 (20.7%) |
| Total | 295 (100.0%) | 222 (100.0%) |
Health & Disability in Wilson
Health Insurance Coverage by Age in Wilson
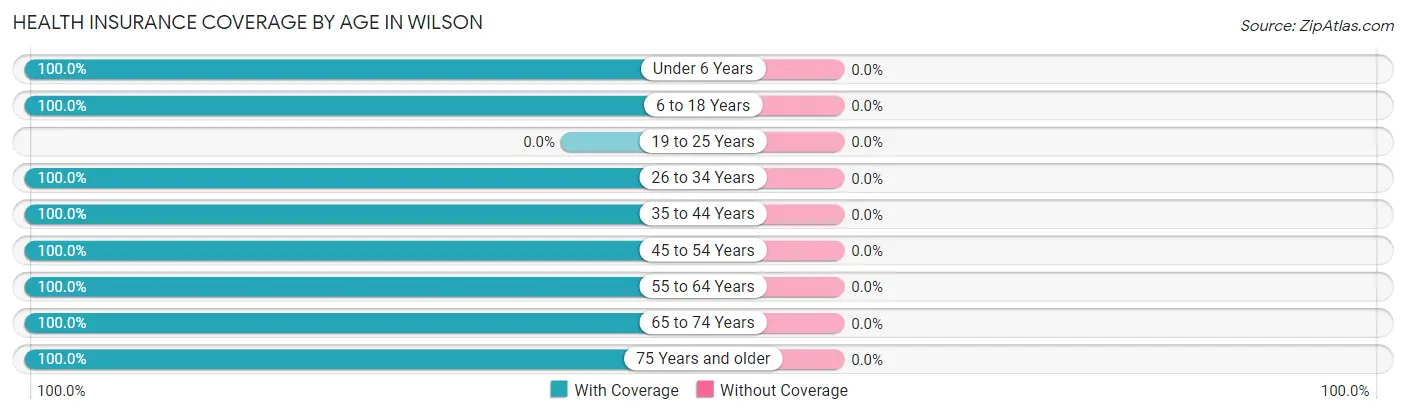
| Age Bracket | With Coverage | Without Coverage |
| Under 6 Years | 70 (100.0%) | 0 (0.0%) |
| 6 to 18 Years | 141 (100.0%) | 0 (0.0%) |
| 19 to 25 Years | 0 (0.0%) | 0 (0.0%) |
| 26 to 34 Years | 66 (100.0%) | 0 (0.0%) |
| 35 to 44 Years | 332 (100.0%) | 0 (0.0%) |
| 45 to 54 Years | 147 (100.0%) | 0 (0.0%) |
| 55 to 64 Years | 275 (100.0%) | 0 (0.0%) |
| 65 to 74 Years | 230 (100.0%) | 0 (0.0%) |
| 75 Years and older | 42 (100.0%) | 0 (0.0%) |
| Total | 1,303 (100.0%) | 0 (0.0%) |
Health Insurance Coverage by Citizenship Status in Wilson
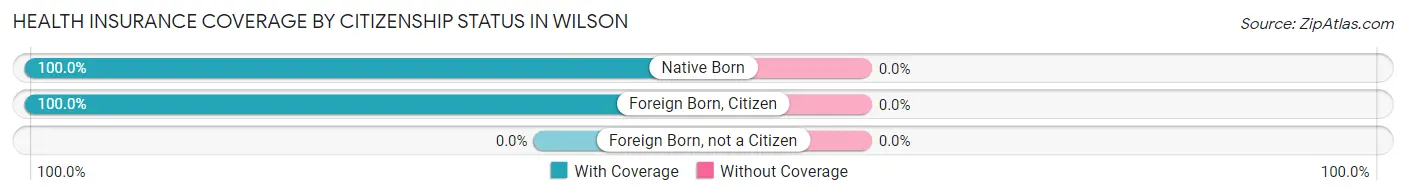
| Citizenship Status | With Coverage | Without Coverage |
| Native Born | 70 (100.0%) | 0 (0.0%) |
| Foreign Born, Citizen | 141 (100.0%) | 0 (0.0%) |
| Foreign Born, not a Citizen | 0 (0.0%) | 0 (0.0%) |
Health Insurance Coverage by Household Income in Wilson
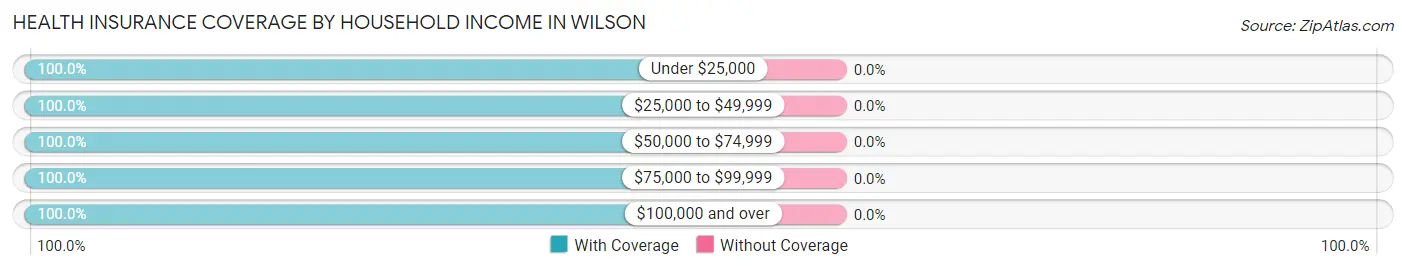
| Household Income | With Coverage | Without Coverage |
| Under $25,000 | 114 (100.0%) | 0 (0.0%) |
| $25,000 to $49,999 | 43 (100.0%) | 0 (0.0%) |
| $50,000 to $74,999 | 293 (100.0%) | 0 (0.0%) |
| $75,000 to $99,999 | 202 (100.0%) | 0 (0.0%) |
| $100,000 and over | 651 (100.0%) | 0 (0.0%) |
Public vs Private Health Insurance Coverage by Age in Wilson
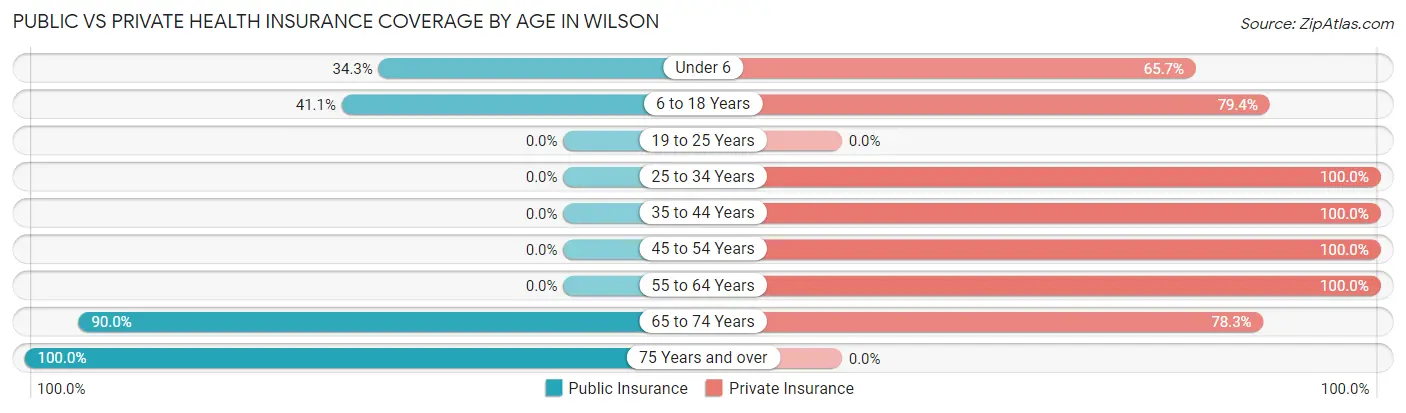
| Age Bracket | Public Insurance | Private Insurance |
| Under 6 | 24 (34.3%) | 46 (65.7%) |
| 6 to 18 Years | 58 (41.1%) | 112 (79.4%) |
| 19 to 25 Years | 0 (0.0%) | 0 (0.0%) |
| 25 to 34 Years | 0 (0.0%) | 66 (100.0%) |
| 35 to 44 Years | 0 (0.0%) | 332 (100.0%) |
| 45 to 54 Years | 0 (0.0%) | 147 (100.0%) |
| 55 to 64 Years | 0 (0.0%) | 275 (100.0%) |
| 65 to 74 Years | 207 (90.0%) | 180 (78.3%) |
| 75 Years and over | 42 (100.0%) | 0 (0.0%) |
| Total | 331 (25.4%) | 1,158 (88.9%) |
Disability Status by Sex by Age in Wilson
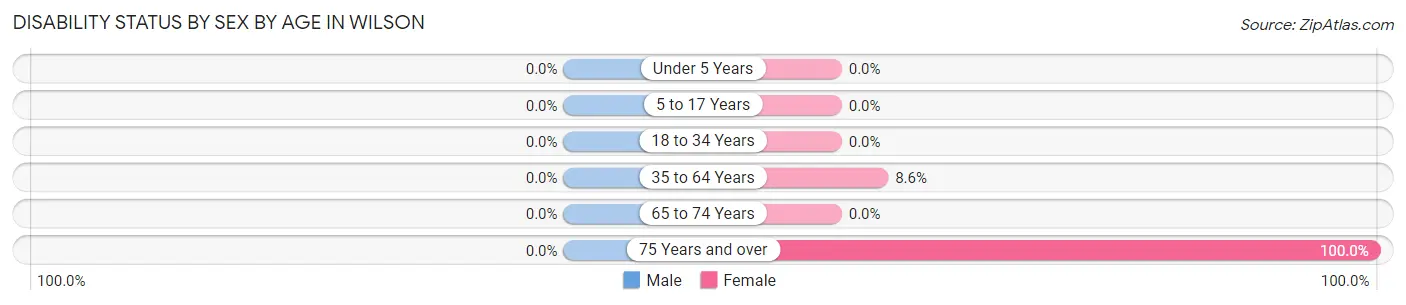
| Age Bracket | Male | Female |
| Under 5 Years | 0 (0.0%) | 0 (0.0%) |
| 5 to 17 Years | 0 (0.0%) | 0 (0.0%) |
| 18 to 34 Years | 0 (0.0%) | 0 (0.0%) |
| 35 to 64 Years | 0 (0.0%) | 30 (8.6%) |
| 65 to 74 Years | 0 (0.0%) | 0 (0.0%) |
| 75 Years and over | 0 (0.0%) | 14 (100.0%) |
Disability Class by Sex by Age in Wilson
Disability Class: Hearing Difficulty
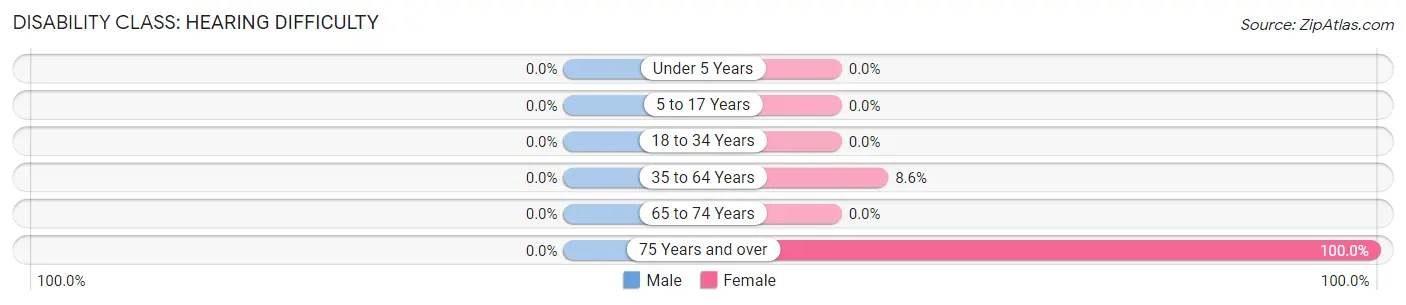
| Age Bracket | Male | Female |
| Under 5 Years | 0 (0.0%) | 0 (0.0%) |
| 5 to 17 Years | 0 (0.0%) | 0 (0.0%) |
| 18 to 34 Years | 0 (0.0%) | 0 (0.0%) |
| 35 to 64 Years | 0 (0.0%) | 30 (8.6%) |
| 65 to 74 Years | 0 (0.0%) | 0 (0.0%) |
| 75 Years and over | 0 (0.0%) | 14 (100.0%) |
Disability Class: Vision Difficulty
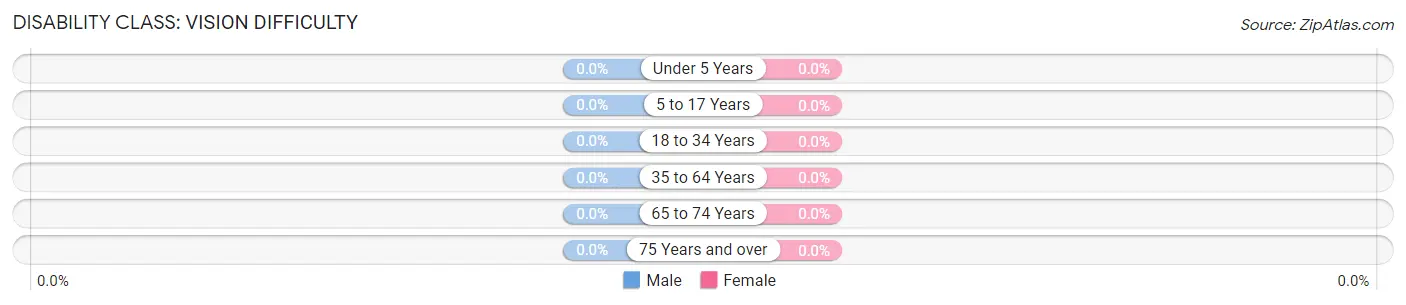
| Age Bracket | Male | Female |
| Under 5 Years | 0 (0.0%) | 0 (0.0%) |
| 5 to 17 Years | 0 (0.0%) | 0 (0.0%) |
| 18 to 34 Years | 0 (0.0%) | 0 (0.0%) |
| 35 to 64 Years | 0 (0.0%) | 0 (0.0%) |
| 65 to 74 Years | 0 (0.0%) | 0 (0.0%) |
| 75 Years and over | 0 (0.0%) | 0 (0.0%) |
Disability Class: Cognitive Difficulty
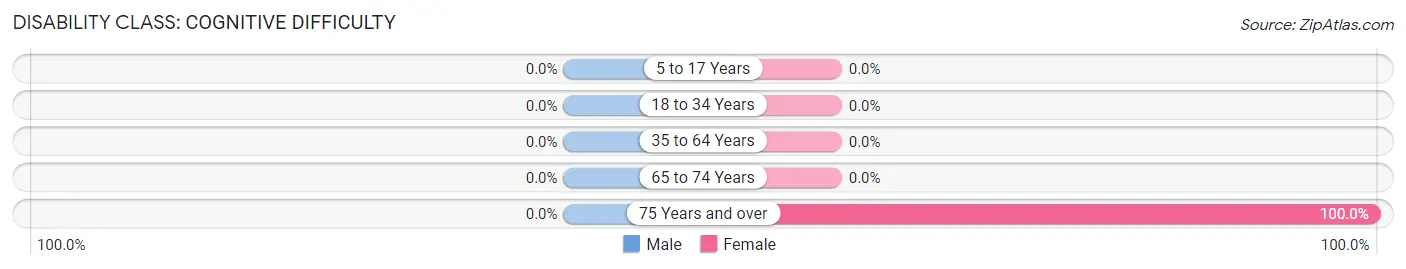
| Age Bracket | Male | Female |
| 5 to 17 Years | 0 (0.0%) | 0 (0.0%) |
| 18 to 34 Years | 0 (0.0%) | 0 (0.0%) |
| 35 to 64 Years | 0 (0.0%) | 0 (0.0%) |
| 65 to 74 Years | 0 (0.0%) | 0 (0.0%) |
| 75 Years and over | 0 (0.0%) | 14 (100.0%) |
Disability Class: Ambulatory Difficulty
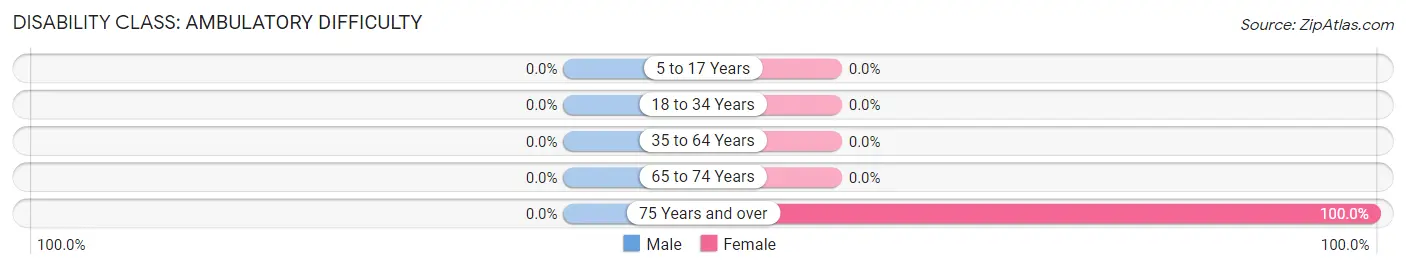
| Age Bracket | Male | Female |
| 5 to 17 Years | 0 (0.0%) | 0 (0.0%) |
| 18 to 34 Years | 0 (0.0%) | 0 (0.0%) |
| 35 to 64 Years | 0 (0.0%) | 0 (0.0%) |
| 65 to 74 Years | 0 (0.0%) | 0 (0.0%) |
| 75 Years and over | 0 (0.0%) | 14 (100.0%) |
Disability Class: Self-Care Difficulty
| Age Bracket | Male | Female |
| 5 to 17 Years | 0 (0.0%) | 0 (0.0%) |
| 18 to 34 Years | 0 (0.0%) | 0 (0.0%) |
| 35 to 64 Years | 0 (0.0%) | 0 (0.0%) |
| 65 to 74 Years | 0 (0.0%) | 0 (0.0%) |
| 75 Years and over | 0 (0.0%) | 0 (0.0%) |
Technology Access in Wilson
Computing Device Access in Wilson
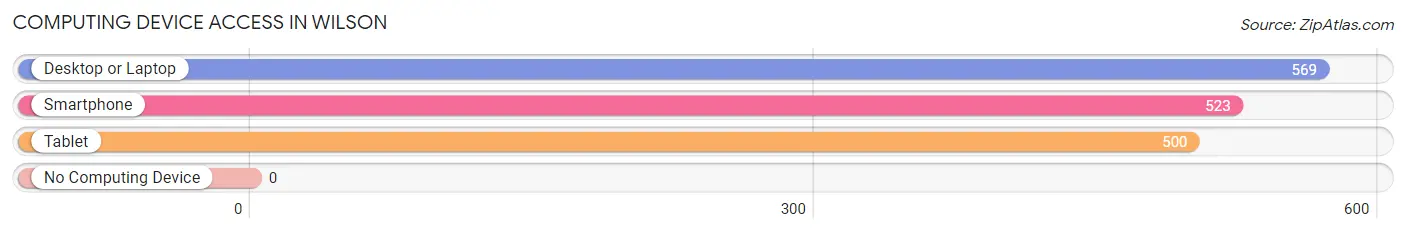
| Device Type | # Households | % Households |
| Desktop or Laptop | 569 | 97.8% |
| Smartphone | 523 | 89.9% |
| Tablet | 500 | 85.9% |
| No Computing Device | 0 | 0.0% |
| Total | 582 | 100.0% |
Internet Access in Wilson
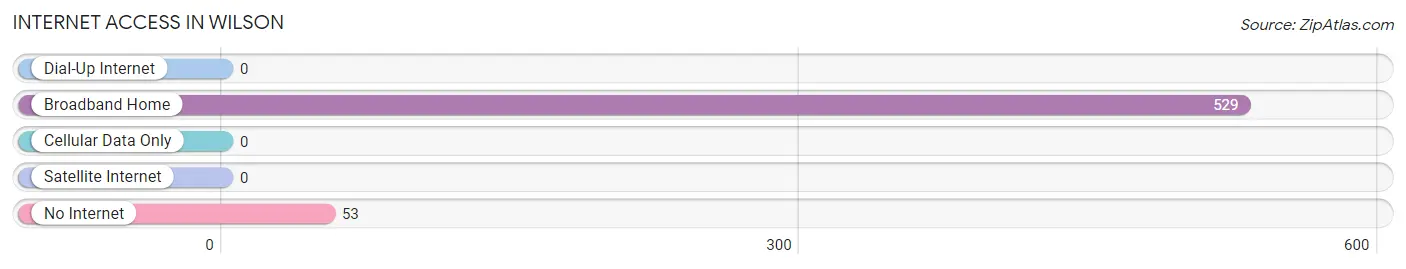
| Internet Type | # Households | % Households |
| Dial-Up Internet | 0 | 0.0% |
| Broadband Home | 529 | 90.9% |
| Cellular Data Only | 0 | 0.0% |
| Satellite Internet | 0 | 0.0% |
| No Internet | 53 | 9.1% |
| Total | 582 | 100.0% |
Wilson Summary
Wilson, Wyoming is a small town located in the Jackson Hole Valley of Teton County, Wyoming. It is situated at the base of the Teton Range, just south of the town of Jackson. The town was founded in the late 1800s by homesteaders and has since grown to become a popular tourist destination.
History
Wilson was first settled in the late 1800s by homesteaders who were drawn to the area by its natural beauty and abundant resources. The town was named after John Wilson, a local rancher who owned a large portion of the land in the area. In the early 1900s, the town began to grow as more people moved to the area to take advantage of the abundant resources. The town was incorporated in 1909 and soon became a popular tourist destination.
In the 1920s, the town began to attract more visitors as the Jackson Hole ski area was developed. The area quickly became a popular destination for skiers and other outdoor enthusiasts. In the 1950s, the town began to experience a population boom as more people moved to the area to take advantage of the growing tourism industry.
Geography
Wilson is located in the Jackson Hole Valley of Teton County, Wyoming. It is situated at the base of the Teton Range, just south of the town of Jackson. The town is surrounded by the Bridger-Teton National Forest and is close to the Grand Teton National Park. The town is located at an elevation of 6,400 feet and has a total area of 1.2 square miles.
Economy
The economy of Wilson is largely based on tourism. The town is a popular destination for outdoor enthusiasts, and the local economy is heavily reliant on the tourism industry. The town is home to several ski resorts, including Jackson Hole Mountain Resort, which is one of the most popular ski resorts in the United States. The town also has a number of restaurants, bars, and shops that cater to tourists.
Demographics
As of the 2010 census, the population of Wilson was 1,845. The racial makeup of the town was 95.3% White, 0.3% African American, 0.3% Native American, 0.7% Asian, 0.1% Pacific Islander, 1.2% from other races, and 2.3% from two or more races. The median household income in Wilson was $63,750, and the median family income was $77,500.
Conclusion
Wilson, Wyoming is a small town located in the Jackson Hole Valley of Teton County, Wyoming. It is situated at the base of the Teton Range, just south of the town of Jackson. The town was founded in the late 1800s by homesteaders and has since grown to become a popular tourist destination. The economy of Wilson is largely based on tourism, and the town is home to several ski resorts and other attractions. As of the 2010 census, the population of Wilson was 1,845, and the median household income was $63,750.
Common Questions
What is Per Capita Income in Wilson?
Per Capita income in Wilson is $96,141.
What is the Median Household income in Wilson?
Median Household Income in Wilson is $128,981.
What is Income or Wage Gap in Wilson?
Income or Wage Gap in Wilson is 40.5%.
Women in Wilson earn 59.5 cents for every dollar earned by a man.
What is Inequality or Gini Index in Wilson?
Inequality or Gini Index in Wilson is 0.53.
What is the Total Population of Wilson?
Total Population of Wilson is 1,303.
What is the Total Male Population of Wilson?
Total Male Population of Wilson is 721.
What is the Total Female Population of Wilson?
Total Female Population of Wilson is 582.
What is the Ratio of Males per 100 Females in Wilson?
There are 123.88 Males per 100 Females in Wilson.
What is the Ratio of Females per 100 Males in Wilson?
There are 80.72 Females per 100 Males in Wilson.
What is the Median Population Age in Wilson?
Median Population Age in Wilson is 47.0 Years.
What is the Average Family Size in Wilson
Average Family Size in Wilson is 2.4 People.
What is the Average Household Size in Wilson
Average Household Size in Wilson is 2.2 People.
How Large is the Labor Force in Wilson?
There are 753 People in the Labor Forcein in Wilson.
What is the Percentage of People in the Labor Force in Wilson?
65.9% of People are in the Labor Force in Wilson.