Thayne, WY Map & Demographics
Thayne Map
Thayne Overview
$37,207
PER CAPITA INCOME
$74,821
AVG FAMILY INCOME
$73,036
AVG HOUSEHOLD INCOME
0.35
INEQUALITY / GINI INDEX
656
TOTAL POPULATION
332
MALE POPULATION
324
FEMALE POPULATION
102.47
MALES / 100 FEMALES
97.59
FEMALES / 100 MALES
47.0
MEDIAN AGE
2.7
AVG FAMILY SIZE
2.5
AVG HOUSEHOLD SIZE
302
LABOR FORCE [ PEOPLE ]
61.0%
PERCENT IN LABOR FORCE
Thayne Zip Codes
Thayne Area Codes
Income in Thayne
Income Overview in Thayne
Per Capita Income in Thayne is $37,207, while median incomes of families and households are $74,821 and $73,036 respectively.
| Characteristic | Number | Measure |
| Per Capita Income | 656 | $37,207 |
| Median Family Income | 211 | $74,821 |
| Mean Family Income | 211 | $106,204 |
| Median Household Income | 263 | $73,036 |
| Mean Household Income | 263 | $95,302 |
| Income Deficit | 211 | $0 |
| Wage / Income Gap (%) | 656 | 0.00% |
| Wage / Income Gap ($) | 656 | 100.00¢ per $1 |
| Gini / Inequality Index | 656 | 0.35 |
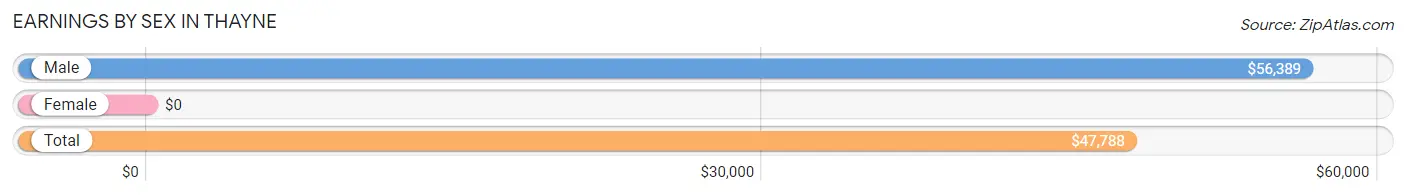
Earnings by Sex in Thayne
| Sex | Number | Average Earnings |
| Male | 188 (58.6%) | $56,389 |
| Female | 133 (41.4%) | $0 |
| Total | 321 (100.0%) | $47,788 |
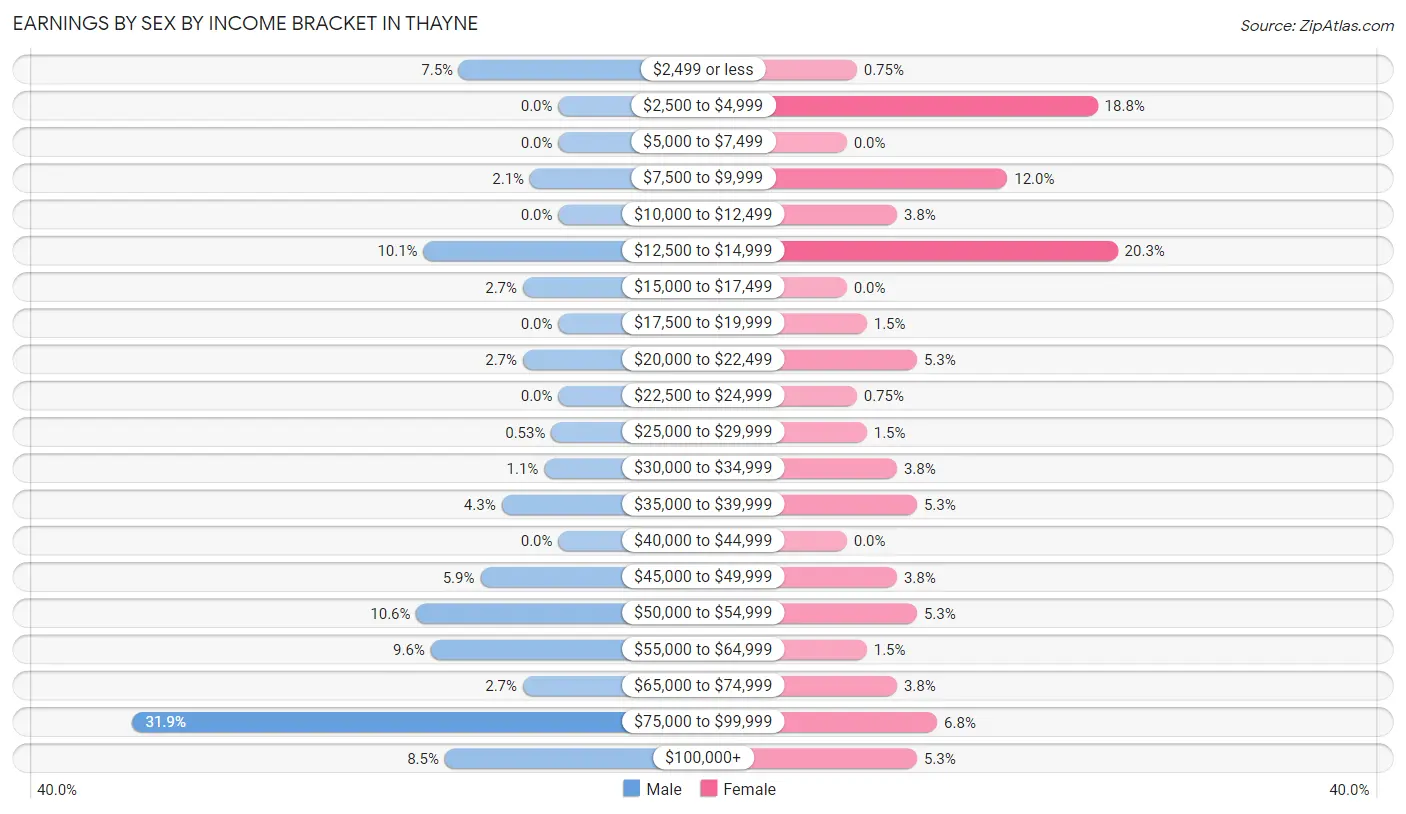
Earnings by Sex by Income Bracket in Thayne
The most common earnings brackets in Thayne are $75,000 to $99,999 for men (60 | 31.9%) and $12,500 to $14,999 for women (27 | 20.3%).
| Income | Male | Female |
| $2,499 or less | 14 (7.4%) | 1 (0.7%) |
| $2,500 to $4,999 | 0 (0.0%) | 25 (18.8%) |
| $5,000 to $7,499 | 0 (0.0%) | 0 (0.0%) |
| $7,500 to $9,999 | 4 (2.1%) | 16 (12.0%) |
| $10,000 to $12,499 | 0 (0.0%) | 5 (3.8%) |
| $12,500 to $14,999 | 19 (10.1%) | 27 (20.3%) |
| $15,000 to $17,499 | 5 (2.7%) | 0 (0.0%) |
| $17,500 to $19,999 | 0 (0.0%) | 2 (1.5%) |
| $20,000 to $22,499 | 5 (2.7%) | 7 (5.3%) |
| $22,500 to $24,999 | 0 (0.0%) | 1 (0.7%) |
| $25,000 to $29,999 | 1 (0.5%) | 2 (1.5%) |
| $30,000 to $34,999 | 2 (1.1%) | 5 (3.8%) |
| $35,000 to $39,999 | 8 (4.3%) | 7 (5.3%) |
| $40,000 to $44,999 | 0 (0.0%) | 0 (0.0%) |
| $45,000 to $49,999 | 11 (5.9%) | 5 (3.8%) |
| $50,000 to $54,999 | 20 (10.6%) | 7 (5.3%) |
| $55,000 to $64,999 | 18 (9.6%) | 2 (1.5%) |
| $65,000 to $74,999 | 5 (2.7%) | 5 (3.8%) |
| $75,000 to $99,999 | 60 (31.9%) | 9 (6.8%) |
| $100,000+ | 16 (8.5%) | 7 (5.3%) |
| Total | 188 (100.0%) | 133 (100.0%) |
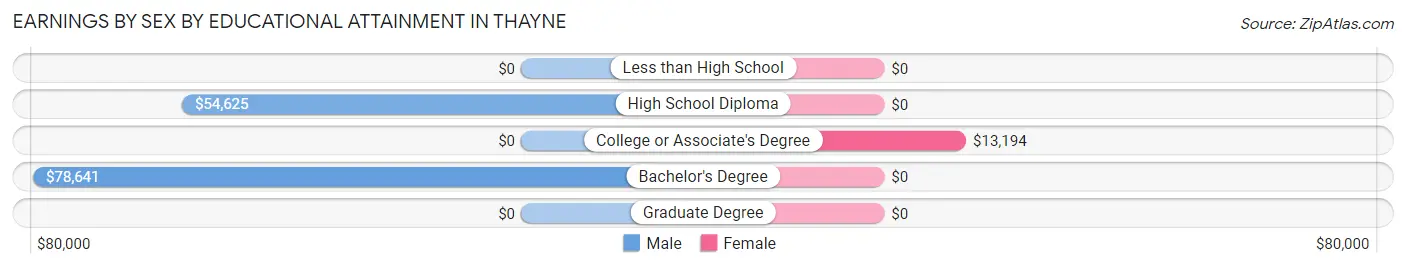
Earnings by Sex by Educational Attainment in Thayne
| Educational Attainment | Male Income | Female Income |
| Less than High School | - | - |
| High School Diploma | $54,625 | $0 |
| College or Associate's Degree | - | - |
| Bachelor's Degree | $78,641 | $0 |
| Graduate Degree | - | - |
| Total | $56,944 | $0 |
Family Income in Thayne
Family Income Brackets in Thayne
According to the Thayne family income data, there are 68 families falling into the $150,000 to $199,999 income range, which is the most common income bracket and makes up 32.2% of all families.
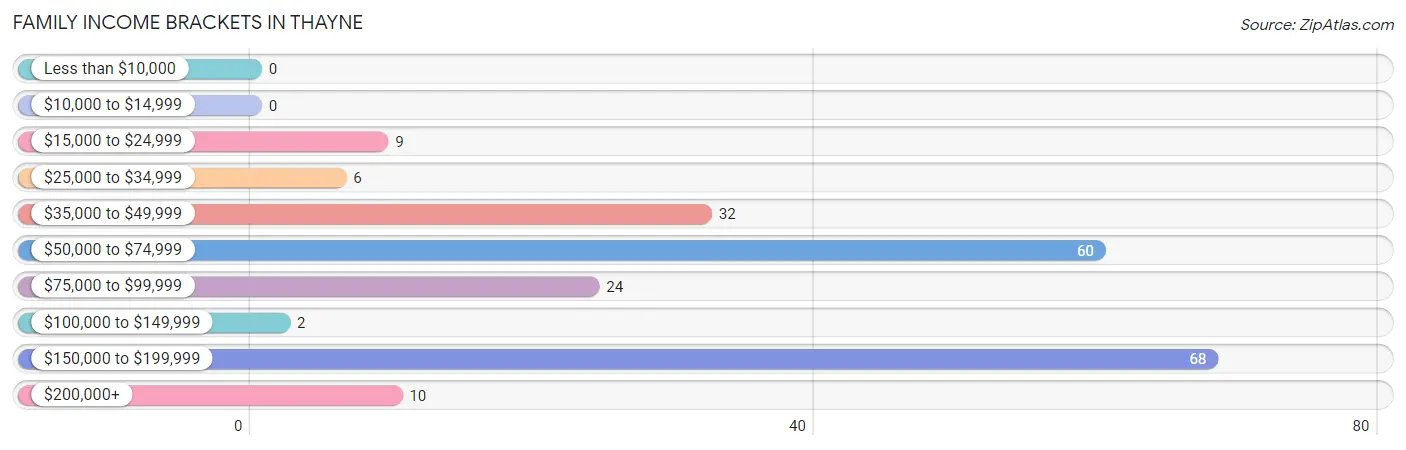
| Income Bracket | # Families | % Families |
| Less than $10,000 | 0 | 0.0% |
| $10,000 to $14,999 | 0 | 0.0% |
| $15,000 to $24,999 | 9 | 4.3% |
| $25,000 to $34,999 | 6 | 2.8% |
| $35,000 to $49,999 | 32 | 15.2% |
| $50,000 to $74,999 | 60 | 28.4% |
| $75,000 to $99,999 | 24 | 11.4% |
| $100,000 to $149,999 | 2 | 0.9% |
| $150,000 to $199,999 | 68 | 32.2% |
| $200,000+ | 10 | 4.7% |
Family Income by Famaliy Size in Thayne
4-person families (14 | 6.6%) account for the highest median family income in Thayne with $185,556 per family, while 4-person families (14 | 6.6%) have the highest median income of $46,389 per family member.
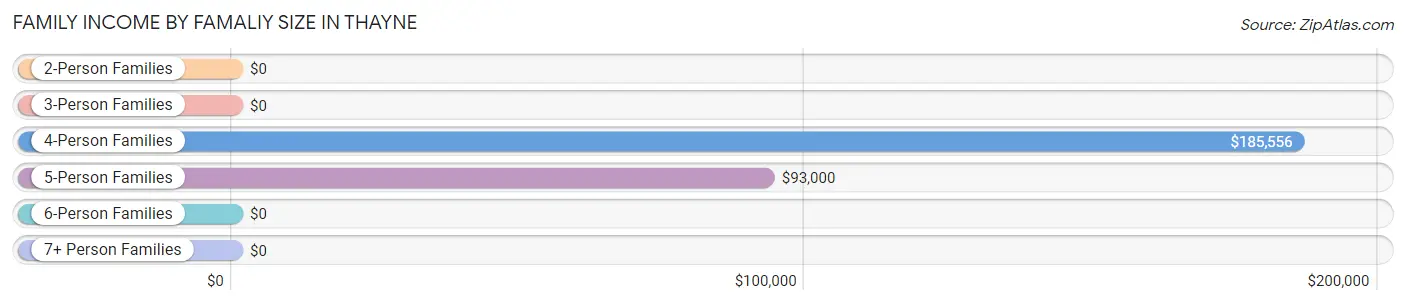
| Income Bracket | # Families | Median Income |
| 2-Person Families | 112 (53.1%) | $0 |
| 3-Person Families | 50 (23.7%) | $0 |
| 4-Person Families | 14 (6.6%) | $185,556 |
| 5-Person Families | 12 (5.7%) | $93,000 |
| 6-Person Families | 6 (2.8%) | $0 |
| 7+ Person Families | 17 (8.1%) | $0 |
| Total | 211 (100.0%) | $74,821 |
Family Income by Number of Earners in Thayne
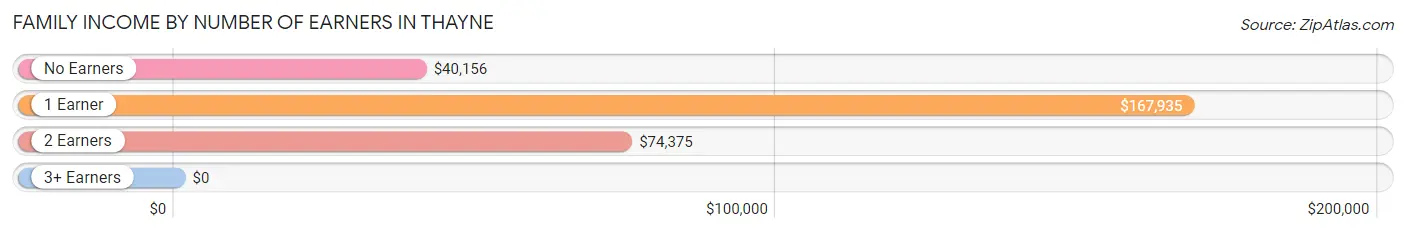
| Number of Earners | # Families | Median Income |
| No Earners | 21 (10.0%) | $40,156 |
| 1 Earner | 94 (44.6%) | $167,935 |
| 2 Earners | 84 (39.8%) | $74,375 |
| 3+ Earners | 12 (5.7%) | $0 |
| Total | 211 (100.0%) | $74,821 |
Household Income in Thayne
Household Income Brackets in Thayne
With 71 households falling in the category, the $50,000 to $74,999 income range is the most frequent in Thayne, accounting for 27.0% of all households.
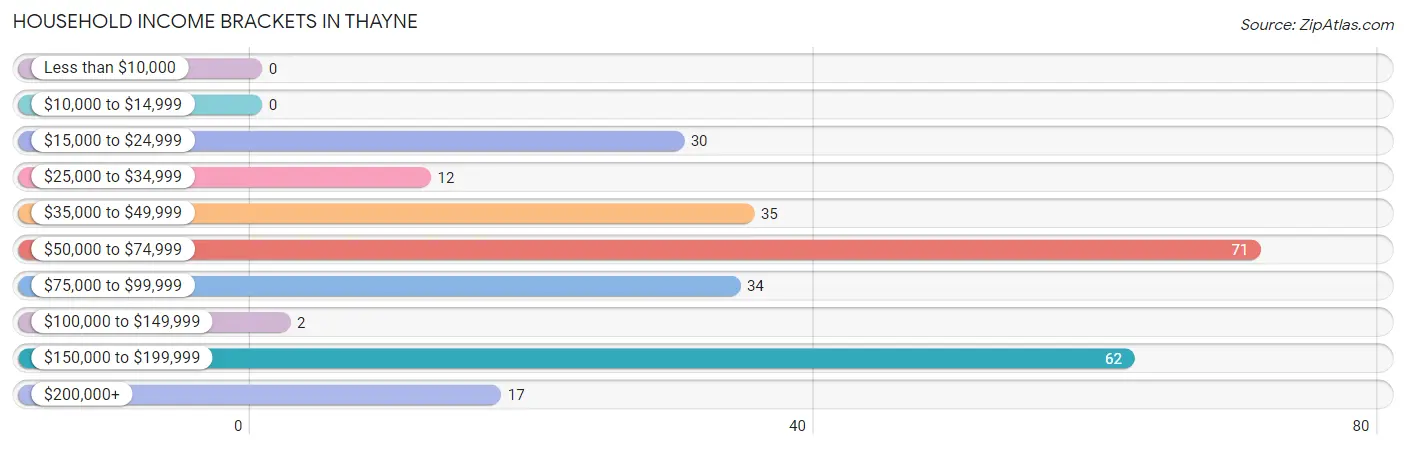
| Income Bracket | # Households | % Households |
| Less than $10,000 | 0 | 0.0% |
| $10,000 to $14,999 | 0 | 0.0% |
| $15,000 to $24,999 | 30 | 11.4% |
| $25,000 to $34,999 | 12 | 4.6% |
| $35,000 to $49,999 | 35 | 13.3% |
| $50,000 to $74,999 | 71 | 27.0% |
| $75,000 to $99,999 | 34 | 12.9% |
| $100,000 to $149,999 | 2 | 0.8% |
| $150,000 to $199,999 | 62 | 23.6% |
| $200,000+ | 17 | 6.5% |
Household Income by Householder Age in Thayne
The median household income in Thayne is $73,036, with the highest median household income of $74,524 found in the 25 to 44 years age bracket for the primary householder. A total of 56 households (21.3%) fall into this category. Meanwhile, the 15 to 24 years age bracket for the primary householder has the lowest median household income of $0, with 5 households (1.9%) in this group.
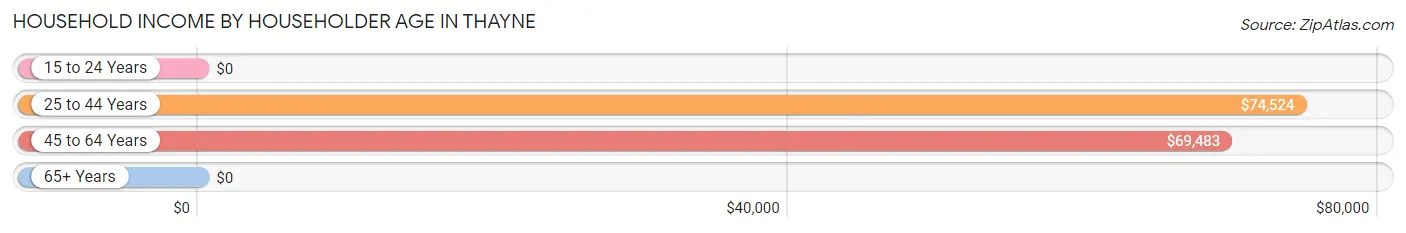
| Income Bracket | # Households | Median Income |
| 15 to 24 Years | 5 (1.9%) | $0 |
| 25 to 44 Years | 56 (21.3%) | $74,524 |
| 45 to 64 Years | 86 (32.7%) | $69,483 |
| 65+ Years | 116 (44.1%) | $0 |
| Total | 263 (100.0%) | $73,036 |
Poverty in Thayne
Income Below Poverty by Sex and Age in Thayne
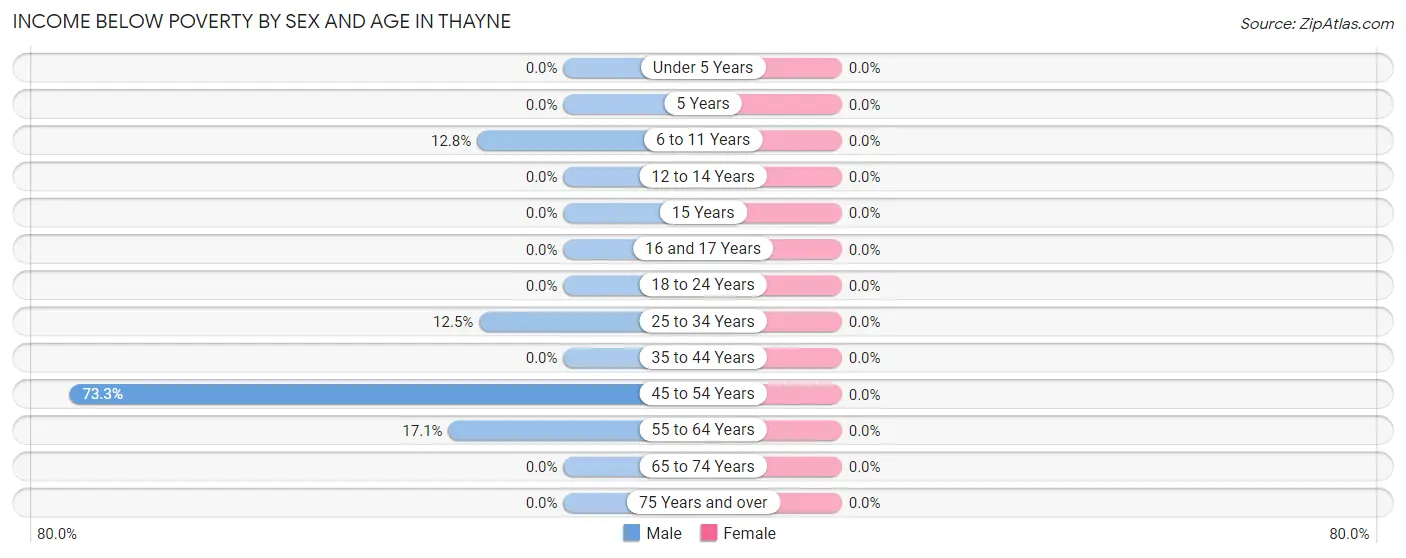
| Age Bracket | Male | Female |
| Under 5 Years | 0 (0.0%) | 0 (0.0%) |
| 5 Years | 0 (0.0%) | 0 (0.0%) |
| 6 to 11 Years | 5 (12.8%) | 0 (0.0%) |
| 12 to 14 Years | 0 (0.0%) | 0 (0.0%) |
| 15 Years | 0 (0.0%) | 0 (0.0%) |
| 16 and 17 Years | 0 (0.0%) | 0 (0.0%) |
| 18 to 24 Years | 0 (0.0%) | 0 (0.0%) |
| 25 to 34 Years | 6 (12.5%) | 0 (0.0%) |
| 35 to 44 Years | 0 (0.0%) | 0 (0.0%) |
| 45 to 54 Years | 11 (73.3%) | 0 (0.0%) |
| 55 to 64 Years | 7 (17.1%) | 0 (0.0%) |
| 65 to 74 Years | 0 (0.0%) | 0 (0.0%) |
| 75 Years and over | 0 (0.0%) | 0 (0.0%) |
| Total | 29 (8.7%) | 0 (0.0%) |
Income Above Poverty by Sex and Age in Thayne
According to the poverty statistics in Thayne, males aged under 5 years and females aged under 5 years are the age groups that are most secure financially, with 100.0% of males and 100.0% of females in these age groups living above the poverty line.
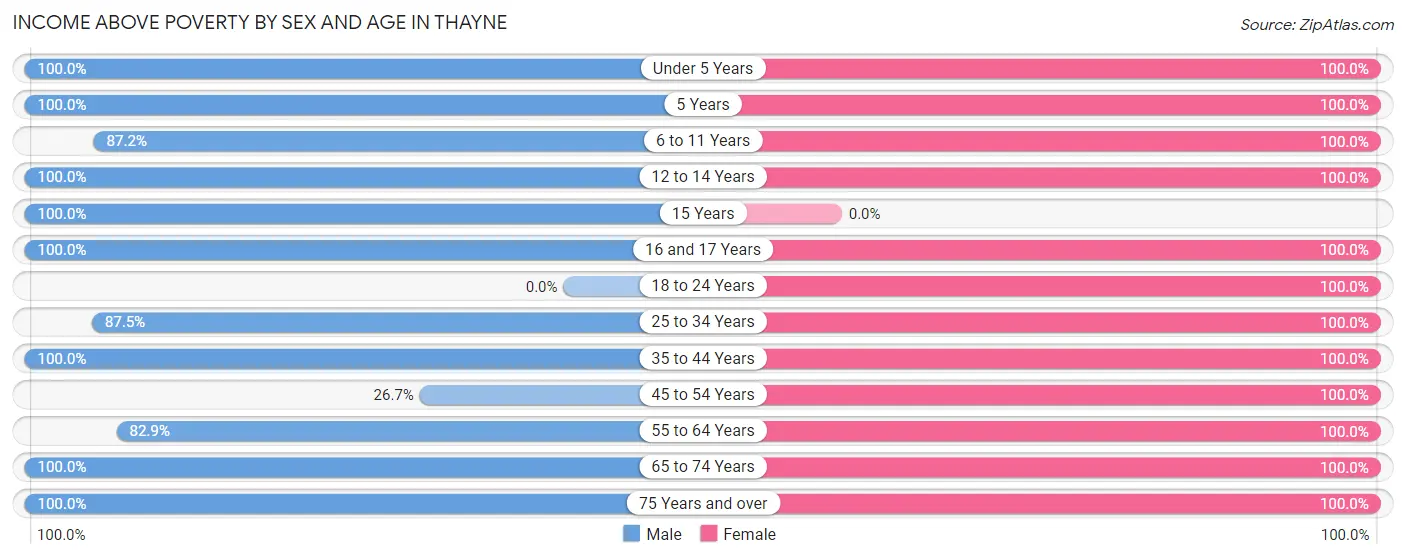
| Age Bracket | Male | Female |
| Under 5 Years | 32 (100.0%) | 18 (100.0%) |
| 5 Years | 17 (100.0%) | 1 (100.0%) |
| 6 to 11 Years | 34 (87.2%) | 32 (100.0%) |
| 12 to 14 Years | 2 (100.0%) | 15 (100.0%) |
| 15 Years | 5 (100.0%) | 0 (0.0%) |
| 16 and 17 Years | 4 (100.0%) | 14 (100.0%) |
| 18 to 24 Years | 0 (0.0%) | 5 (100.0%) |
| 25 to 34 Years | 42 (87.5%) | 32 (100.0%) |
| 35 to 44 Years | 23 (100.0%) | 20 (100.0%) |
| 45 to 54 Years | 4 (26.7%) | 38 (100.0%) |
| 55 to 64 Years | 34 (82.9%) | 62 (100.0%) |
| 65 to 74 Years | 94 (100.0%) | 66 (100.0%) |
| 75 Years and over | 12 (100.0%) | 21 (100.0%) |
| Total | 303 (91.3%) | 324 (100.0%) |
Income Below Poverty Among Married-Couple Families in Thayne
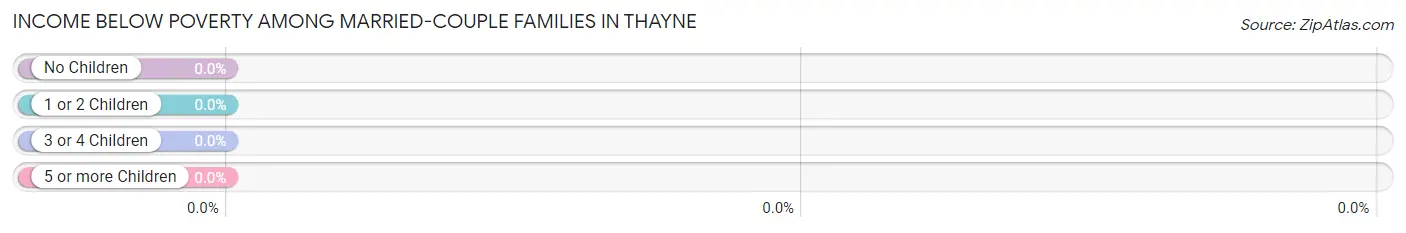
| Children | Above Poverty | Below Poverty |
| No Children | 100 (100.0%) | 0 (0.0%) |
| 1 or 2 Children | 38 (100.0%) | 0 (0.0%) |
| 3 or 4 Children | 18 (100.0%) | 0 (0.0%) |
| 5 or more Children | 17 (100.0%) | 0 (0.0%) |
| Total | 173 (100.0%) | 0 (0.0%) |
Income Below Poverty Among Single-Parent Households in Thayne
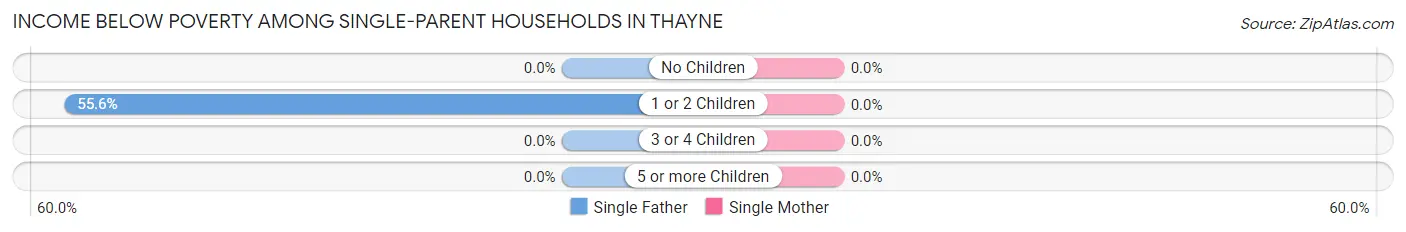
| Children | Single Father | Single Mother |
| No Children | 0 (0.0%) | 0 (0.0%) |
| 1 or 2 Children | 5 (55.6%) | 0 (0.0%) |
| 3 or 4 Children | 0 (0.0%) | 0 (0.0%) |
| 5 or more Children | 0 (0.0%) | 0 (0.0%) |
| Total | 5 (41.7%) | 0 (0.0%) |
Income Below Poverty Among Married-Couple vs Single-Parent Households in Thayne
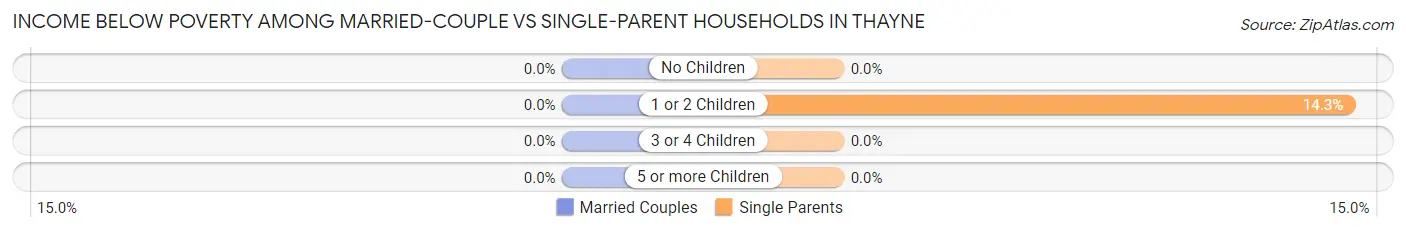
| Children | Married-Couple Families | Single-Parent Households |
| No Children | 0 (0.0%) | 0 (0.0%) |
| 1 or 2 Children | 0 (0.0%) | 5 (14.3%) |
| 3 or 4 Children | 0 (0.0%) | 0 (0.0%) |
| 5 or more Children | 0 (0.0%) | 0 (0.0%) |
| Total | 0 (0.0%) | 5 (13.2%) |
Race in Thayne
The most populous races in Thayne are White / Caucasian (612 | 93.3%), Two or more Races (44 | 6.7%), and Hispanic or Latino (40 | 6.1%).
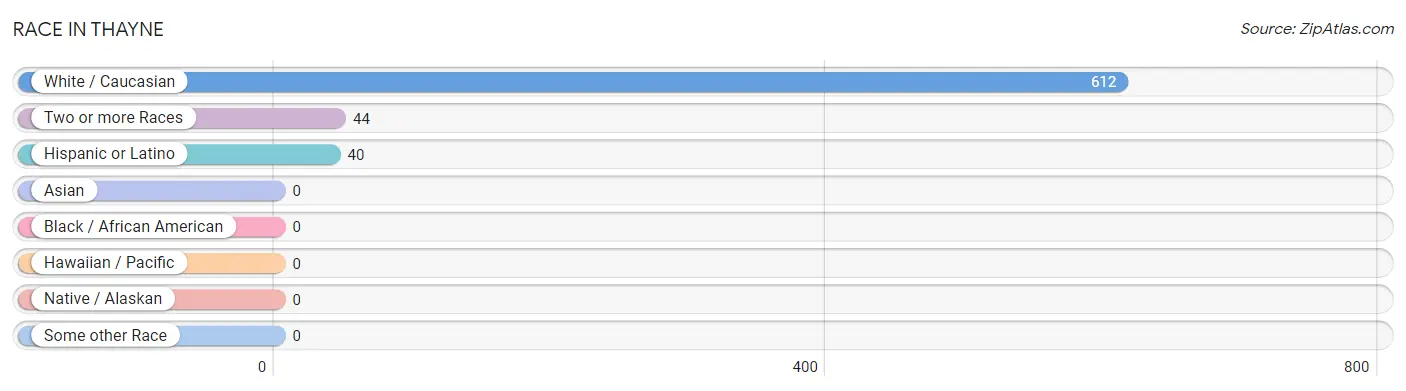
| Race | # Population | % Population |
| Asian | 0 | 0.0% |
| Black / African American | 0 | 0.0% |
| Hawaiian / Pacific | 0 | 0.0% |
| Hispanic or Latino | 40 | 6.1% |
| Native / Alaskan | 0 | 0.0% |
| White / Caucasian | 612 | 93.3% |
| Two or more Races | 44 | 6.7% |
| Some other Race | 0 | 0.0% |
| Total | 656 | 100.0% |
Ancestry in Thayne
The most populous ancestries reported in Thayne are English (245 | 37.3%), German (145 | 22.1%), Irish (100 | 15.2%), Scottish (58 | 8.8%), and Mexican (40 | 6.1%), together accounting for 89.6% of all Thayne residents.
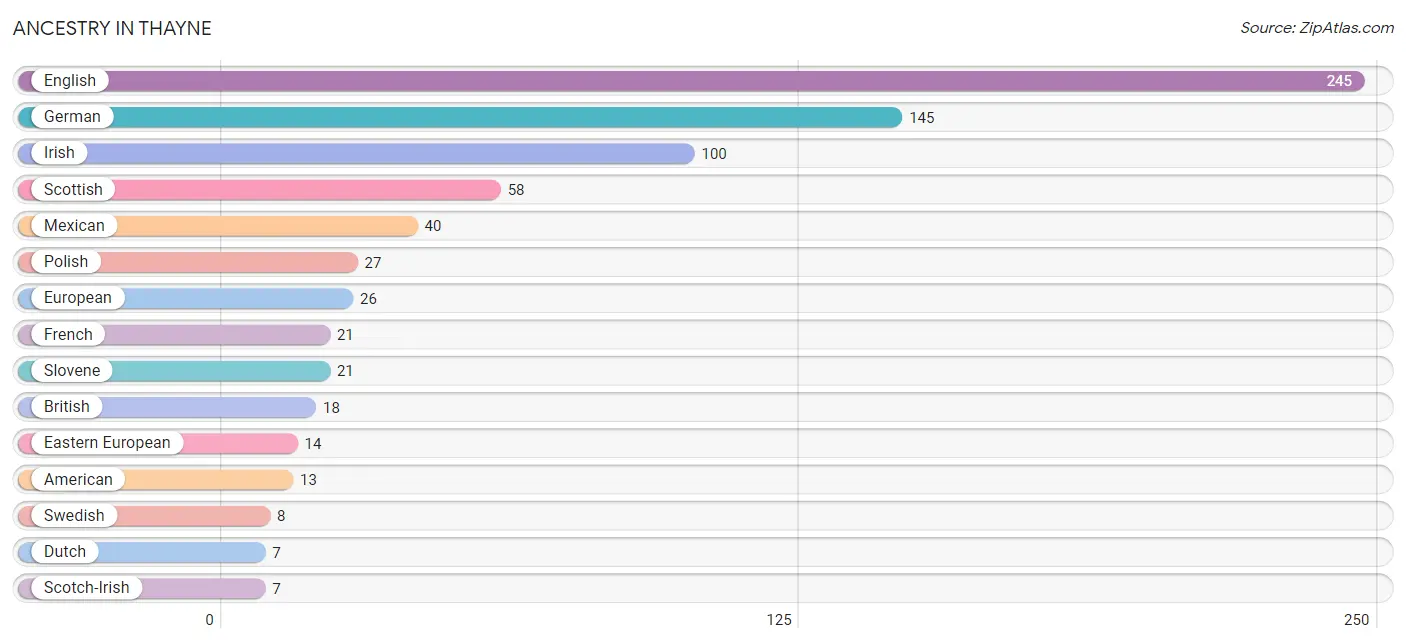
| Ancestry | # Population | % Population |
| American | 13 | 2.0% |
| Arapaho | 1 | 0.2% |
| British | 18 | 2.7% |
| Cherokee | 4 | 0.6% |
| Dutch | 7 | 1.1% |
| Eastern European | 14 | 2.1% |
| English | 245 | 37.3% |
| European | 26 | 4.0% |
| French | 21 | 3.2% |
| German | 145 | 22.1% |
| Irish | 100 | 15.2% |
| Mexican | 40 | 6.1% |
| Norwegian | 2 | 0.3% |
| Polish | 27 | 4.1% |
| Samoan | 6 | 0.9% |
| Scotch-Irish | 7 | 1.1% |
| Scottish | 58 | 8.8% |
| Slovene | 21 | 3.2% |
| Swedish | 8 | 1.2% |
| Swiss | 1 | 0.2% | View All 20 Rows |
Immigrants in Thayne
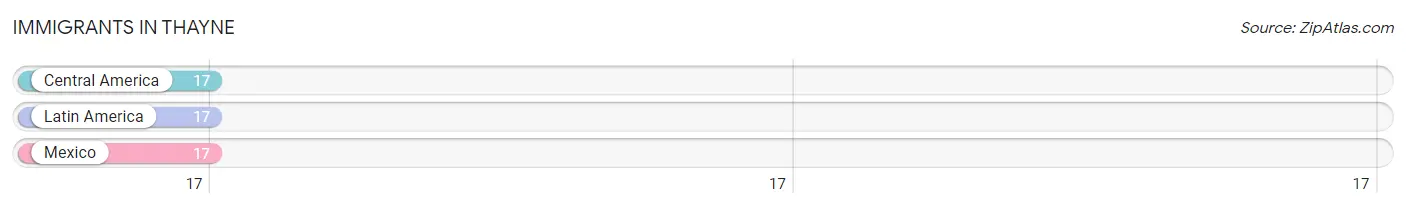
The most numerous immigrant groups reported in Thayne came from Central America (17 | 2.6%), Latin America (17 | 2.6%), and Mexico (17 | 2.6%), together accounting for 7.8% of all Thayne residents.
| Immigration Origin | # Population | % Population |
| Central America | 17 | 2.6% |
| Latin America | 17 | 2.6% |
| Mexico | 17 | 2.6% | View All 3 Rows |
Sex and Age in Thayne
Sex and Age in Thayne
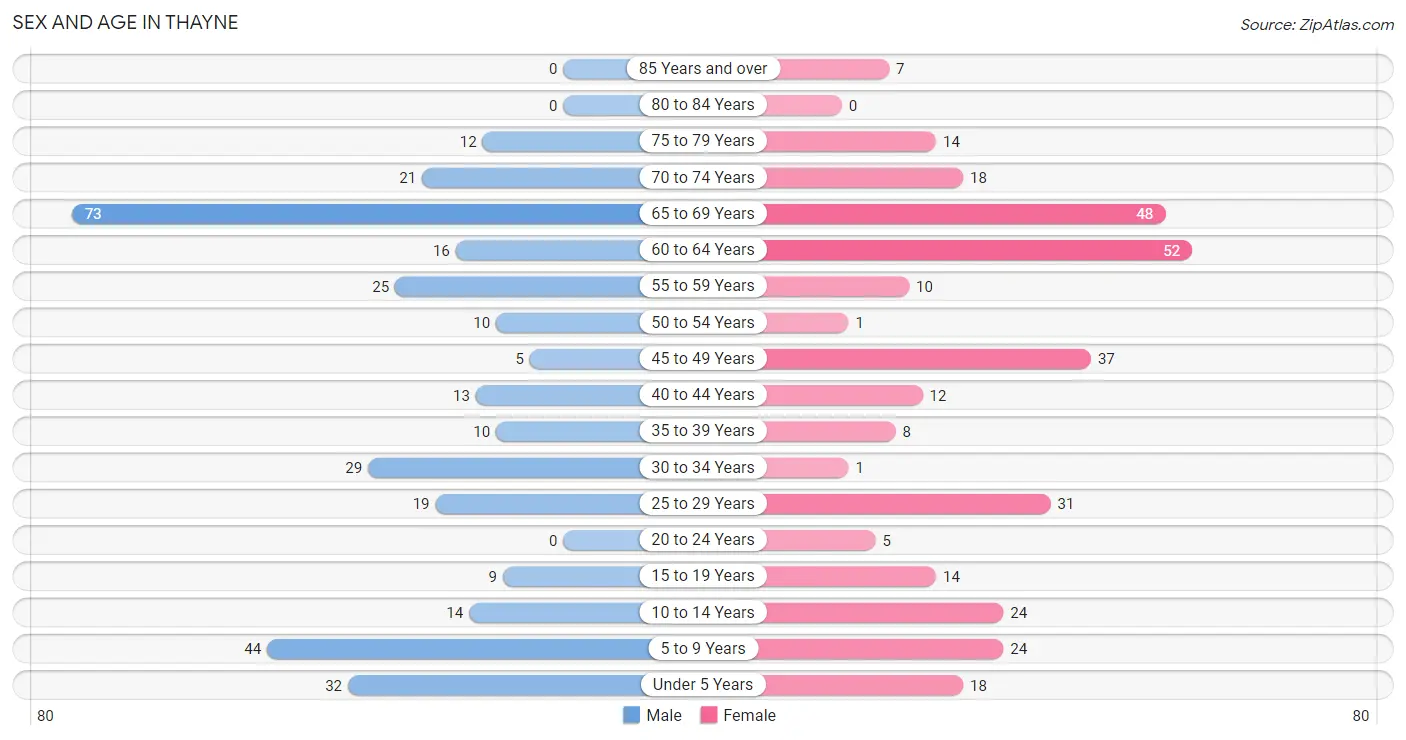
The most populous age groups in Thayne are 65 to 69 Years (73 | 22.0%) for men and 60 to 64 Years (52 | 16.1%) for women.
| Age Bracket | Male | Female |
| Under 5 Years | 32 (9.6%) | 18 (5.6%) |
| 5 to 9 Years | 44 (13.3%) | 24 (7.4%) |
| 10 to 14 Years | 14 (4.2%) | 24 (7.4%) |
| 15 to 19 Years | 9 (2.7%) | 14 (4.3%) |
| 20 to 24 Years | 0 (0.0%) | 5 (1.5%) |
| 25 to 29 Years | 19 (5.7%) | 31 (9.6%) |
| 30 to 34 Years | 29 (8.7%) | 1 (0.3%) |
| 35 to 39 Years | 10 (3.0%) | 8 (2.5%) |
| 40 to 44 Years | 13 (3.9%) | 12 (3.7%) |
| 45 to 49 Years | 5 (1.5%) | 37 (11.4%) |
| 50 to 54 Years | 10 (3.0%) | 1 (0.3%) |
| 55 to 59 Years | 25 (7.5%) | 10 (3.1%) |
| 60 to 64 Years | 16 (4.8%) | 52 (16.1%) |
| 65 to 69 Years | 73 (22.0%) | 48 (14.8%) |
| 70 to 74 Years | 21 (6.3%) | 18 (5.6%) |
| 75 to 79 Years | 12 (3.6%) | 14 (4.3%) |
| 80 to 84 Years | 0 (0.0%) | 0 (0.0%) |
| 85 Years and over | 0 (0.0%) | 7 (2.2%) |
| Total | 332 (100.0%) | 324 (100.0%) |
Families and Households in Thayne
Median Family Size in Thayne
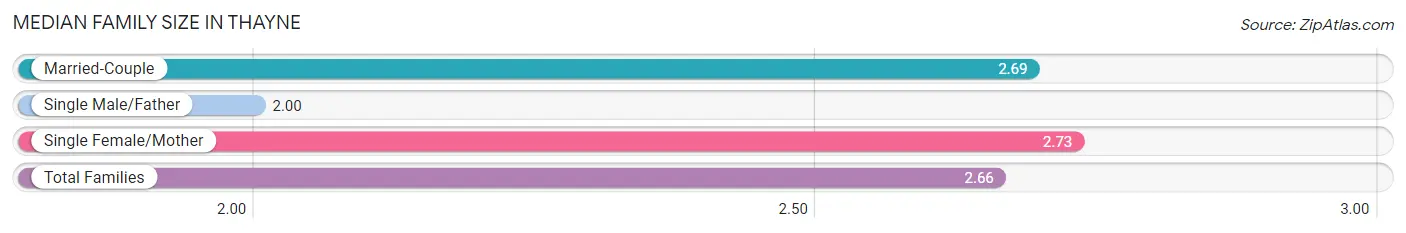
The median family size in Thayne is 2.66 persons per family, with single female/mother families (26 | 12.3%) accounting for the largest median family size of 2.73 persons per family. On the other hand, single male/father families (12 | 5.7%) represent the smallest median family size with 2.00 persons per family.
| Family Type | # Families | Family Size |
| Married-Couple | 173 (82.0%) | 2.69 |
| Single Male/Father | 12 (5.7%) | 2.00 |
| Single Female/Mother | 26 (12.3%) | 2.73 |
| Total Families | 211 (100.0%) | 2.66 |
Median Household Size in Thayne
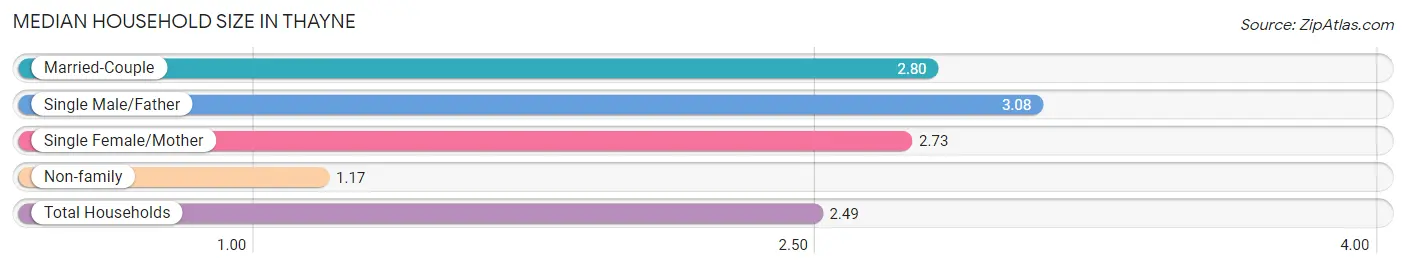
The median household size in Thayne is 2.49 persons per household, with single male/father households (12 | 4.6%) accounting for the largest median household size of 3.08 persons per household. non-family households (52 | 19.8%) represent the smallest median household size with 1.17 persons per household.
| Household Type | # Households | Household Size |
| Married-Couple | 173 (65.8%) | 2.80 |
| Single Male/Father | 12 (4.6%) | 3.08 |
| Single Female/Mother | 26 (9.9%) | 2.73 |
| Non-family | 52 (19.8%) | 1.17 |
| Total Households | 263 (100.0%) | 2.49 |
Household Size by Marriage Status in Thayne
Out of a total of 263 households in Thayne, 211 (80.2%) are family households, while 52 (19.8%) are nonfamily households. The most numerous type of family households are 2-person households, comprising 103, and the most common type of nonfamily households are 1-person households, comprising 44.
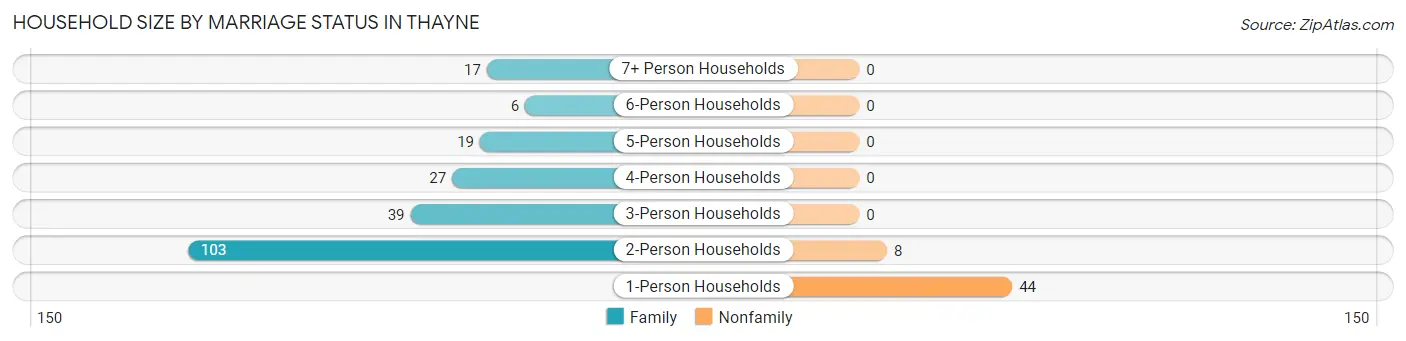
| Household Size | Family Households | Nonfamily Households |
| 1-Person Households | - | 44 (16.7%) |
| 2-Person Households | 103 (39.2%) | 8 (3.0%) |
| 3-Person Households | 39 (14.8%) | 0 (0.0%) |
| 4-Person Households | 27 (10.3%) | 0 (0.0%) |
| 5-Person Households | 19 (7.2%) | 0 (0.0%) |
| 6-Person Households | 6 (2.3%) | 0 (0.0%) |
| 7+ Person Households | 17 (6.5%) | 0 (0.0%) |
| Total | 211 (80.2%) | 52 (19.8%) |
Female Fertility in Thayne
Fertility by Age in Thayne
Average fertility rate in Thayne is 46.0 births per 1,000 women. Women in the age bracket of 20 to 34 years have the highest fertility rate with 135.0 births per 1,000 women. Women in the age bracket of 20 to 34 years acount for 100.0% of all women with births.
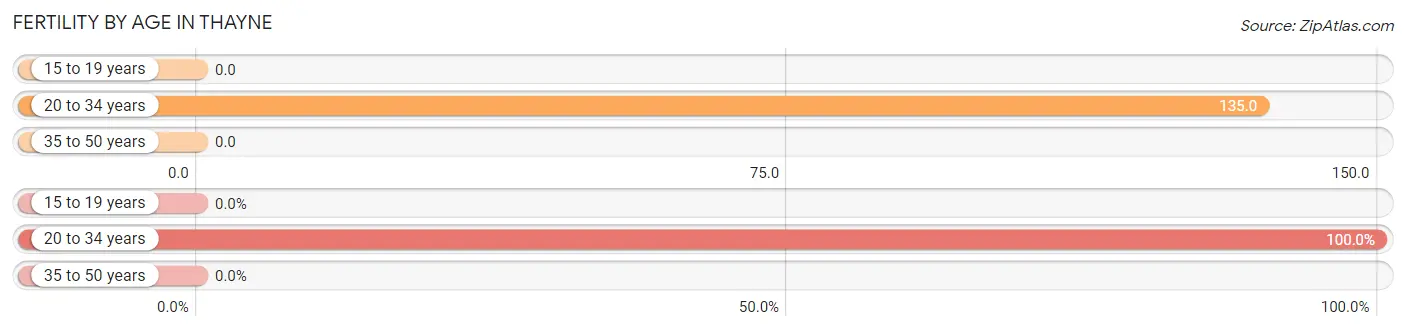
| Age Bracket | Women with Births | Births / 1,000 Women |
| 15 to 19 years | 0 (0.0%) | 0.0 |
| 20 to 34 years | 5 (100.0%) | 135.0 |
| 35 to 50 years | 0 (0.0%) | 0.0 |
| Total | 5 (100.0%) | 46.0 |
Fertility by Age by Marriage Status in Thayne
40.0% of women with births (5) in Thayne are married. The highest percentage of unmarried women with births falls into 20 to 34 years age bracket with 60.0% of them unmarried at the time of birth, while the lowest percentage of unmarried women with births belong to 20 to 34 years age bracket with 60.0% of them unmarried.
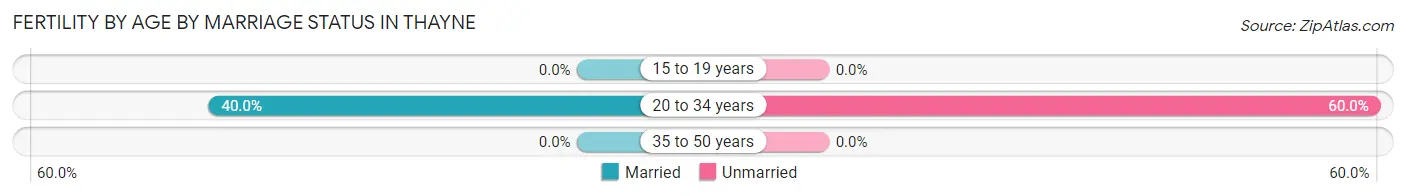
| Age Bracket | Married | Unmarried |
| 15 to 19 years | 0 (0.0%) | 0 (0.0%) |
| 20 to 34 years | 2 (40.0%) | 3 (60.0%) |
| 35 to 50 years | 0 (0.0%) | 0 (0.0%) |
| Total | 2 (40.0%) | 3 (60.0%) |
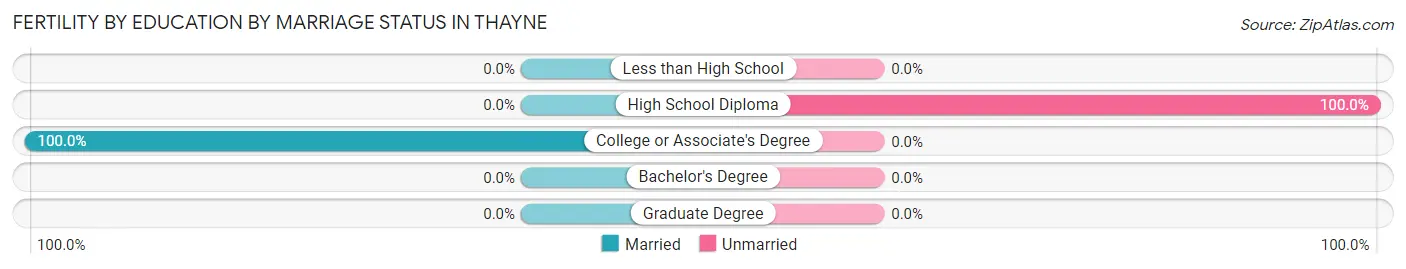
Fertility by Education in Thayne
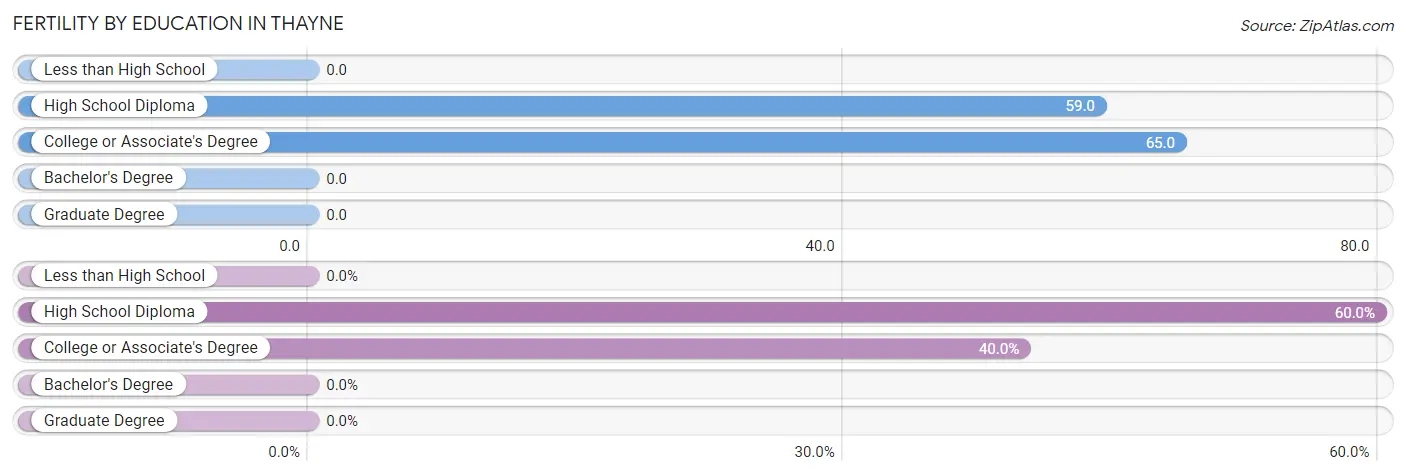
| Educational Attainment | Women with Births | Births / 1,000 Women |
| Less than High School | 0 (0.0%) | 0.0 |
| High School Diploma | 3 (60.0%) | 59.0 |
| College or Associate's Degree | 2 (40.0%) | 65.0 |
| Bachelor's Degree | 0 (0.0%) | 0.0 |
| Graduate Degree | 0 (0.0%) | 0.0 |
| Total | 5 (100.0%) | 46.0 |
Fertility by Education by Marriage Status in Thayne
60.0% of women with births in Thayne are unmarried. Women with the educational attainment of college or associate's degree are most likely to be married with 100.0% of them married at childbirth, while women with the educational attainment of high school diploma are least likely to be married with 100.0% of them unmarried at childbirth.
| Educational Attainment | Married | Unmarried |
| Less than High School | 0 (0.0%) | 0 (0.0%) |
| High School Diploma | 0 (0.0%) | 3 (100.0%) |
| College or Associate's Degree | 2 (100.0%) | 0 (0.0%) |
| Bachelor's Degree | 0 (0.0%) | 0 (0.0%) |
| Graduate Degree | 0 (0.0%) | 0 (0.0%) |
| Total | 2 (40.0%) | 3 (60.0%) |
Employment Characteristics in Thayne
Employment by Class of Employer in Thayne
Among the 301 employed individuals in Thayne, private company employees (126 | 41.9%), self-employed (incorporated) (64 | 21.3%), and self-employed (not incorporated) (60 | 19.9%) make up the most common classes of employment.
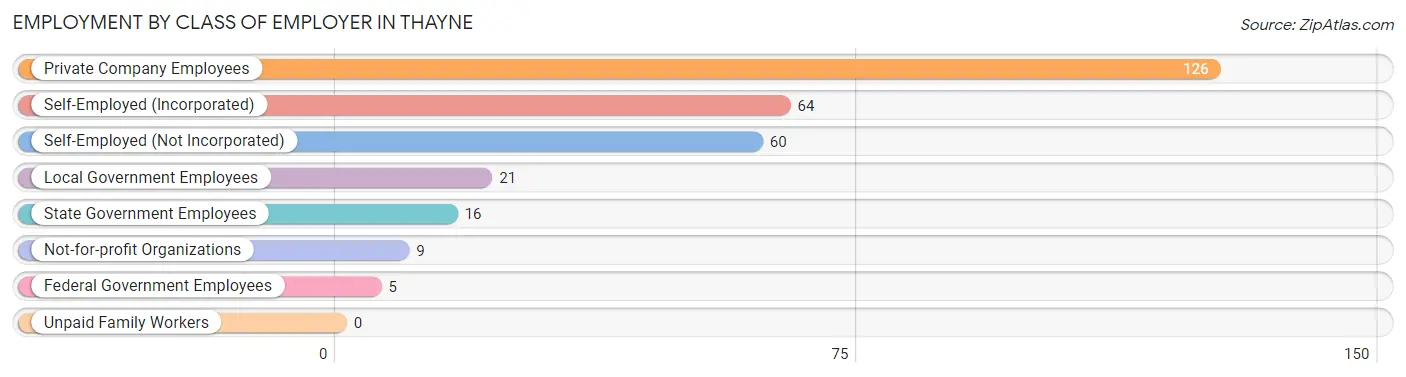
| Employer Class | # Employees | % Employees |
| Private Company Employees | 126 | 41.9% |
| Self-Employed (Incorporated) | 64 | 21.3% |
| Self-Employed (Not Incorporated) | 60 | 19.9% |
| Not-for-profit Organizations | 9 | 3.0% |
| Local Government Employees | 21 | 7.0% |
| State Government Employees | 16 | 5.3% |
| Federal Government Employees | 5 | 1.7% |
| Unpaid Family Workers | 0 | 0.0% |
| Total | 301 | 100.0% |
Employment Status by Age in Thayne
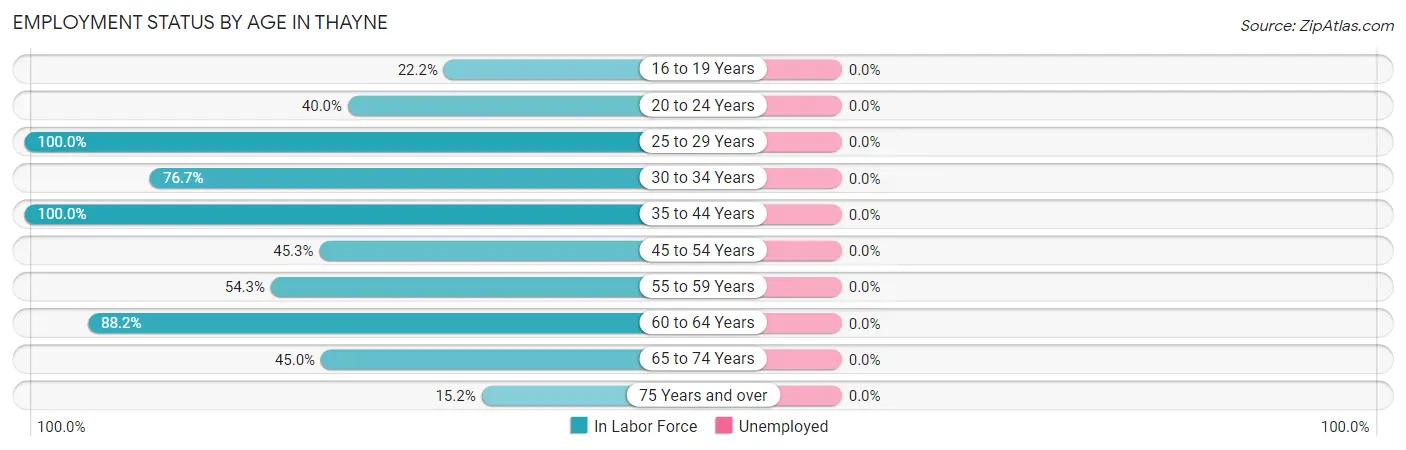
| Age Bracket | In Labor Force | Unemployed |
| 16 to 19 Years | 4 (22.2%) | 0 (0.0%) |
| 20 to 24 Years | 2 (40.0%) | 0 (0.0%) |
| 25 to 29 Years | 50 (100.0%) | 0 (0.0%) |
| 30 to 34 Years | 23 (76.7%) | 0 (0.0%) |
| 35 to 44 Years | 43 (100.0%) | 0 (0.0%) |
| 45 to 54 Years | 24 (45.3%) | 0 (0.0%) |
| 55 to 59 Years | 19 (54.3%) | 0 (0.0%) |
| 60 to 64 Years | 60 (88.2%) | 0 (0.0%) |
| 65 to 74 Years | 72 (45.0%) | 0 (0.0%) |
| 75 Years and over | 5 (15.2%) | 0 (0.0%) |
| Total | 302 (61.0%) | 0 (0.0%) |
Employment Status by Educational Attainment in Thayne
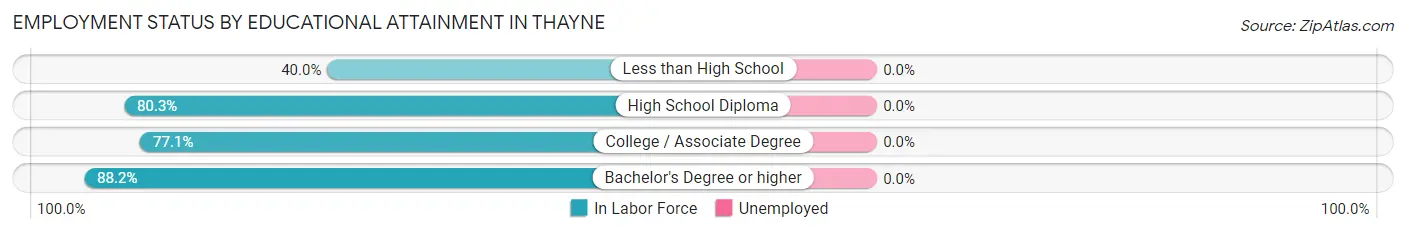
| Educational Attainment | In Labor Force | Unemployed |
| Less than High School | 4 (40.0%) | 0 (0.0%) |
| High School Diploma | 94 (80.3%) | 0 (0.0%) |
| College / Associate Degree | 91 (77.1%) | 0 (0.0%) |
| Bachelor's Degree or higher | 30 (88.2%) | 0 (0.0%) |
| Total | 219 (78.5%) | 0 (0.0%) |
Employment Occupations by Sex in Thayne
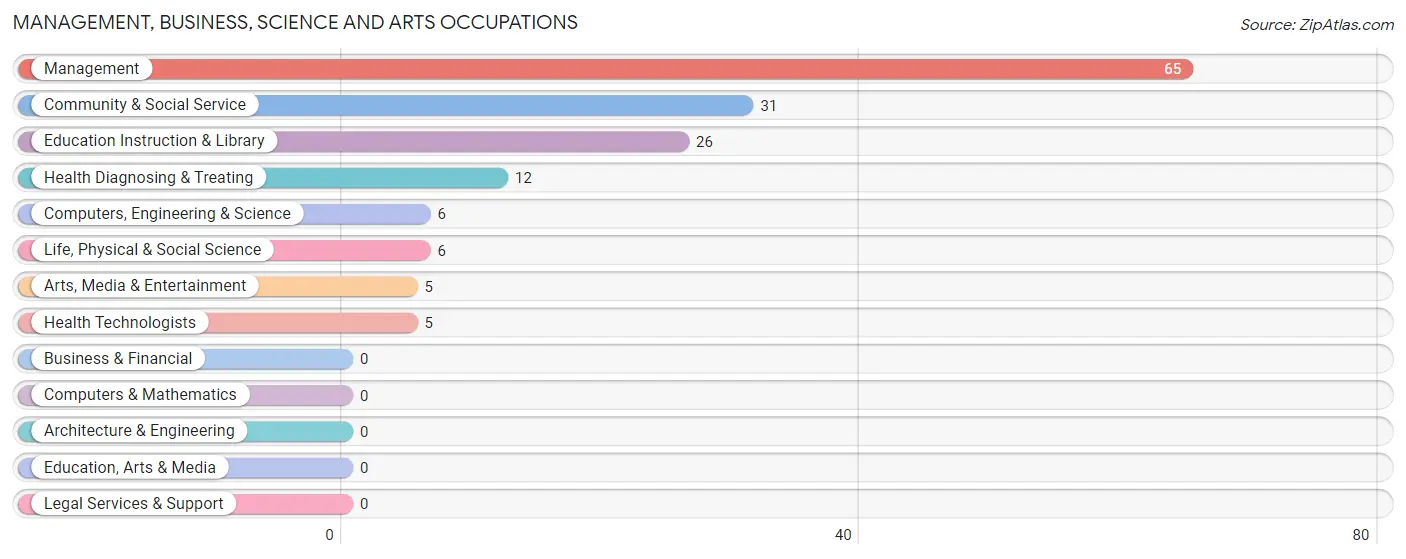
Management, Business, Science and Arts Occupations
The most common Management, Business, Science and Arts occupations in Thayne are Management (65 | 21.5%), Community & Social Service (31 | 10.3%), Education Instruction & Library (26 | 8.6%), Health Diagnosing & Treating (12 | 4.0%), and Computers, Engineering & Science (6 | 2.0%).
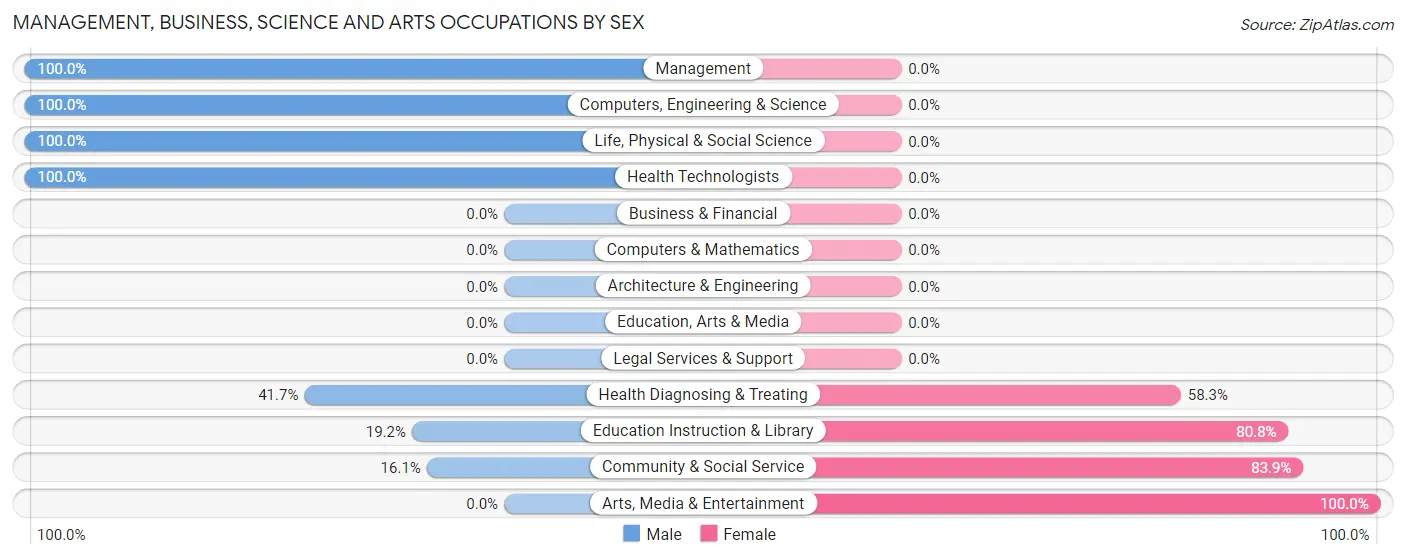
Management, Business, Science and Arts Occupations by Sex
Within the Management, Business, Science and Arts occupations in Thayne, the most male-oriented occupations are Management (100.0%), Computers, Engineering & Science (100.0%), and Life, Physical & Social Science (100.0%), while the most female-oriented occupations are Arts, Media & Entertainment (100.0%), Community & Social Service (83.9%), and Education Instruction & Library (80.8%).
| Occupation | Male | Female |
| Management | 65 (100.0%) | 0 (0.0%) |
| Business & Financial | 0 (0.0%) | 0 (0.0%) |
| Computers, Engineering & Science | 6 (100.0%) | 0 (0.0%) |
| Computers & Mathematics | 0 (0.0%) | 0 (0.0%) |
| Architecture & Engineering | 0 (0.0%) | 0 (0.0%) |
| Life, Physical & Social Science | 6 (100.0%) | 0 (0.0%) |
| Community & Social Service | 5 (16.1%) | 26 (83.9%) |
| Education, Arts & Media | 0 (0.0%) | 0 (0.0%) |
| Legal Services & Support | 0 (0.0%) | 0 (0.0%) |
| Education Instruction & Library | 5 (19.2%) | 21 (80.8%) |
| Arts, Media & Entertainment | 0 (0.0%) | 5 (100.0%) |
| Health Diagnosing & Treating | 5 (41.7%) | 7 (58.3%) |
| Health Technologists | 5 (100.0%) | 0 (0.0%) |
| Total (Category) | 81 (71.1%) | 33 (28.9%) |
| Total (Overall) | 174 (57.6%) | 128 (42.4%) |
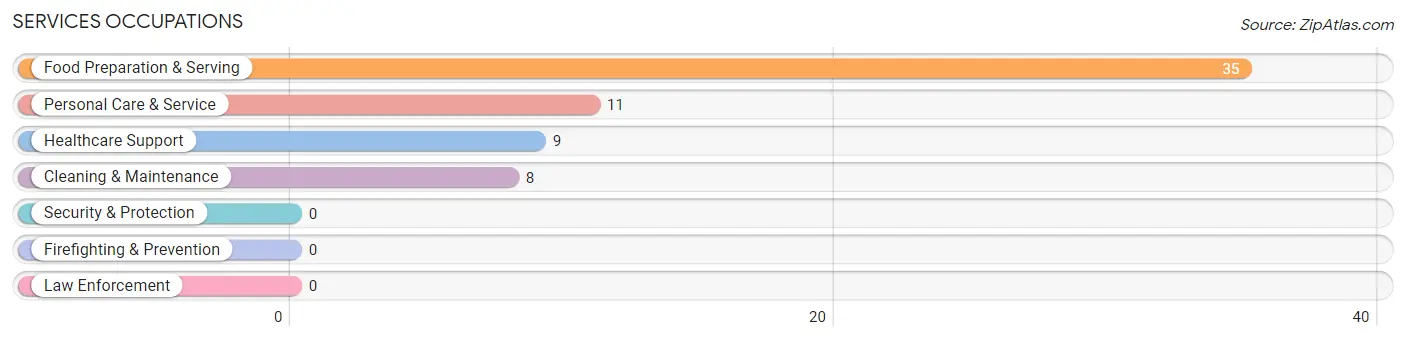
Services Occupations
The most common Services occupations in Thayne are Food Preparation & Serving (35 | 11.6%), Personal Care & Service (11 | 3.6%), Healthcare Support (9 | 3.0%), and Cleaning & Maintenance (8 | 2.6%).
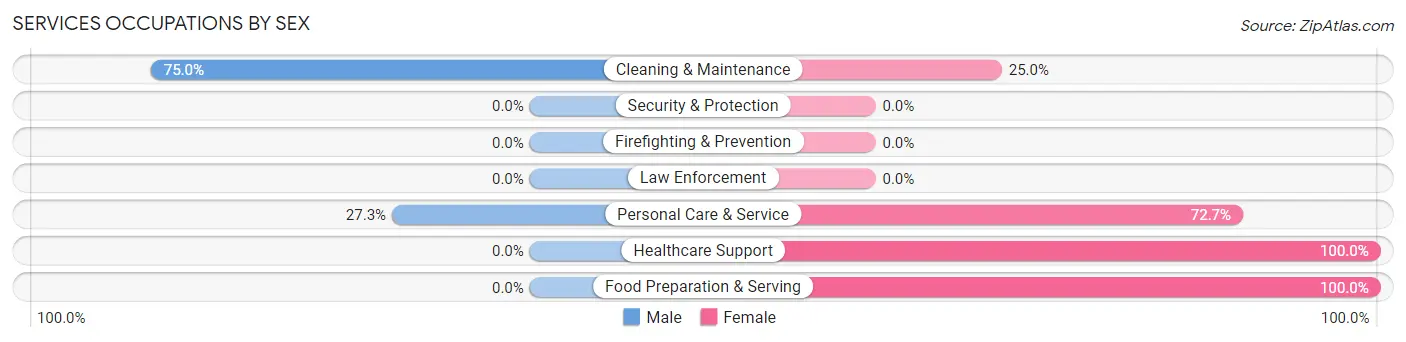
Services Occupations by Sex
Within the Services occupations in Thayne, the most male-oriented occupations are Cleaning & Maintenance (75.0%), and Personal Care & Service (27.3%), while the most female-oriented occupations are Healthcare Support (100.0%), Food Preparation & Serving (100.0%), and Personal Care & Service (72.7%).
| Occupation | Male | Female |
| Healthcare Support | 0 (0.0%) | 9 (100.0%) |
| Security & Protection | 0 (0.0%) | 0 (0.0%) |
| Firefighting & Prevention | 0 (0.0%) | 0 (0.0%) |
| Law Enforcement | 0 (0.0%) | 0 (0.0%) |
| Food Preparation & Serving | 0 (0.0%) | 35 (100.0%) |
| Cleaning & Maintenance | 6 (75.0%) | 2 (25.0%) |
| Personal Care & Service | 3 (27.3%) | 8 (72.7%) |
| Total (Category) | 9 (14.3%) | 54 (85.7%) |
| Total (Overall) | 174 (57.6%) | 128 (42.4%) |
Sales and Office Occupations
The most common Sales and Office occupations in Thayne are Office & Administration (29 | 9.6%), and Sales & Related (25 | 8.3%).
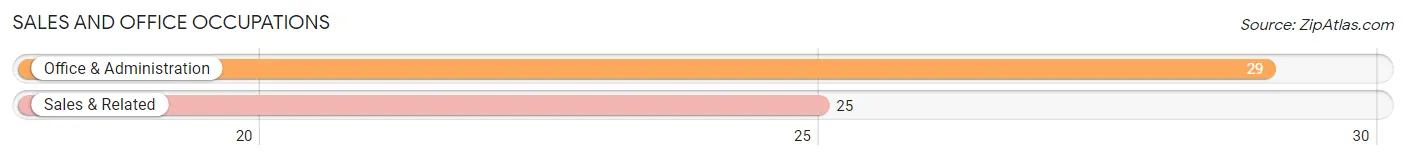
Sales and Office Occupations by Sex
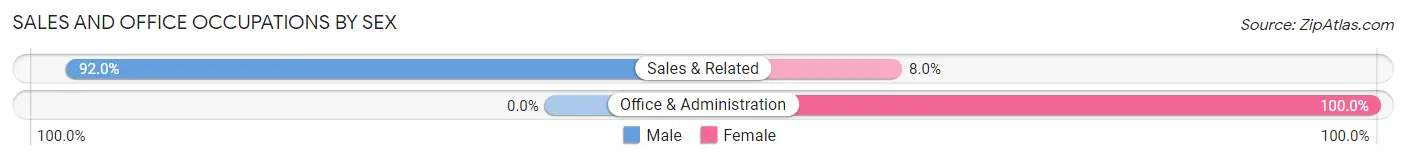
| Occupation | Male | Female |
| Sales & Related | 23 (92.0%) | 2 (8.0%) |
| Office & Administration | 0 (0.0%) | 29 (100.0%) |
| Total (Category) | 23 (42.6%) | 31 (57.4%) |
| Total (Overall) | 174 (57.6%) | 128 (42.4%) |
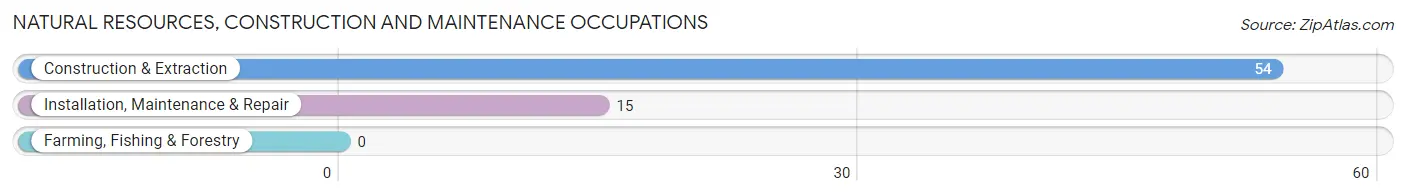
Natural Resources, Construction and Maintenance Occupations
The most common Natural Resources, Construction and Maintenance occupations in Thayne are Construction & Extraction (54 | 17.9%), and Installation, Maintenance & Repair (15 | 5.0%).
Natural Resources, Construction and Maintenance Occupations by Sex
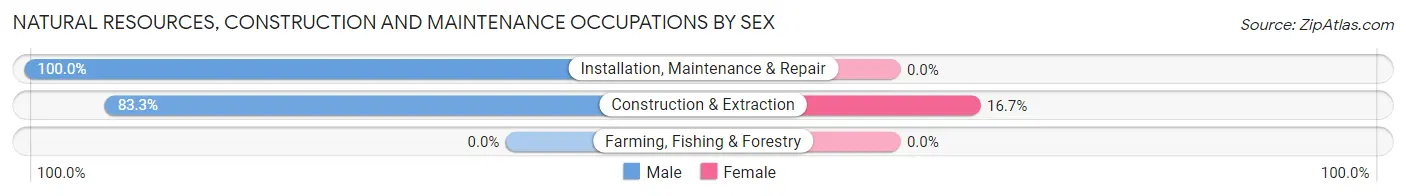
| Occupation | Male | Female |
| Farming, Fishing & Forestry | 0 (0.0%) | 0 (0.0%) |
| Construction & Extraction | 45 (83.3%) | 9 (16.7%) |
| Installation, Maintenance & Repair | 15 (100.0%) | 0 (0.0%) |
| Total (Category) | 60 (87.0%) | 9 (13.0%) |
| Total (Overall) | 174 (57.6%) | 128 (42.4%) |
Production, Transportation and Moving Occupations
The most common Production, Transportation and Moving occupations in Thayne are Production (1 | 0.3%), and Material Moving (1 | 0.3%).
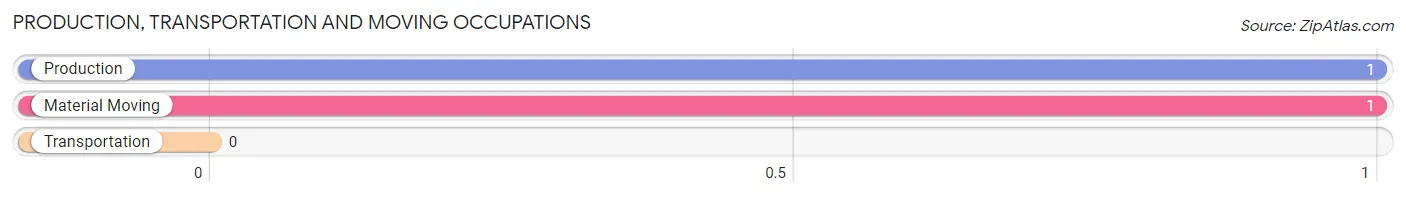
Production, Transportation and Moving Occupations by Sex
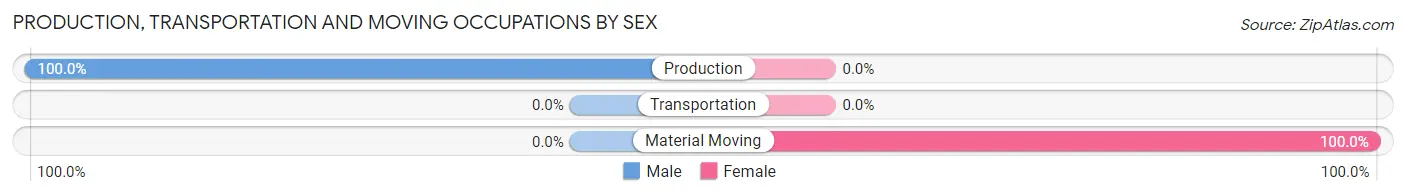
| Occupation | Male | Female |
| Production | 1 (100.0%) | 0 (0.0%) |
| Transportation | 0 (0.0%) | 0 (0.0%) |
| Material Moving | 0 (0.0%) | 1 (100.0%) |
| Total (Category) | 1 (50.0%) | 1 (50.0%) |
| Total (Overall) | 174 (57.6%) | 128 (42.4%) |
Employment Industries by Sex in Thayne
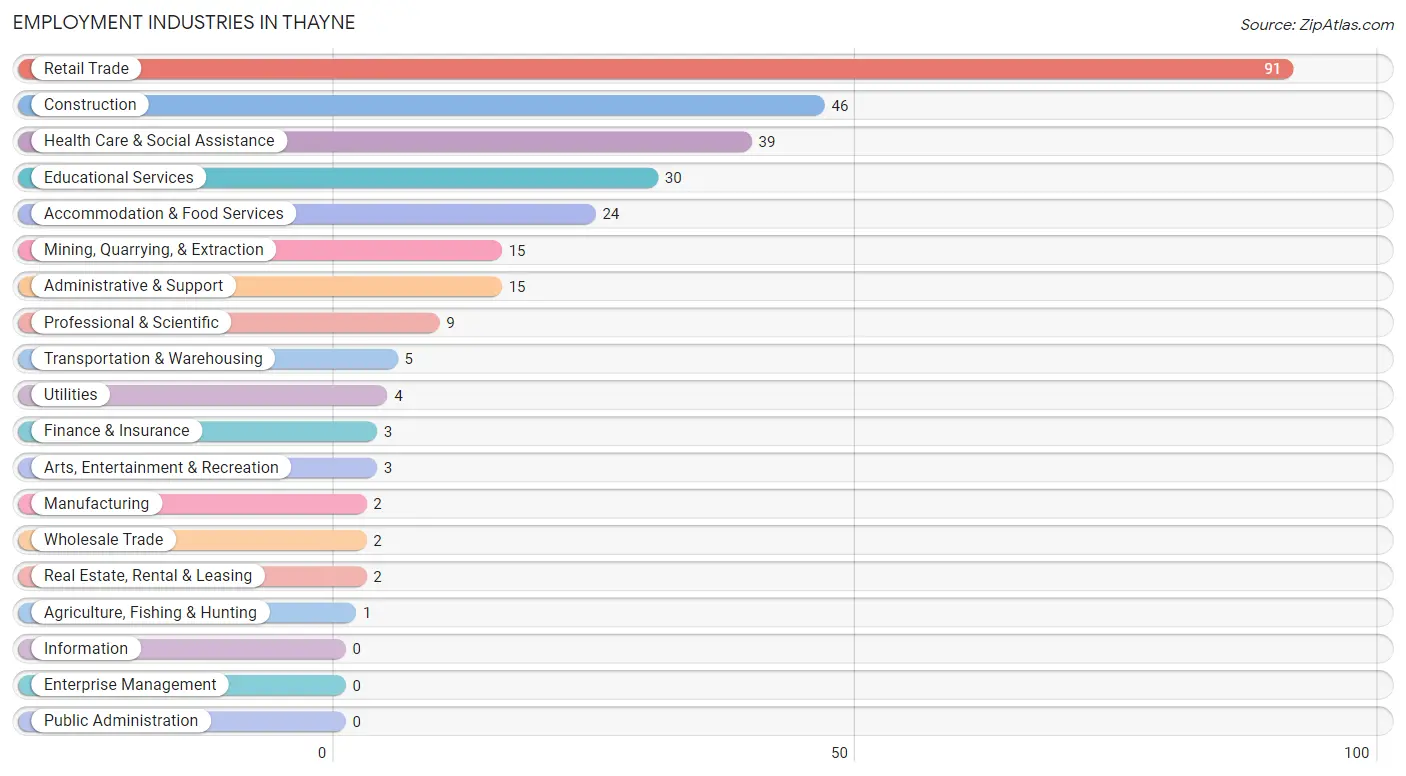
Employment Industries in Thayne
The major employment industries in Thayne include Retail Trade (91 | 30.1%), Construction (46 | 15.2%), Health Care & Social Assistance (39 | 12.9%), Educational Services (30 | 9.9%), and Accommodation & Food Services (24 | 8.0%).
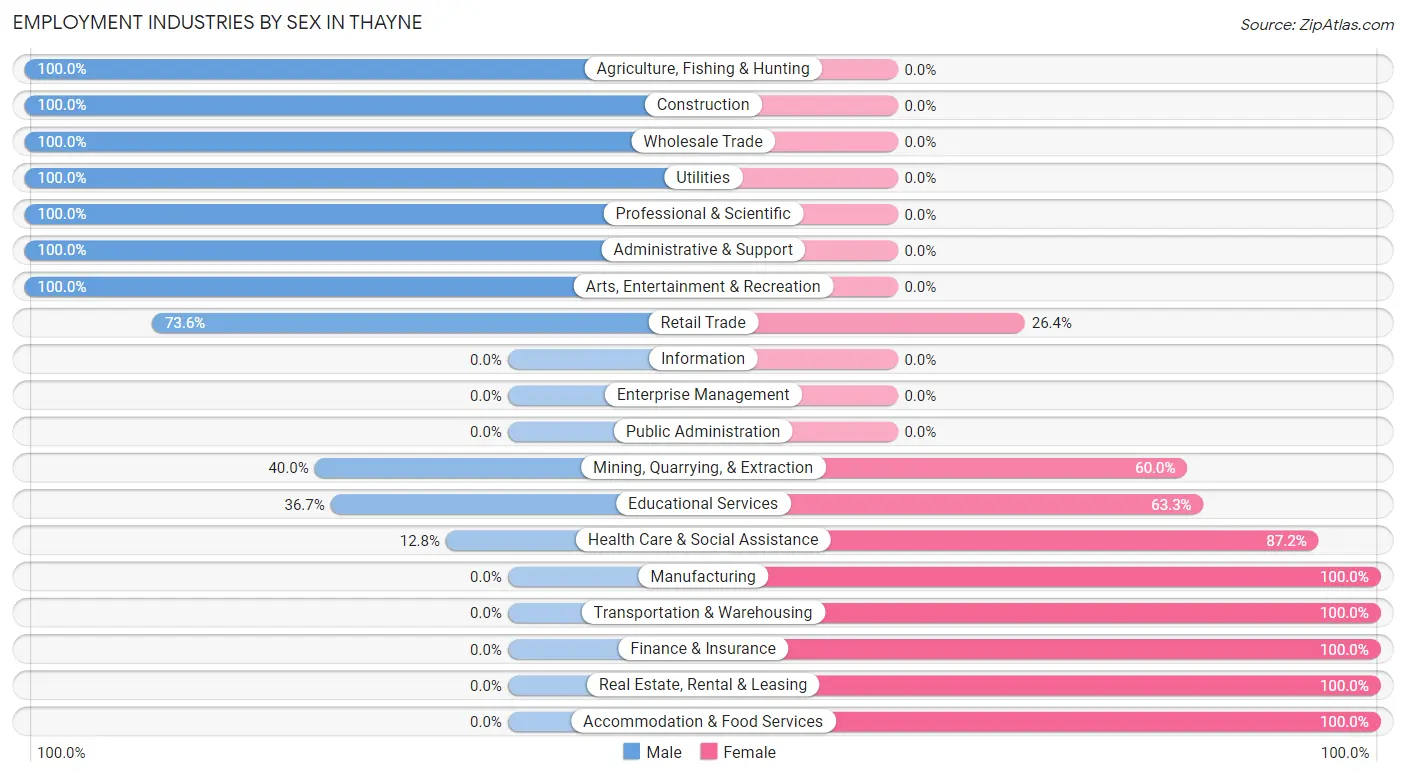
Employment Industries by Sex in Thayne
The Thayne industries that see more men than women are Agriculture, Fishing & Hunting (100.0%), Construction (100.0%), and Wholesale Trade (100.0%), whereas the industries that tend to have a higher number of women are Manufacturing (100.0%), Transportation & Warehousing (100.0%), and Finance & Insurance (100.0%).
| Industry | Male | Female |
| Agriculture, Fishing & Hunting | 1 (100.0%) | 0 (0.0%) |
| Mining, Quarrying, & Extraction | 6 (40.0%) | 9 (60.0%) |
| Construction | 46 (100.0%) | 0 (0.0%) |
| Manufacturing | 0 (0.0%) | 2 (100.0%) |
| Wholesale Trade | 2 (100.0%) | 0 (0.0%) |
| Retail Trade | 67 (73.6%) | 24 (26.4%) |
| Transportation & Warehousing | 0 (0.0%) | 5 (100.0%) |
| Utilities | 4 (100.0%) | 0 (0.0%) |
| Information | 0 (0.0%) | 0 (0.0%) |
| Finance & Insurance | 0 (0.0%) | 3 (100.0%) |
| Real Estate, Rental & Leasing | 0 (0.0%) | 2 (100.0%) |
| Professional & Scientific | 9 (100.0%) | 0 (0.0%) |
| Enterprise Management | 0 (0.0%) | 0 (0.0%) |
| Administrative & Support | 15 (100.0%) | 0 (0.0%) |
| Educational Services | 11 (36.7%) | 19 (63.3%) |
| Health Care & Social Assistance | 5 (12.8%) | 34 (87.2%) |
| Arts, Entertainment & Recreation | 3 (100.0%) | 0 (0.0%) |
| Accommodation & Food Services | 0 (0.0%) | 24 (100.0%) |
| Public Administration | 0 (0.0%) | 0 (0.0%) |
| Total | 174 (57.6%) | 128 (42.4%) |
Education in Thayne
School Enrollment in Thayne
The most common levels of schooling among the 143 students in Thayne are elementary school (41 | 28.7%), middle school (33 | 23.1%), and nursery / preschool (25 | 17.5%).
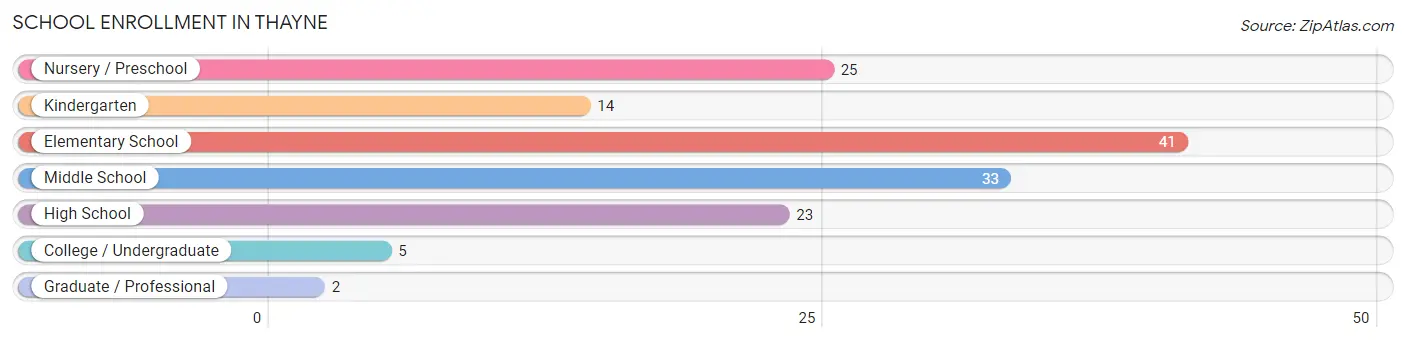
| School Level | # Students | % Students |
| Nursery / Preschool | 25 | 17.5% |
| Kindergarten | 14 | 9.8% |
| Elementary School | 41 | 28.7% |
| Middle School | 33 | 23.1% |
| High School | 23 | 16.1% |
| College / Undergraduate | 5 | 3.5% |
| Graduate / Professional | 2 | 1.4% |
| Total | 143 | 100.0% |
School Enrollment by Age by Funding Source in Thayne
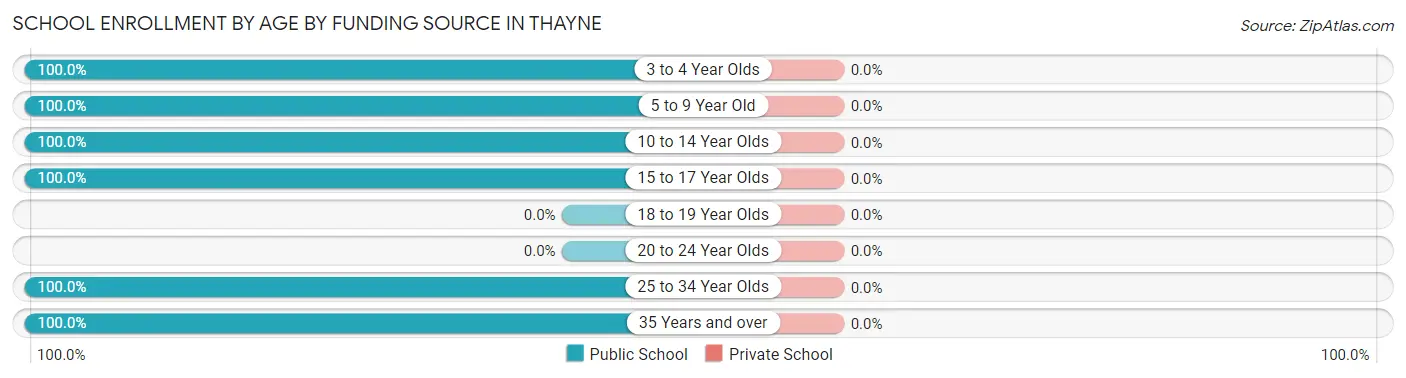
| Age Bracket | Public School | Private School |
| 3 to 4 Year Olds | 10 (100.0%) | 0 (0.0%) |
| 5 to 9 Year Old | 65 (100.0%) | 0 (0.0%) |
| 10 to 14 Year Olds | 38 (100.0%) | 0 (0.0%) |
| 15 to 17 Year Olds | 23 (100.0%) | 0 (0.0%) |
| 18 to 19 Year Olds | 0 (0.0%) | 0 (0.0%) |
| 20 to 24 Year Olds | 0 (0.0%) | 0 (0.0%) |
| 25 to 34 Year Olds | 1 (100.0%) | 0 (0.0%) |
| 35 Years and over | 6 (100.0%) | 0 (0.0%) |
| Total | 143 (100.0%) | 0 (0.0%) |
Educational Attainment by Field of Study in Thayne
Engineering (46 | 51.7%), education (17 | 19.1%), business (15 | 16.9%), bio, nature & agricultural (6 | 6.7%), and science & technology (2 | 2.2%) are the most common fields of study among 89 individuals in Thayne who have obtained a bachelor's degree or higher.
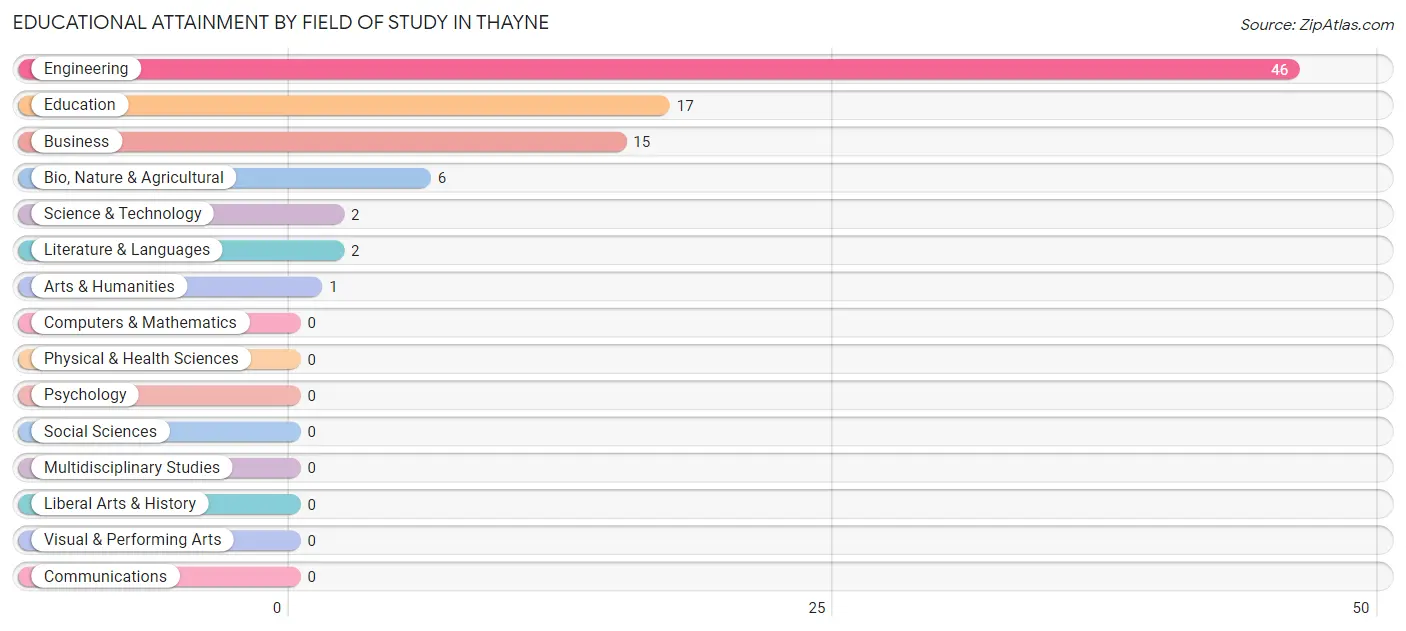
| Field of Study | # Graduates | % Graduates |
| Computers & Mathematics | 0 | 0.0% |
| Bio, Nature & Agricultural | 6 | 6.7% |
| Physical & Health Sciences | 0 | 0.0% |
| Psychology | 0 | 0.0% |
| Social Sciences | 0 | 0.0% |
| Engineering | 46 | 51.7% |
| Multidisciplinary Studies | 0 | 0.0% |
| Science & Technology | 2 | 2.2% |
| Business | 15 | 16.9% |
| Education | 17 | 19.1% |
| Literature & Languages | 2 | 2.2% |
| Liberal Arts & History | 0 | 0.0% |
| Visual & Performing Arts | 0 | 0.0% |
| Communications | 0 | 0.0% |
| Arts & Humanities | 1 | 1.1% |
| Total | 89 | 100.0% |
Transportation & Commute in Thayne
Vehicle Availability by Sex in Thayne
The most prevalent vehicle ownership categories in Thayne are males with 2 vehicles (84, accounting for 48.3%) and females with 2 vehicles (40, making up 66.1%).
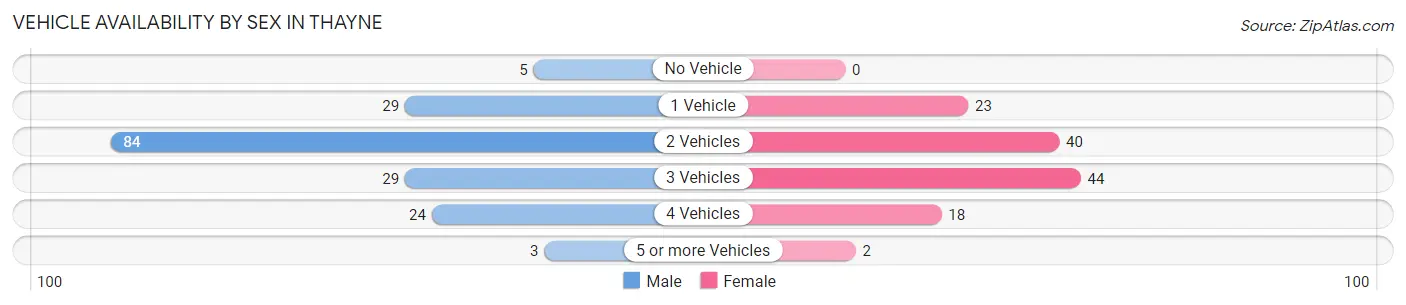
| Vehicles Available | Male | Female |
| No Vehicle | 5 (2.9%) | 0 (0.0%) |
| 1 Vehicle | 29 (16.7%) | 23 (18.1%) |
| 2 Vehicles | 84 (48.3%) | 40 (31.5%) |
| 3 Vehicles | 29 (16.7%) | 44 (34.6%) |
| 4 Vehicles | 24 (13.8%) | 18 (14.2%) |
| 5 or more Vehicles | 3 (1.7%) | 2 (1.6%) |
| Total | 174 (100.0%) | 127 (100.0%) |
Commute Time in Thayne
The most frequently occuring commute durations in Thayne are 5 to 9 minutes (102 commuters, 34.9%), less than 5 minutes (58 commuters, 19.9%), and 20 to 24 minutes (55 commuters, 18.8%).
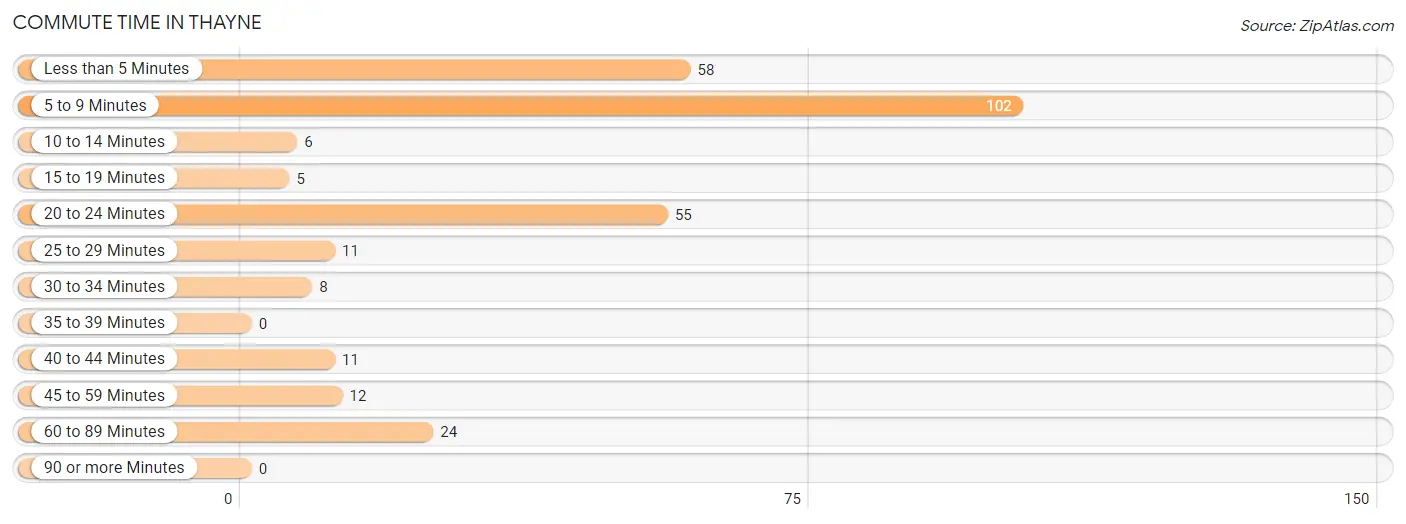
| Commute Time | # Commuters | % Commuters |
| Less than 5 Minutes | 58 | 19.9% |
| 5 to 9 Minutes | 102 | 34.9% |
| 10 to 14 Minutes | 6 | 2.1% |
| 15 to 19 Minutes | 5 | 1.7% |
| 20 to 24 Minutes | 55 | 18.8% |
| 25 to 29 Minutes | 11 | 3.8% |
| 30 to 34 Minutes | 8 | 2.7% |
| 35 to 39 Minutes | 0 | 0.0% |
| 40 to 44 Minutes | 11 | 3.8% |
| 45 to 59 Minutes | 12 | 4.1% |
| 60 to 89 Minutes | 24 | 8.2% |
| 90 or more Minutes | 0 | 0.0% |
Commute Time by Sex in Thayne
The most common commute times in Thayne are 5 to 9 minutes (51 commuters, 30.9%) for males and 5 to 9 minutes (51 commuters, 40.2%) for females.
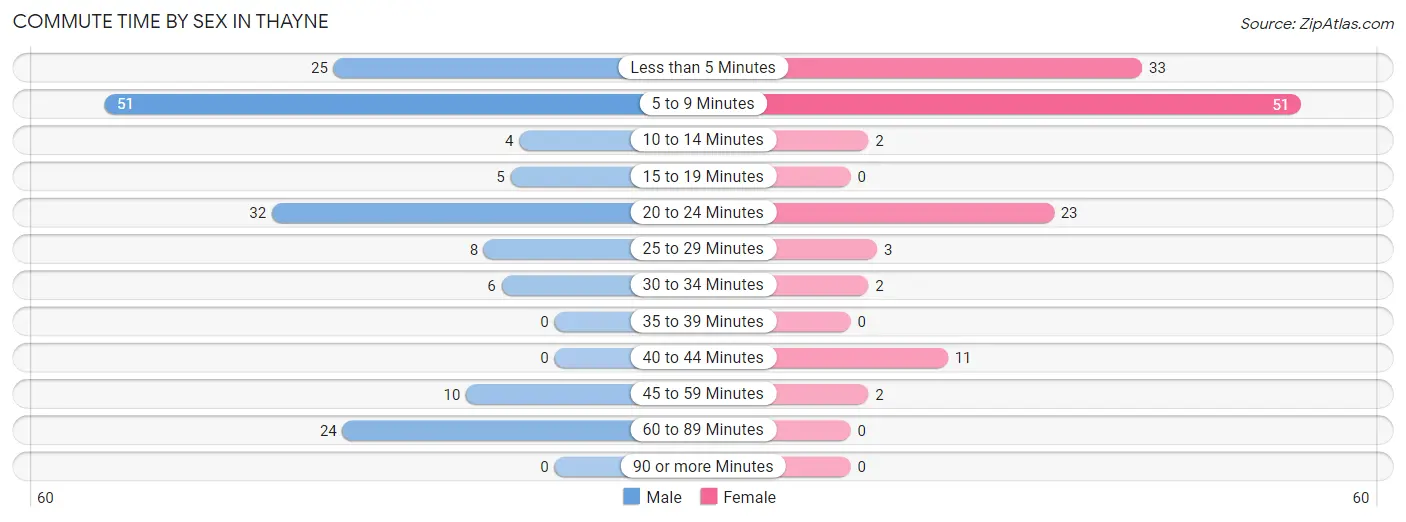
| Commute Time | Male | Female |
| Less than 5 Minutes | 25 (15.1%) | 33 (26.0%) |
| 5 to 9 Minutes | 51 (30.9%) | 51 (40.2%) |
| 10 to 14 Minutes | 4 (2.4%) | 2 (1.6%) |
| 15 to 19 Minutes | 5 (3.0%) | 0 (0.0%) |
| 20 to 24 Minutes | 32 (19.4%) | 23 (18.1%) |
| 25 to 29 Minutes | 8 (4.9%) | 3 (2.4%) |
| 30 to 34 Minutes | 6 (3.6%) | 2 (1.6%) |
| 35 to 39 Minutes | 0 (0.0%) | 0 (0.0%) |
| 40 to 44 Minutes | 0 (0.0%) | 11 (8.7%) |
| 45 to 59 Minutes | 10 (6.1%) | 2 (1.6%) |
| 60 to 89 Minutes | 24 (14.5%) | 0 (0.0%) |
| 90 or more Minutes | 0 (0.0%) | 0 (0.0%) |
Time of Departure to Work by Sex in Thayne
The most frequent times of departure to work in Thayne are 6:30 AM to 6:59 AM (57, 34.5%) for males and 7:00 AM to 7:29 AM (42, 33.1%) for females.
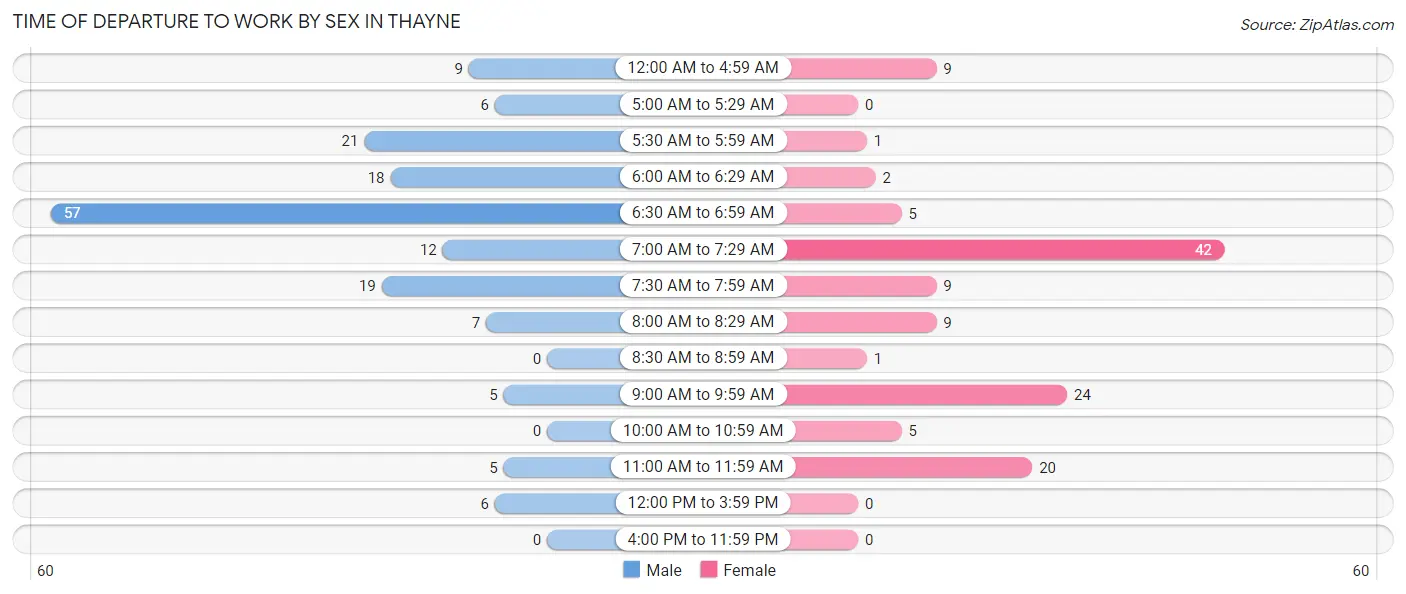
| Time of Departure | Male | Female |
| 12:00 AM to 4:59 AM | 9 (5.4%) | 9 (7.1%) |
| 5:00 AM to 5:29 AM | 6 (3.6%) | 0 (0.0%) |
| 5:30 AM to 5:59 AM | 21 (12.7%) | 1 (0.8%) |
| 6:00 AM to 6:29 AM | 18 (10.9%) | 2 (1.6%) |
| 6:30 AM to 6:59 AM | 57 (34.5%) | 5 (3.9%) |
| 7:00 AM to 7:29 AM | 12 (7.3%) | 42 (33.1%) |
| 7:30 AM to 7:59 AM | 19 (11.5%) | 9 (7.1%) |
| 8:00 AM to 8:29 AM | 7 (4.2%) | 9 (7.1%) |
| 8:30 AM to 8:59 AM | 0 (0.0%) | 1 (0.8%) |
| 9:00 AM to 9:59 AM | 5 (3.0%) | 24 (18.9%) |
| 10:00 AM to 10:59 AM | 0 (0.0%) | 5 (3.9%) |
| 11:00 AM to 11:59 AM | 5 (3.0%) | 20 (15.8%) |
| 12:00 PM to 3:59 PM | 6 (3.6%) | 0 (0.0%) |
| 4:00 PM to 11:59 PM | 0 (0.0%) | 0 (0.0%) |
| Total | 165 (100.0%) | 127 (100.0%) |
Housing Occupancy in Thayne
Occupancy by Ownership in Thayne
Of the total 263 dwellings in Thayne, owner-occupied units account for 202 (76.8%), while renter-occupied units make up 61 (23.2%).
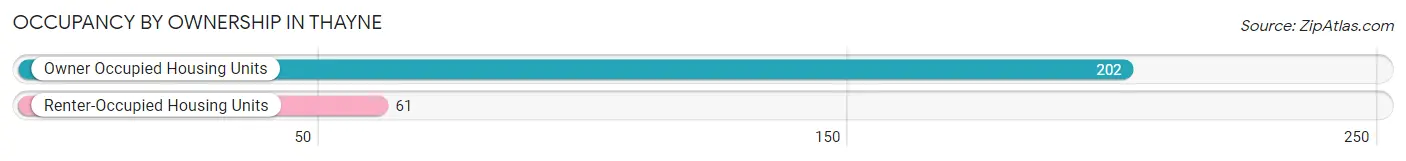
| Occupancy | # Housing Units | % Housing Units |
| Owner Occupied Housing Units | 202 | 76.8% |
| Renter-Occupied Housing Units | 61 | 23.2% |
| Total Occupied Housing Units | 263 | 100.0% |
Occupancy by Household Size in Thayne
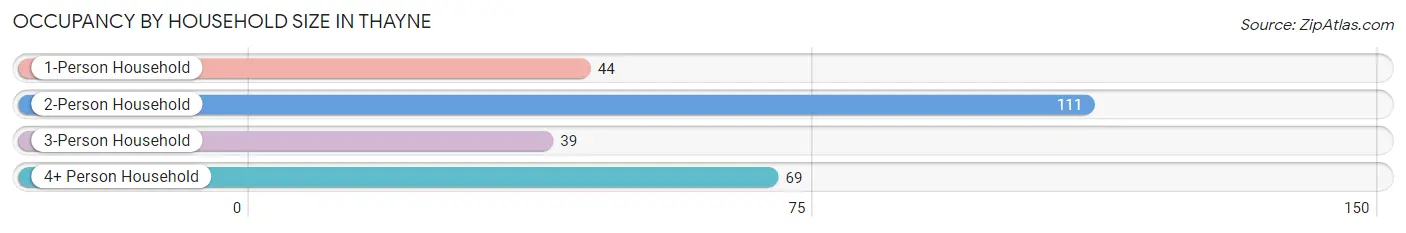
| Household Size | # Housing Units | % Housing Units |
| 1-Person Household | 44 | 16.7% |
| 2-Person Household | 111 | 42.2% |
| 3-Person Household | 39 | 14.8% |
| 4+ Person Household | 69 | 26.2% |
| Total Housing Units | 263 | 100.0% |
Occupancy by Ownership by Household Size in Thayne
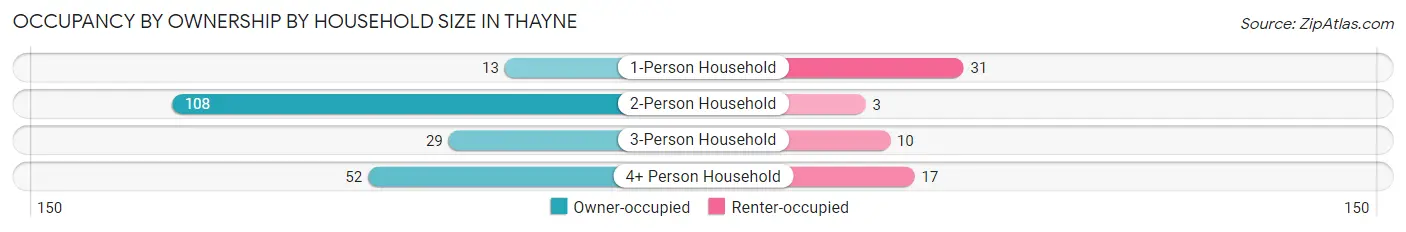
| Household Size | Owner-occupied | Renter-occupied |
| 1-Person Household | 13 (29.5%) | 31 (70.5%) |
| 2-Person Household | 108 (97.3%) | 3 (2.7%) |
| 3-Person Household | 29 (74.4%) | 10 (25.6%) |
| 4+ Person Household | 52 (75.4%) | 17 (24.6%) |
| Total Housing Units | 202 (76.8%) | 61 (23.2%) |
Occupancy by Educational Attainment in Thayne
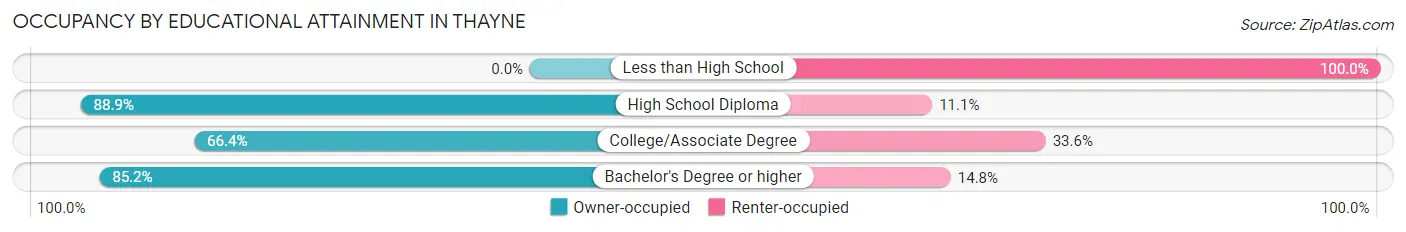
| Household Size | Owner-occupied | Renter-occupied |
| Less than High School | 0 (0.0%) | 3 (100.0%) |
| High School Diploma | 56 (88.9%) | 7 (11.1%) |
| College/Associate Degree | 77 (66.4%) | 39 (33.6%) |
| Bachelor's Degree or higher | 69 (85.2%) | 12 (14.8%) |
Occupancy by Age of Householder in Thayne
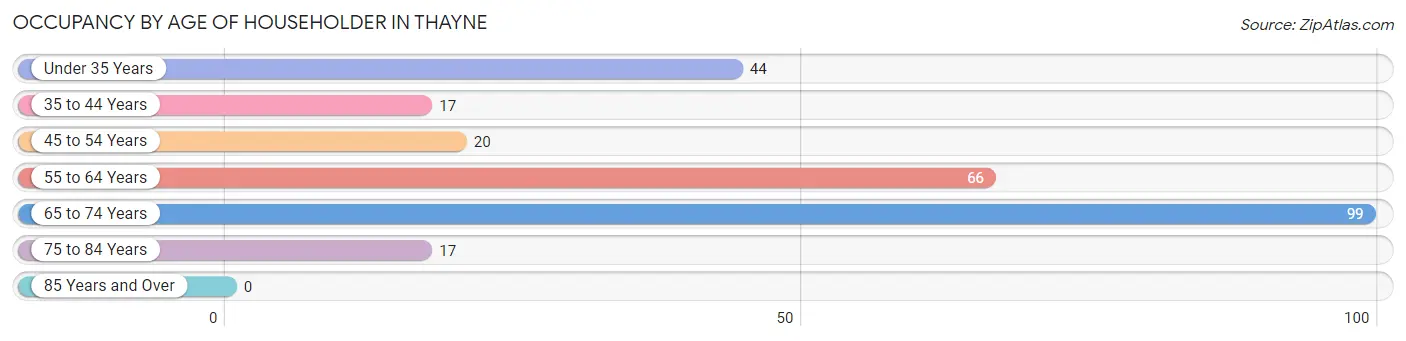
| Age Bracket | # Households | % Households |
| Under 35 Years | 44 | 16.7% |
| 35 to 44 Years | 17 | 6.5% |
| 45 to 54 Years | 20 | 7.6% |
| 55 to 64 Years | 66 | 25.1% |
| 65 to 74 Years | 99 | 37.6% |
| 75 to 84 Years | 17 | 6.5% |
| 85 Years and Over | 0 | 0.0% |
| Total | 263 | 100.0% |
Housing Finances in Thayne
Median Income by Occupancy in Thayne
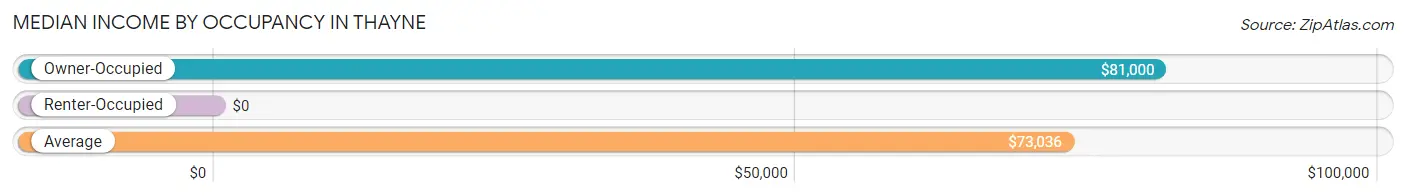
| Occupancy Type | # Households | Median Income |
| Owner-Occupied | 202 (76.8%) | $81,000 |
| Renter-Occupied | 61 (23.2%) | $0 |
| Average | 263 (100.0%) | $73,036 |
Occupancy by Householder Income Bracket in Thayne
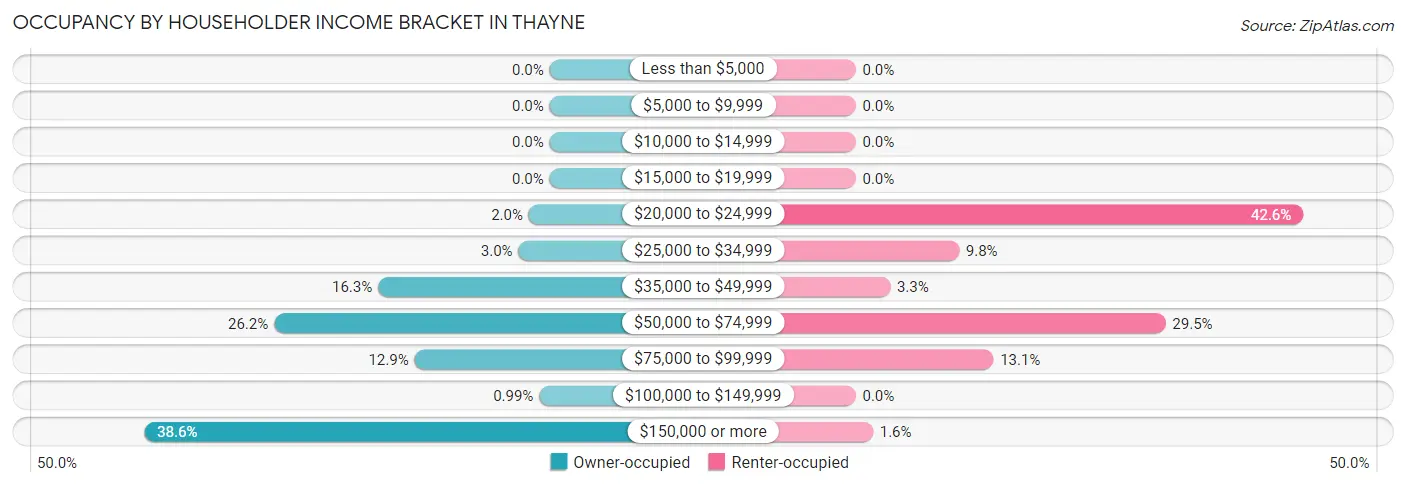
| Income Bracket | Owner-occupied | Renter-occupied |
| Less than $5,000 | 0 (0.0%) | 0 (0.0%) |
| $5,000 to $9,999 | 0 (0.0%) | 0 (0.0%) |
| $10,000 to $14,999 | 0 (0.0%) | 0 (0.0%) |
| $15,000 to $19,999 | 0 (0.0%) | 0 (0.0%) |
| $20,000 to $24,999 | 4 (2.0%) | 26 (42.6%) |
| $25,000 to $34,999 | 6 (3.0%) | 6 (9.8%) |
| $35,000 to $49,999 | 33 (16.3%) | 2 (3.3%) |
| $50,000 to $74,999 | 53 (26.2%) | 18 (29.5%) |
| $75,000 to $99,999 | 26 (12.9%) | 8 (13.1%) |
| $100,000 to $149,999 | 2 (1.0%) | 0 (0.0%) |
| $150,000 or more | 78 (38.6%) | 1 (1.6%) |
| Total | 202 (100.0%) | 61 (100.0%) |
Monthly Housing Cost Tiers in Thayne
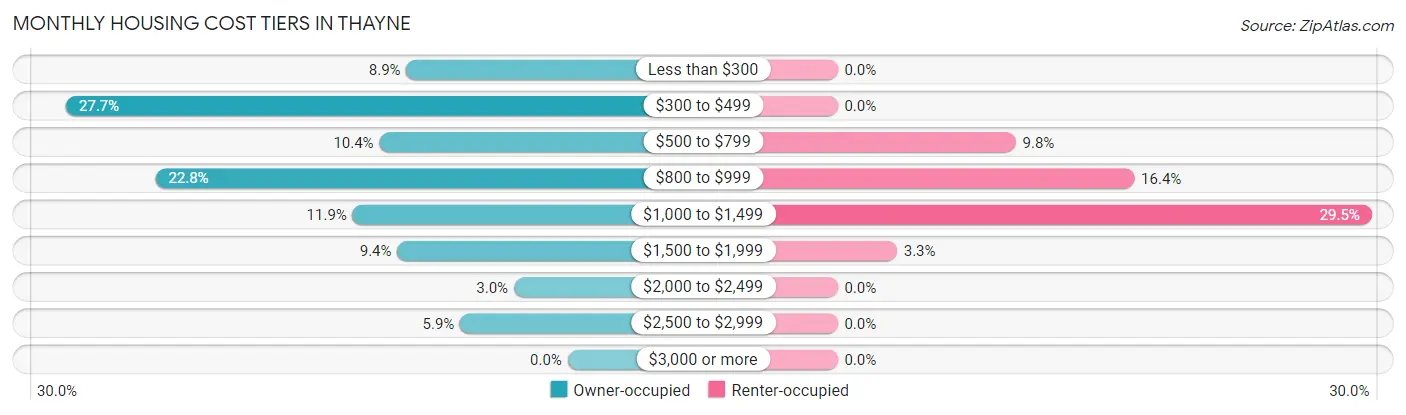
| Monthly Cost | Owner-occupied | Renter-occupied |
| Less than $300 | 18 (8.9%) | 0 (0.0%) |
| $300 to $499 | 56 (27.7%) | 0 (0.0%) |
| $500 to $799 | 21 (10.4%) | 6 (9.8%) |
| $800 to $999 | 46 (22.8%) | 10 (16.4%) |
| $1,000 to $1,499 | 24 (11.9%) | 18 (29.5%) |
| $1,500 to $1,999 | 19 (9.4%) | 2 (3.3%) |
| $2,000 to $2,499 | 6 (3.0%) | 0 (0.0%) |
| $2,500 to $2,999 | 12 (5.9%) | 0 (0.0%) |
| $3,000 or more | 0 (0.0%) | 0 (0.0%) |
| Total | 202 (100.0%) | 61 (100.0%) |
Physical Housing Characteristics in Thayne
Housing Structures in Thayne
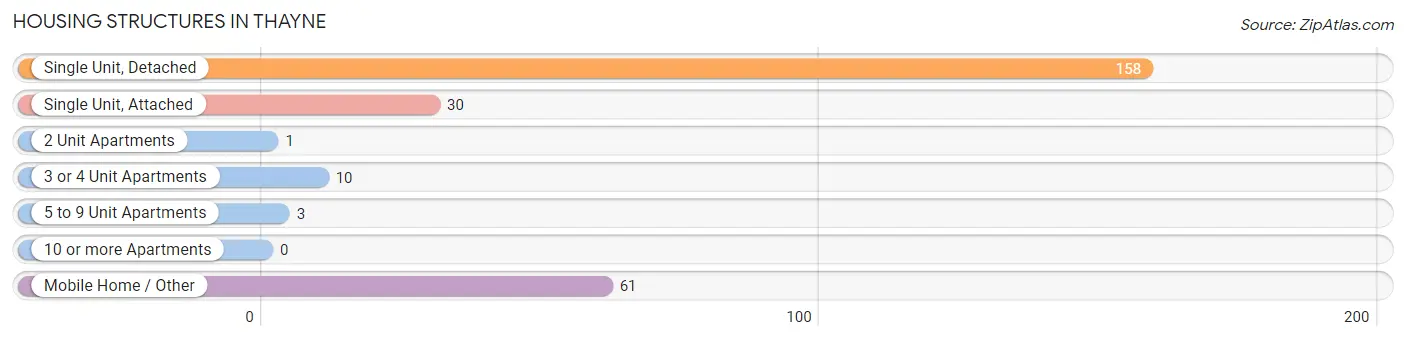
| Structure Type | # Housing Units | % Housing Units |
| Single Unit, Detached | 158 | 60.1% |
| Single Unit, Attached | 30 | 11.4% |
| 2 Unit Apartments | 1 | 0.4% |
| 3 or 4 Unit Apartments | 10 | 3.8% |
| 5 to 9 Unit Apartments | 3 | 1.1% |
| 10 or more Apartments | 0 | 0.0% |
| Mobile Home / Other | 61 | 23.2% |
| Total | 263 | 100.0% |
Housing Structures by Occupancy in Thayne
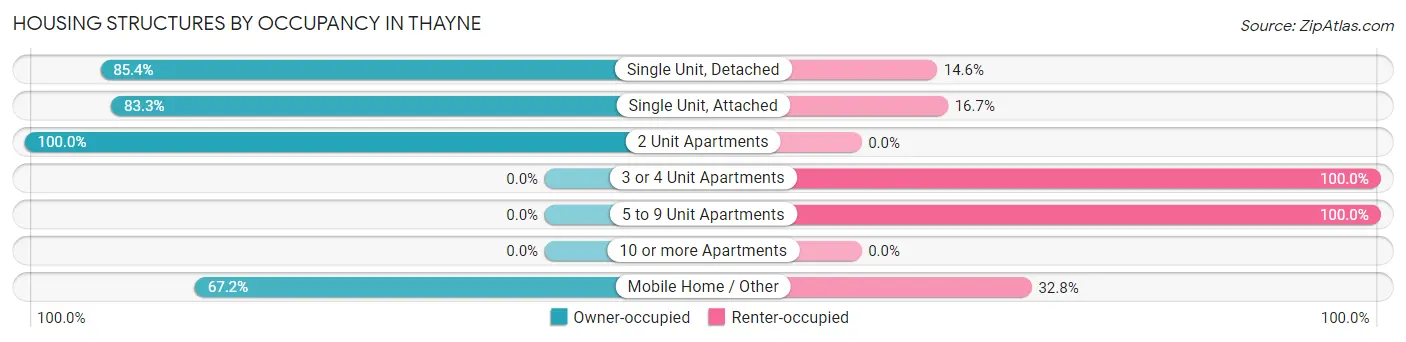
| Structure Type | Owner-occupied | Renter-occupied |
| Single Unit, Detached | 135 (85.4%) | 23 (14.6%) |
| Single Unit, Attached | 25 (83.3%) | 5 (16.7%) |
| 2 Unit Apartments | 1 (100.0%) | 0 (0.0%) |
| 3 or 4 Unit Apartments | 0 (0.0%) | 10 (100.0%) |
| 5 to 9 Unit Apartments | 0 (0.0%) | 3 (100.0%) |
| 10 or more Apartments | 0 (0.0%) | 0 (0.0%) |
| Mobile Home / Other | 41 (67.2%) | 20 (32.8%) |
| Total | 202 (76.8%) | 61 (23.2%) |
Housing Structures by Number of Rooms in Thayne
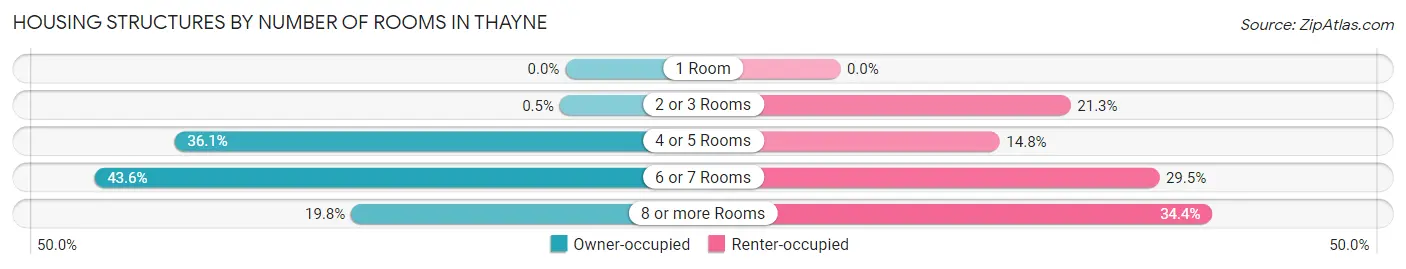
| Number of Rooms | Owner-occupied | Renter-occupied |
| 1 Room | 0 (0.0%) | 0 (0.0%) |
| 2 or 3 Rooms | 1 (0.5%) | 13 (21.3%) |
| 4 or 5 Rooms | 73 (36.1%) | 9 (14.7%) |
| 6 or 7 Rooms | 88 (43.6%) | 18 (29.5%) |
| 8 or more Rooms | 40 (19.8%) | 21 (34.4%) |
| Total | 202 (100.0%) | 61 (100.0%) |
Housing Structure by Heating Type in Thayne
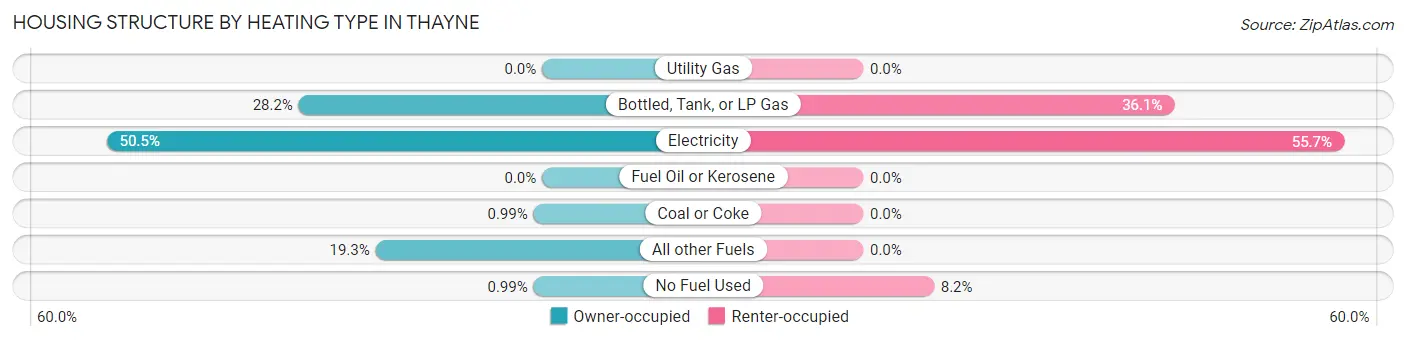
| Heating Type | Owner-occupied | Renter-occupied |
| Utility Gas | 0 (0.0%) | 0 (0.0%) |
| Bottled, Tank, or LP Gas | 57 (28.2%) | 22 (36.1%) |
| Electricity | 102 (50.5%) | 34 (55.7%) |
| Fuel Oil or Kerosene | 0 (0.0%) | 0 (0.0%) |
| Coal or Coke | 2 (1.0%) | 0 (0.0%) |
| All other Fuels | 39 (19.3%) | 0 (0.0%) |
| No Fuel Used | 2 (1.0%) | 5 (8.2%) |
| Total | 202 (100.0%) | 61 (100.0%) |
Household Vehicle Usage in Thayne
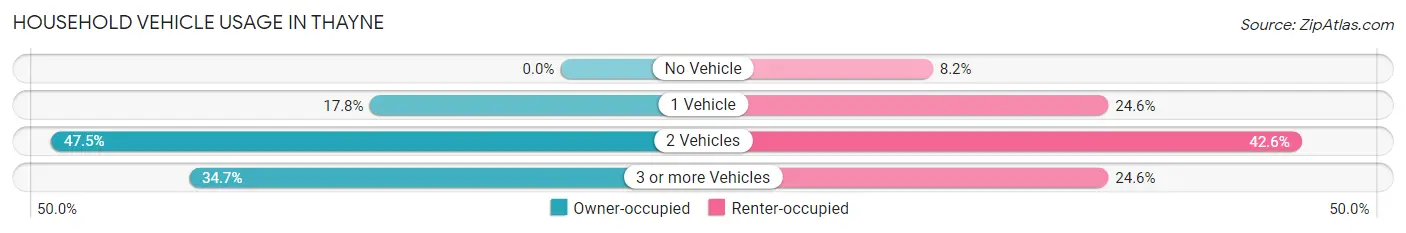
| Vehicles per Household | Owner-occupied | Renter-occupied |
| No Vehicle | 0 (0.0%) | 5 (8.2%) |
| 1 Vehicle | 36 (17.8%) | 15 (24.6%) |
| 2 Vehicles | 96 (47.5%) | 26 (42.6%) |
| 3 or more Vehicles | 70 (34.6%) | 15 (24.6%) |
| Total | 202 (100.0%) | 61 (100.0%) |
Real Estate & Mortgages in Thayne
Real Estate and Mortgage Overview in Thayne
| Characteristic | Without Mortgage | With Mortgage |
| Housing Units | 139 | 63 |
| Median Property Value | $409,800 | $251,800 |
| Median Household Income | - | - |
| Monthly Housing Costs | $493 | $0 |
| Real Estate Taxes | - | - |
Property Value by Mortgage Status in Thayne
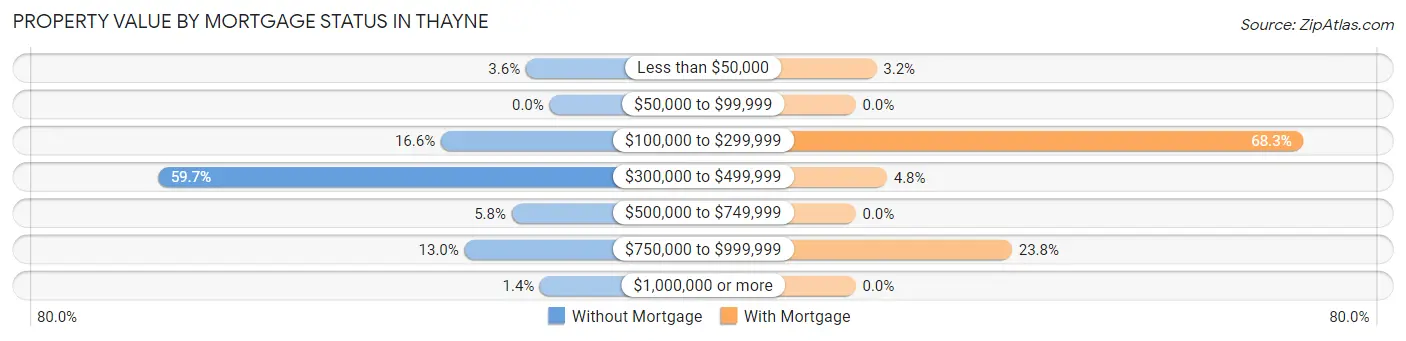
| Property Value | Without Mortgage | With Mortgage |
| Less than $50,000 | 5 (3.6%) | 2 (3.2%) |
| $50,000 to $99,999 | 0 (0.0%) | 0 (0.0%) |
| $100,000 to $299,999 | 23 (16.6%) | 43 (68.2%) |
| $300,000 to $499,999 | 83 (59.7%) | 3 (4.8%) |
| $500,000 to $749,999 | 8 (5.8%) | 0 (0.0%) |
| $750,000 to $999,999 | 18 (13.0%) | 15 (23.8%) |
| $1,000,000 or more | 2 (1.4%) | 0 (0.0%) |
| Total | 139 (100.0%) | 63 (100.0%) |
Household Income by Mortgage Status in Thayne
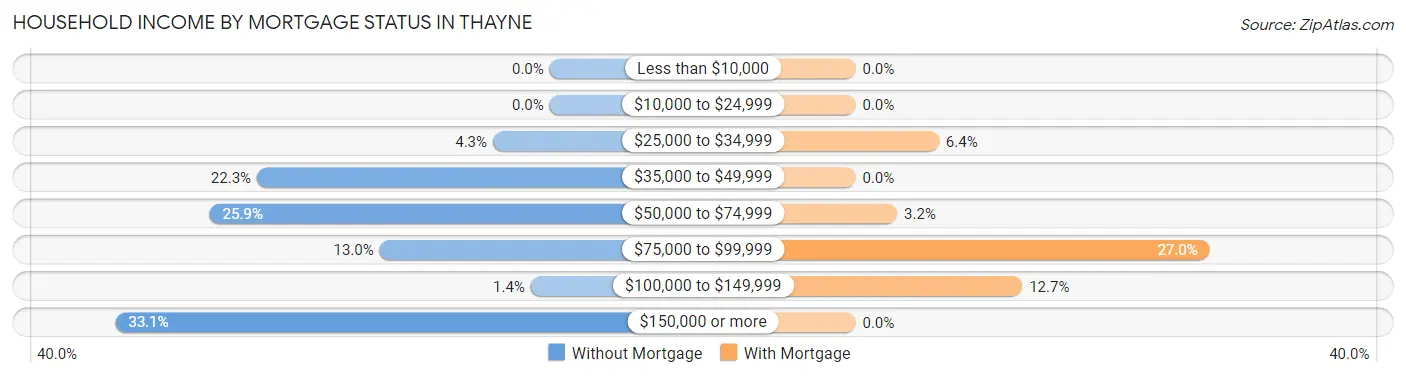
| Household Income | Without Mortgage | With Mortgage |
| Less than $10,000 | 0 (0.0%) | 0 (0.0%) |
| $10,000 to $24,999 | 0 (0.0%) | 0 (0.0%) |
| $25,000 to $34,999 | 6 (4.3%) | 4 (6.4%) |
| $35,000 to $49,999 | 31 (22.3%) | 0 (0.0%) |
| $50,000 to $74,999 | 36 (25.9%) | 2 (3.2%) |
| $75,000 to $99,999 | 18 (13.0%) | 17 (27.0%) |
| $100,000 to $149,999 | 2 (1.4%) | 8 (12.7%) |
| $150,000 or more | 46 (33.1%) | 0 (0.0%) |
| Total | 139 (100.0%) | 63 (100.0%) |
Property Value to Household Income Ratio in Thayne
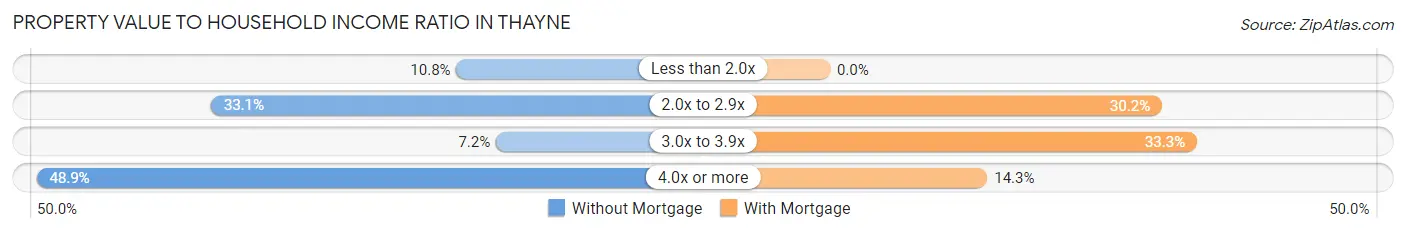
| Value-to-Income Ratio | Without Mortgage | With Mortgage |
| Less than 2.0x | 15 (10.8%) | 0 (0.0%) |
| 2.0x to 2.9x | 46 (33.1%) | 19 (30.2%) |
| 3.0x to 3.9x | 10 (7.2%) | 21 (33.3%) |
| 4.0x or more | 68 (48.9%) | 9 (14.3%) |
| Total | 139 (100.0%) | 63 (100.0%) |
Real Estate Taxes by Mortgage Status in Thayne
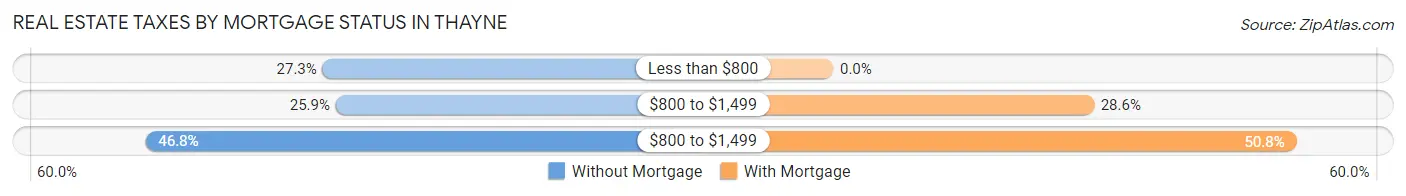
| Property Taxes | Without Mortgage | With Mortgage |
| Less than $800 | 38 (27.3%) | 0 (0.0%) |
| $800 to $1,499 | 36 (25.9%) | 18 (28.6%) |
| $800 to $1,499 | 65 (46.8%) | 32 (50.8%) |
| Total | 139 (100.0%) | 63 (100.0%) |
Health & Disability in Thayne
Health Insurance Coverage by Age in Thayne
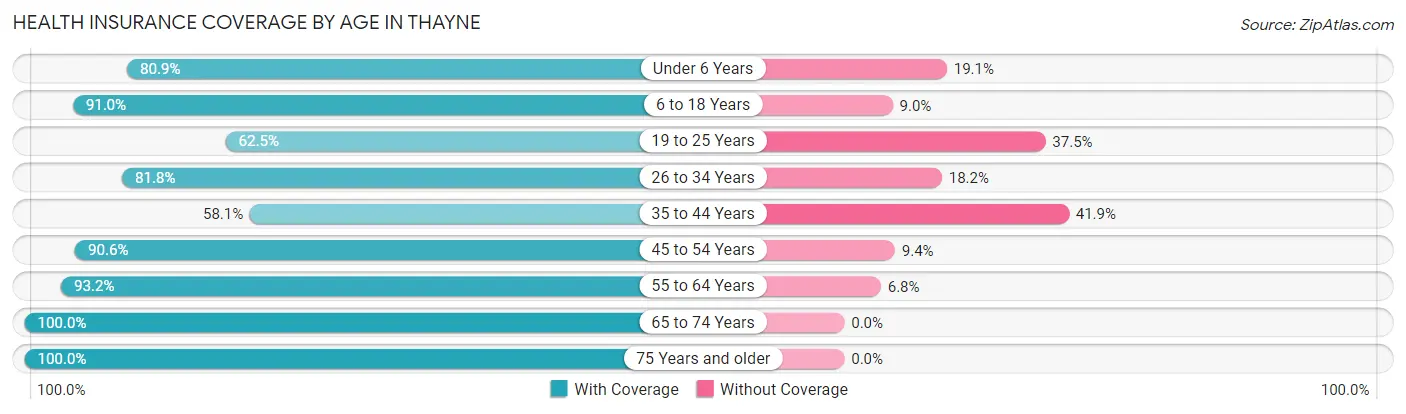
| Age Bracket | With Coverage | Without Coverage |
| Under 6 Years | 55 (80.9%) | 13 (19.1%) |
| 6 to 18 Years | 101 (91.0%) | 10 (9.0%) |
| 19 to 25 Years | 5 (62.5%) | 3 (37.5%) |
| 26 to 34 Years | 63 (81.8%) | 14 (18.2%) |
| 35 to 44 Years | 25 (58.1%) | 18 (41.9%) |
| 45 to 54 Years | 48 (90.6%) | 5 (9.4%) |
| 55 to 64 Years | 96 (93.2%) | 7 (6.8%) |
| 65 to 74 Years | 160 (100.0%) | 0 (0.0%) |
| 75 Years and older | 33 (100.0%) | 0 (0.0%) |
| Total | 586 (89.3%) | 70 (10.7%) |
Health Insurance Coverage by Citizenship Status in Thayne
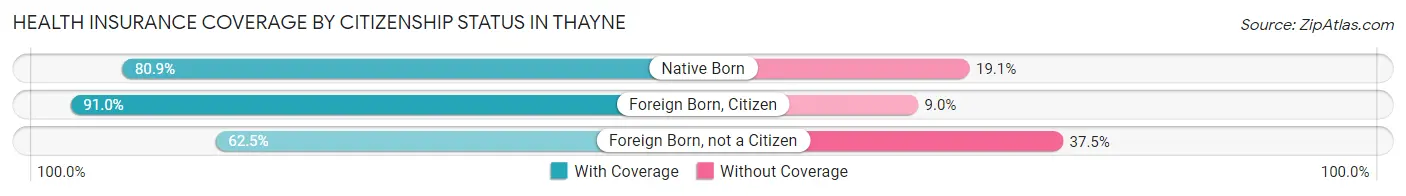
| Citizenship Status | With Coverage | Without Coverage |
| Native Born | 55 (80.9%) | 13 (19.1%) |
| Foreign Born, Citizen | 101 (91.0%) | 10 (9.0%) |
| Foreign Born, not a Citizen | 5 (62.5%) | 3 (37.5%) |
Health Insurance Coverage by Household Income in Thayne
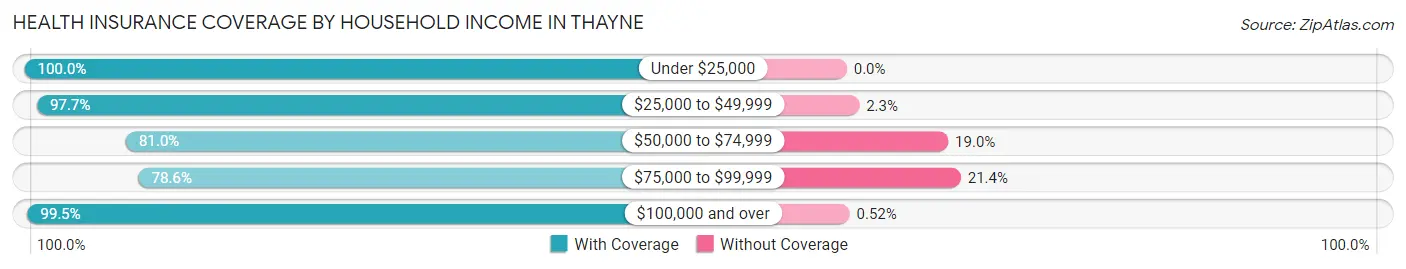
| Household Income | With Coverage | Without Coverage |
| Under $25,000 | 36 (100.0%) | 0 (0.0%) |
| $25,000 to $49,999 | 84 (97.7%) | 2 (2.3%) |
| $50,000 to $74,999 | 192 (81.0%) | 45 (19.0%) |
| $75,000 to $99,999 | 81 (78.6%) | 22 (21.4%) |
| $100,000 and over | 191 (99.5%) | 1 (0.5%) |
Public vs Private Health Insurance Coverage by Age in Thayne
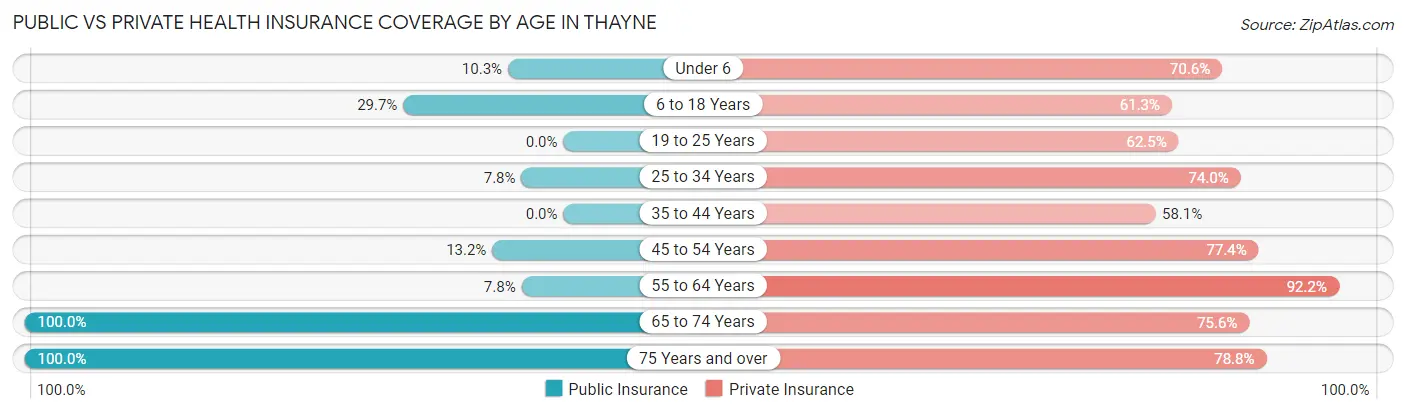
| Age Bracket | Public Insurance | Private Insurance |
| Under 6 | 7 (10.3%) | 48 (70.6%) |
| 6 to 18 Years | 33 (29.7%) | 68 (61.3%) |
| 19 to 25 Years | 0 (0.0%) | 5 (62.5%) |
| 25 to 34 Years | 6 (7.8%) | 57 (74.0%) |
| 35 to 44 Years | 0 (0.0%) | 25 (58.1%) |
| 45 to 54 Years | 7 (13.2%) | 41 (77.4%) |
| 55 to 64 Years | 8 (7.8%) | 95 (92.2%) |
| 65 to 74 Years | 160 (100.0%) | 121 (75.6%) |
| 75 Years and over | 33 (100.0%) | 26 (78.8%) |
| Total | 254 (38.7%) | 486 (74.1%) |
Disability Status by Sex by Age in Thayne
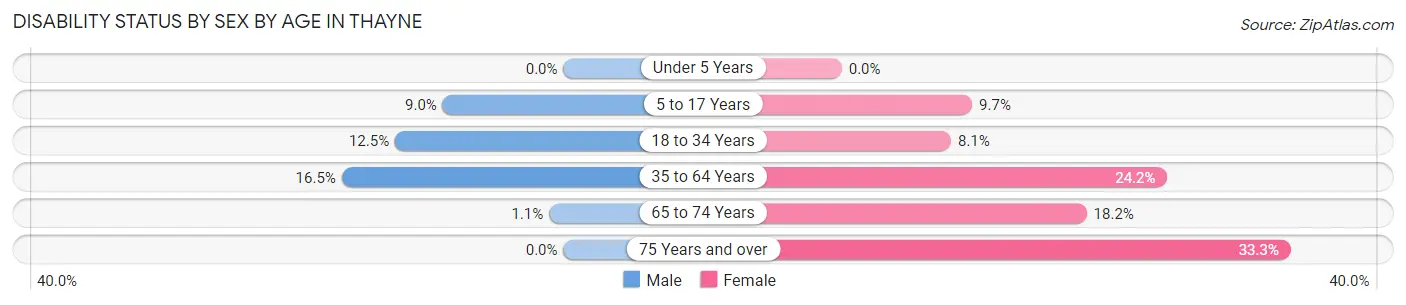
| Age Bracket | Male | Female |
| Under 5 Years | 0 (0.0%) | 0 (0.0%) |
| 5 to 17 Years | 6 (9.0%) | 6 (9.7%) |
| 18 to 34 Years | 6 (12.5%) | 3 (8.1%) |
| 35 to 64 Years | 13 (16.5%) | 29 (24.2%) |
| 65 to 74 Years | 1 (1.1%) | 12 (18.2%) |
| 75 Years and over | 0 (0.0%) | 7 (33.3%) |
Disability Class by Sex by Age in Thayne
Disability Class: Hearing Difficulty
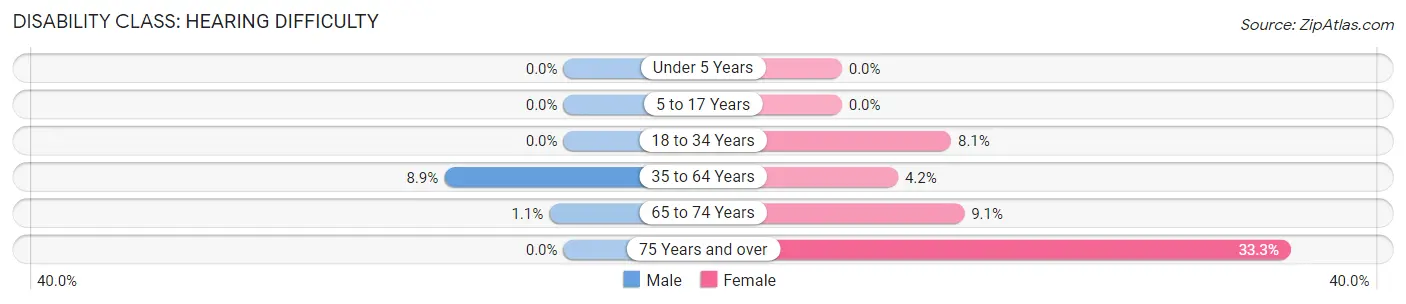
| Age Bracket | Male | Female |
| Under 5 Years | 0 (0.0%) | 0 (0.0%) |
| 5 to 17 Years | 0 (0.0%) | 0 (0.0%) |
| 18 to 34 Years | 0 (0.0%) | 3 (8.1%) |
| 35 to 64 Years | 7 (8.9%) | 5 (4.2%) |
| 65 to 74 Years | 1 (1.1%) | 6 (9.1%) |
| 75 Years and over | 0 (0.0%) | 7 (33.3%) |
Disability Class: Vision Difficulty
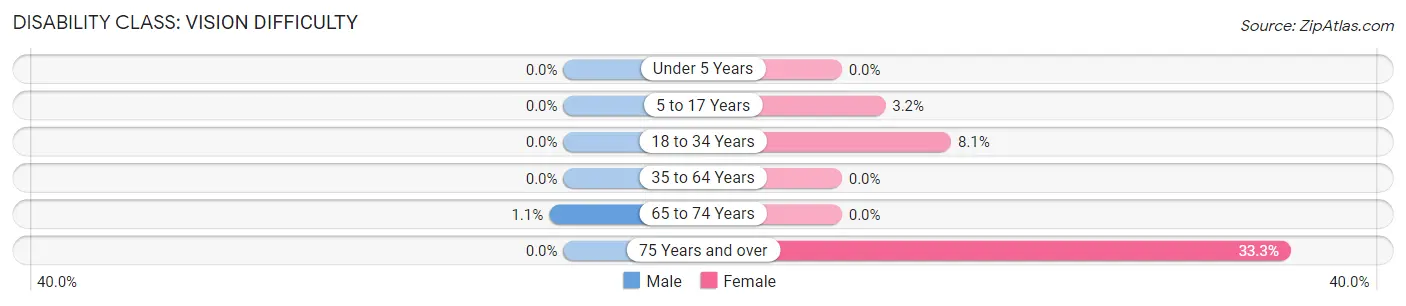
| Age Bracket | Male | Female |
| Under 5 Years | 0 (0.0%) | 0 (0.0%) |
| 5 to 17 Years | 0 (0.0%) | 2 (3.2%) |
| 18 to 34 Years | 0 (0.0%) | 3 (8.1%) |
| 35 to 64 Years | 0 (0.0%) | 0 (0.0%) |
| 65 to 74 Years | 1 (1.1%) | 0 (0.0%) |
| 75 Years and over | 0 (0.0%) | 7 (33.3%) |
Disability Class: Cognitive Difficulty
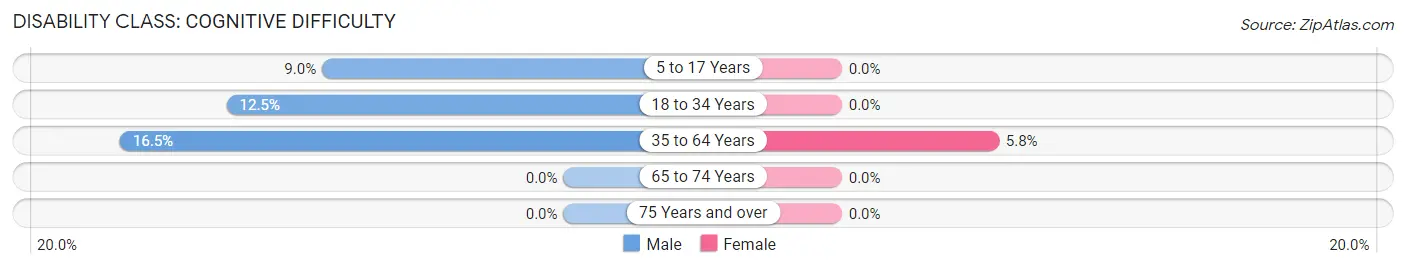
| Age Bracket | Male | Female |
| 5 to 17 Years | 6 (9.0%) | 0 (0.0%) |
| 18 to 34 Years | 6 (12.5%) | 0 (0.0%) |
| 35 to 64 Years | 13 (16.5%) | 7 (5.8%) |
| 65 to 74 Years | 0 (0.0%) | 0 (0.0%) |
| 75 Years and over | 0 (0.0%) | 0 (0.0%) |
Disability Class: Ambulatory Difficulty
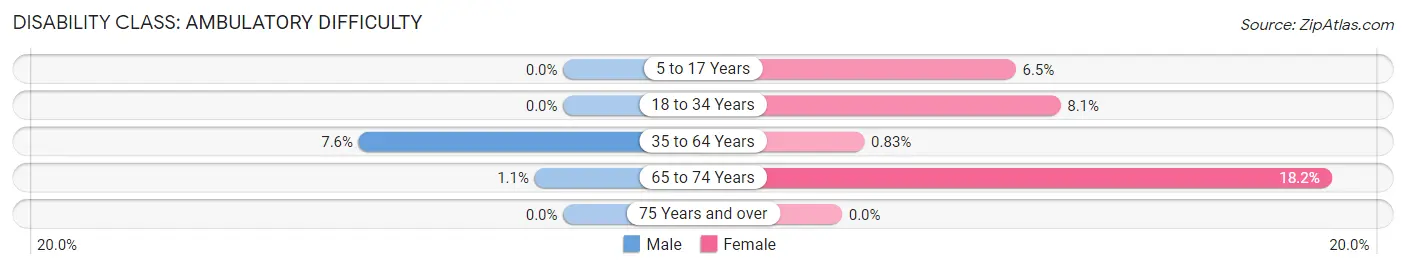
| Age Bracket | Male | Female |
| 5 to 17 Years | 0 (0.0%) | 4 (6.5%) |
| 18 to 34 Years | 0 (0.0%) | 3 (8.1%) |
| 35 to 64 Years | 6 (7.6%) | 1 (0.8%) |
| 65 to 74 Years | 1 (1.1%) | 12 (18.2%) |
| 75 Years and over | 0 (0.0%) | 0 (0.0%) |
Disability Class: Self-Care Difficulty
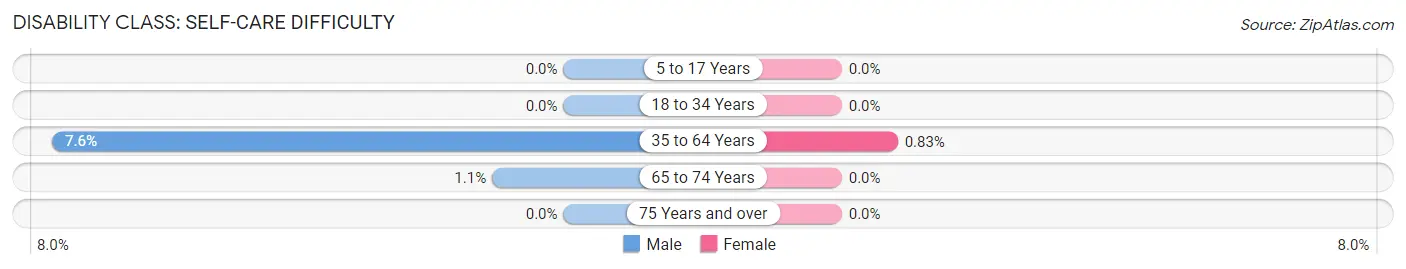
| Age Bracket | Male | Female |
| 5 to 17 Years | 0 (0.0%) | 0 (0.0%) |
| 18 to 34 Years | 0 (0.0%) | 0 (0.0%) |
| 35 to 64 Years | 6 (7.6%) | 1 (0.8%) |
| 65 to 74 Years | 1 (1.1%) | 0 (0.0%) |
| 75 Years and over | 0 (0.0%) | 0 (0.0%) |
Technology Access in Thayne
Computing Device Access in Thayne
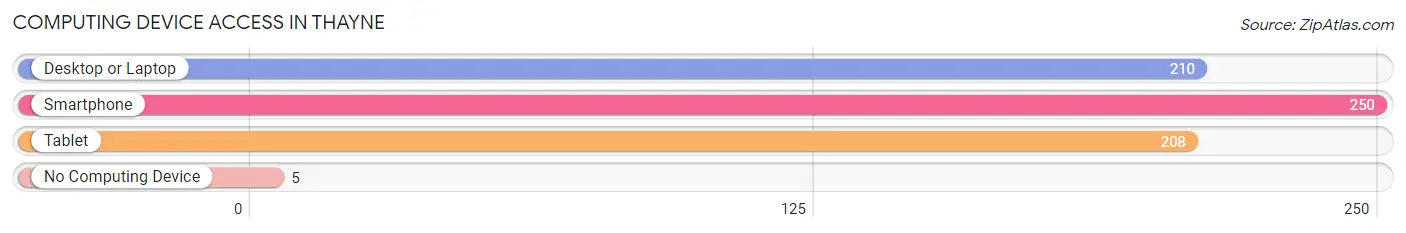
| Device Type | # Households | % Households |
| Desktop or Laptop | 210 | 79.8% |
| Smartphone | 250 | 95.1% |
| Tablet | 208 | 79.1% |
| No Computing Device | 5 | 1.9% |
| Total | 263 | 100.0% |
Internet Access in Thayne
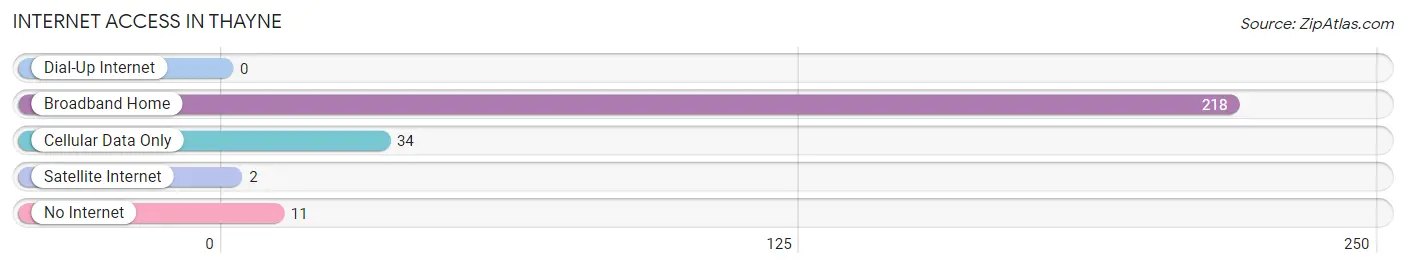
| Internet Type | # Households | % Households |
| Dial-Up Internet | 0 | 0.0% |
| Broadband Home | 218 | 82.9% |
| Cellular Data Only | 34 | 12.9% |
| Satellite Internet | 2 | 0.8% |
| No Internet | 11 | 4.2% |
| Total | 263 | 100.0% |
Thayne Summary
Thayne, Wyoming is a small town located in the southwestern corner of the state, near the Utah border. It is the county seat of Lincoln County and is home to approximately 500 people. The town was founded in 1884 and has a rich history of ranching, farming, and mining.
Geography
Thayne is located in the Star Valley, a narrow valley in the Rocky Mountains. The valley is surrounded by the Salt River Range to the east, the Wyoming Range to the west, and the Snake River Range to the south. The town is situated at an elevation of 6,000 feet and is located at the intersection of U.S. Highway 89 and Wyoming Highway 89.
The climate in Thayne is semi-arid, with hot summers and cold winters. The average annual temperature is 44 degrees Fahrenheit, with an average high of 68 degrees in the summer and an average low of 20 degrees in the winter. The average annual precipitation is 12.5 inches, with most of it falling in the form of snow.
Economy
The economy of Thayne is largely based on agriculture and ranching. The town is home to several large ranches, including the Star Valley Ranch, which is one of the largest in the state. The ranching industry is supported by the local feed store, which provides feed and supplies to ranchers in the area.
In addition to ranching, Thayne is home to several small businesses, including a grocery store, a hardware store, and a restaurant. The town also has a small manufacturing sector, which produces a variety of products, including furniture, clothing, and leather goods.
Demographics
As of the 2010 census, the population of Thayne was 498. The racial makeup of the town was 97.2% White, 0.2% African American, 0.4% Native American, 0.2% Asian, 0.2% Pacific Islander, 0.8% from other races, and 1.2% from two or more races. Hispanic or Latino of any race were 2.2% of the population.
The median household income in Thayne was $41,250, and the median family income was $45,833. The per capita income for the town was $19,945. About 11.2% of families and 13.2% of the population were below the poverty line, including 16.7% of those under age 18 and 8.3% of those age 65 or over.
Conclusion
Thayne, Wyoming is a small town with a rich history and a vibrant economy. The town is home to several large ranches and small businesses, and the population is largely white. The town has a semi-arid climate and is located at an elevation of 6,000 feet. The median household income in Thayne is $41,250, and the per capita income is $19,945.
Common Questions
What is Per Capita Income in Thayne?
Per Capita income in Thayne is $37,207.
What is the Median Family Income in Thayne?
Median Family Income in Thayne is $74,821.
What is the Median Household income in Thayne?
Median Household Income in Thayne is $73,036.
What is Inequality or Gini Index in Thayne?
Inequality or Gini Index in Thayne is 0.35.
What is the Total Population of Thayne?
Total Population of Thayne is 656.
What is the Total Male Population of Thayne?
Total Male Population of Thayne is 332.
What is the Total Female Population of Thayne?
Total Female Population of Thayne is 324.
What is the Ratio of Males per 100 Females in Thayne?
There are 102.47 Males per 100 Females in Thayne.
What is the Ratio of Females per 100 Males in Thayne?
There are 97.59 Females per 100 Males in Thayne.
What is the Median Population Age in Thayne?
Median Population Age in Thayne is 47.0 Years.
What is the Average Family Size in Thayne
Average Family Size in Thayne is 2.7 People.
What is the Average Household Size in Thayne
Average Household Size in Thayne is 2.5 People.
How Large is the Labor Force in Thayne?
There are 302 People in the Labor Forcein in Thayne.
What is the Percentage of People in the Labor Force in Thayne?
61.0% of People are in the Labor Force in Thayne.