Casper Mountain, WY Map & Demographics
Casper Mountain Map
Casper Mountain Overview
$58,020
PER CAPITA INCOME
$185,172
AVG FAMILY INCOME
$140,556
AVG HOUSEHOLD INCOME
0.42
INEQUALITY / GINI INDEX
671
TOTAL POPULATION
349
MALE POPULATION
322
FEMALE POPULATION
108.39
MALES / 100 FEMALES
92.26
FEMALES / 100 MALES
45.2
MEDIAN AGE
3.5
AVG FAMILY SIZE
2.8
AVG HOUSEHOLD SIZE
320
LABOR FORCE [ PEOPLE ]
65.3%
PERCENT IN LABOR FORCE
Income in Casper Mountain
Income Overview in Casper Mountain
Per Capita Income in Casper Mountain is $58,020, while median incomes of families and households are $185,172 and $140,556 respectively.
| Characteristic | Number | Measure |
| Per Capita Income | 671 | $58,020 |
| Median Family Income | 164 | $185,172 |
| Mean Family Income | 164 | $199,180 |
| Median Household Income | 240 | $140,556 |
| Mean Household Income | 240 | $161,057 |
| Income Deficit | 164 | $0 |
| Wage / Income Gap (%) | 671 | 0.00% |
| Wage / Income Gap ($) | 671 | 100.00¢ per $1 |
| Gini / Inequality Index | 671 | 0.42 |
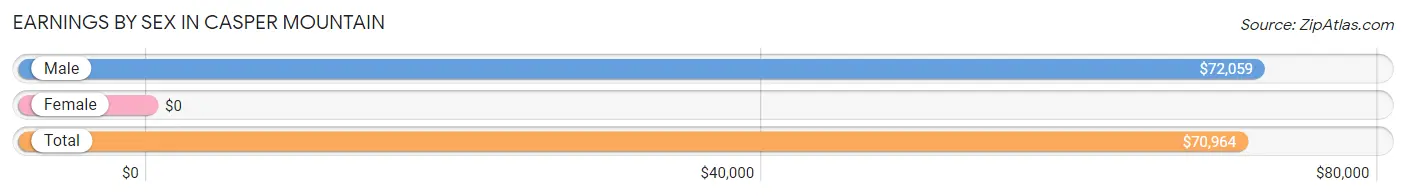
Earnings by Sex in Casper Mountain
| Sex | Number | Average Earnings |
| Male | 238 (60.6%) | $72,059 |
| Female | 155 (39.4%) | $0 |
| Total | 393 (100.0%) | $70,964 |
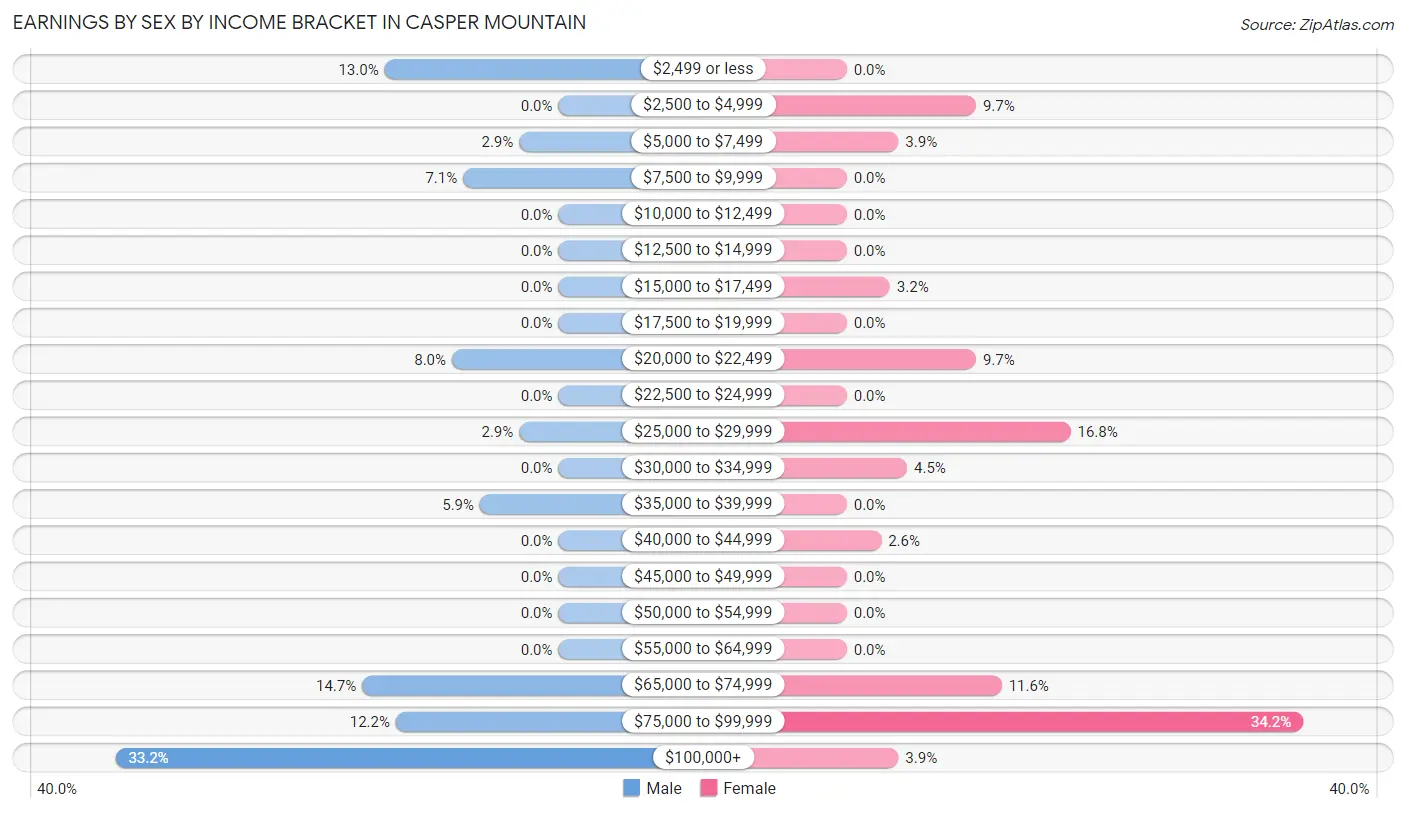
Earnings by Sex by Income Bracket in Casper Mountain
The most common earnings brackets in Casper Mountain are $100,000+ for men (79 | 33.2%) and $75,000 to $99,999 for women (53 | 34.2%).
| Income | Male | Female |
| $2,499 or less | 31 (13.0%) | 0 (0.0%) |
| $2,500 to $4,999 | 0 (0.0%) | 15 (9.7%) |
| $5,000 to $7,499 | 7 (2.9%) | 6 (3.9%) |
| $7,500 to $9,999 | 17 (7.1%) | 0 (0.0%) |
| $10,000 to $12,499 | 0 (0.0%) | 0 (0.0%) |
| $12,500 to $14,999 | 0 (0.0%) | 0 (0.0%) |
| $15,000 to $17,499 | 0 (0.0%) | 5 (3.2%) |
| $17,500 to $19,999 | 0 (0.0%) | 0 (0.0%) |
| $20,000 to $22,499 | 19 (8.0%) | 15 (9.7%) |
| $22,500 to $24,999 | 0 (0.0%) | 0 (0.0%) |
| $25,000 to $29,999 | 7 (2.9%) | 26 (16.8%) |
| $30,000 to $34,999 | 0 (0.0%) | 7 (4.5%) |
| $35,000 to $39,999 | 14 (5.9%) | 0 (0.0%) |
| $40,000 to $44,999 | 0 (0.0%) | 4 (2.6%) |
| $45,000 to $49,999 | 0 (0.0%) | 0 (0.0%) |
| $50,000 to $54,999 | 0 (0.0%) | 0 (0.0%) |
| $55,000 to $64,999 | 0 (0.0%) | 0 (0.0%) |
| $65,000 to $74,999 | 35 (14.7%) | 18 (11.6%) |
| $75,000 to $99,999 | 29 (12.2%) | 53 (34.2%) |
| $100,000+ | 79 (33.2%) | 6 (3.9%) |
| Total | 238 (100.0%) | 155 (100.0%) |
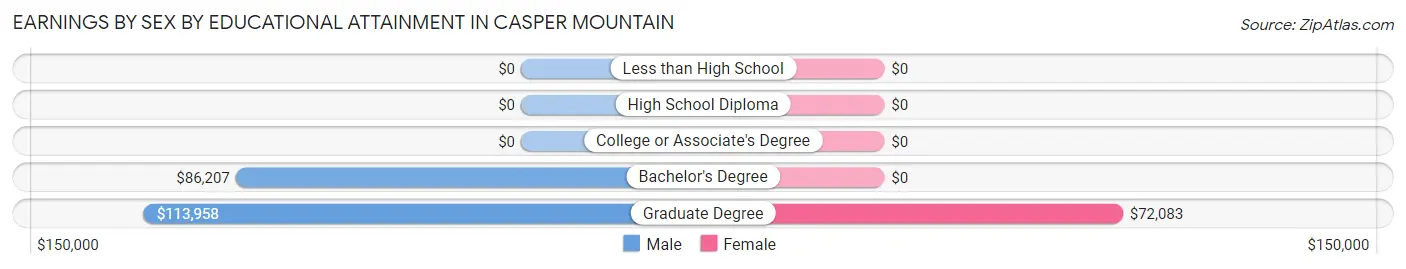
Earnings by Sex by Educational Attainment in Casper Mountain
Average earnings in Casper Mountain are $86,034 for men and $85,189 for women, a difference of 1.0%. Men with an educational attainment of graduate degree enjoy the highest average annual earnings of $113,958, while those with bachelor's degree education earn the least with $86,207. Women with an educational attainment of graduate degree earn the most with the average annual earnings of $72,083, while those with graduate degree education have the smallest earnings of $72,083.
| Educational Attainment | Male Income | Female Income |
| Less than High School | - | - |
| High School Diploma | - | - |
| College or Associate's Degree | - | - |
| Bachelor's Degree | $86,207 | $0 |
| Graduate Degree | $113,958 | $72,083 |
| Total | $86,034 | $85,189 |
Family Income in Casper Mountain
Family Income Brackets in Casper Mountain
According to the Casper Mountain family income data, there are 55 families falling into the $200,000+ income range, which is the most common income bracket and makes up 33.5% of all families.
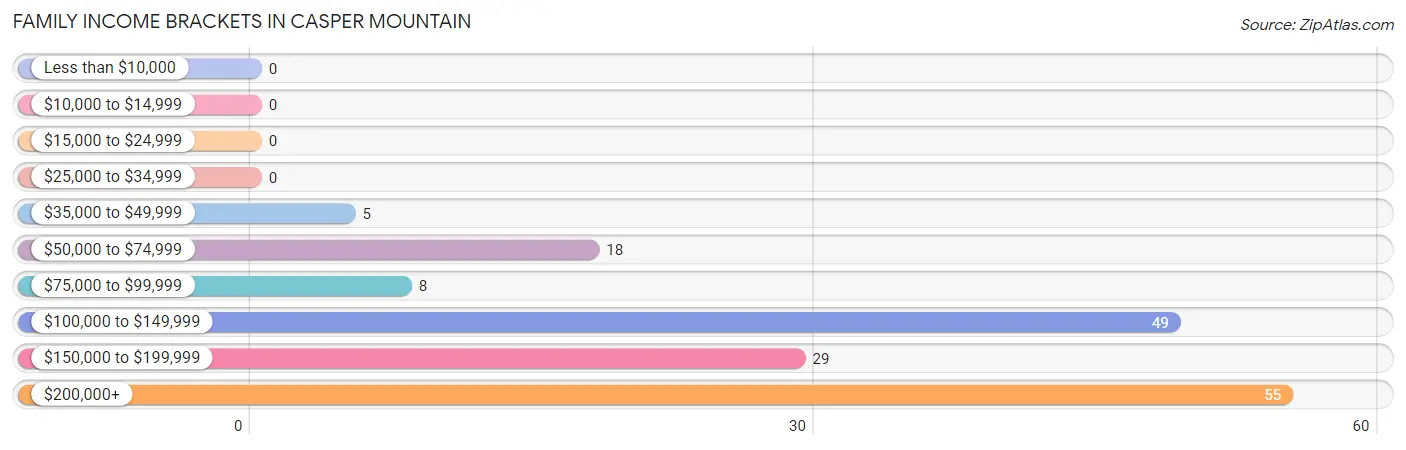
| Income Bracket | # Families | % Families |
| Less than $10,000 | 0 | 0.0% |
| $10,000 to $14,999 | 0 | 0.0% |
| $15,000 to $24,999 | 0 | 0.0% |
| $25,000 to $34,999 | 0 | 0.0% |
| $35,000 to $49,999 | 5 | 3.0% |
| $50,000 to $74,999 | 18 | 11.0% |
| $75,000 to $99,999 | 8 | 4.9% |
| $100,000 to $149,999 | 49 | 29.9% |
| $150,000 to $199,999 | 29 | 17.7% |
| $200,000+ | 55 | 33.5% |
Family Income by Famaliy Size in Casper Mountain
2-person families (120 | 73.2%) account for the highest median family income in Casper Mountain with $129,286 per family, while 2-person families (120 | 73.2%) have the highest median income of $64,643 per family member.
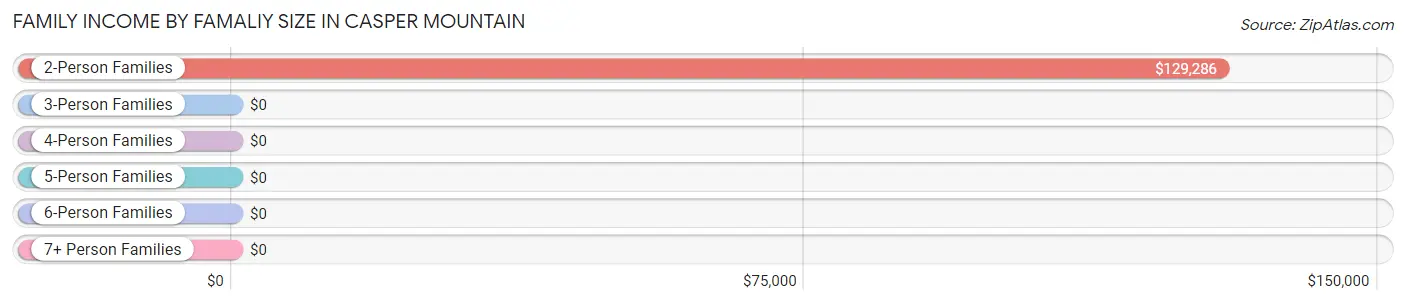
| Income Bracket | # Families | Median Income |
| 2-Person Families | 120 (73.2%) | $129,286 |
| 3-Person Families | 14 (8.5%) | $0 |
| 4-Person Families | 6 (3.7%) | $0 |
| 5-Person Families | 0 (0.0%) | $0 |
| 6-Person Families | 10 (6.1%) | $0 |
| 7+ Person Families | 14 (8.5%) | $0 |
| Total | 164 (100.0%) | $185,172 |
Family Income by Number of Earners in Casper Mountain
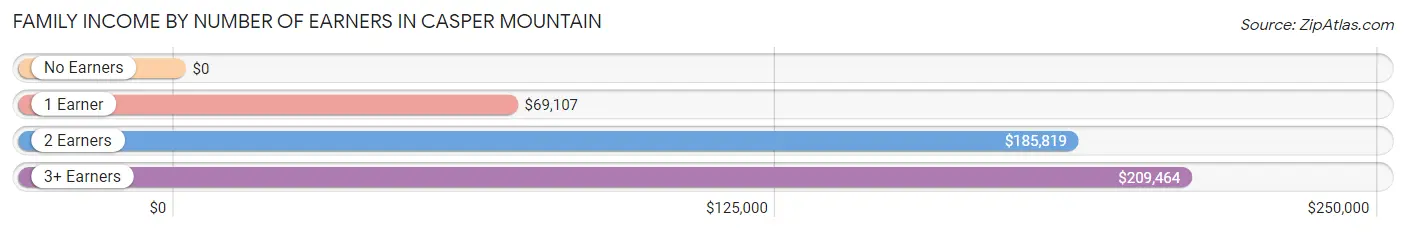
| Number of Earners | # Families | Median Income |
| No Earners | 8 (4.9%) | $0 |
| 1 Earner | 41 (25.0%) | $69,107 |
| 2 Earners | 81 (49.4%) | $185,819 |
| 3+ Earners | 34 (20.7%) | $209,464 |
| Total | 164 (100.0%) | $185,172 |
Household Income in Casper Mountain
Household Income Brackets in Casper Mountain
With 55 households falling in the category, the $200,000+ income range is the most frequent in Casper Mountain, accounting for 22.9% of all households.
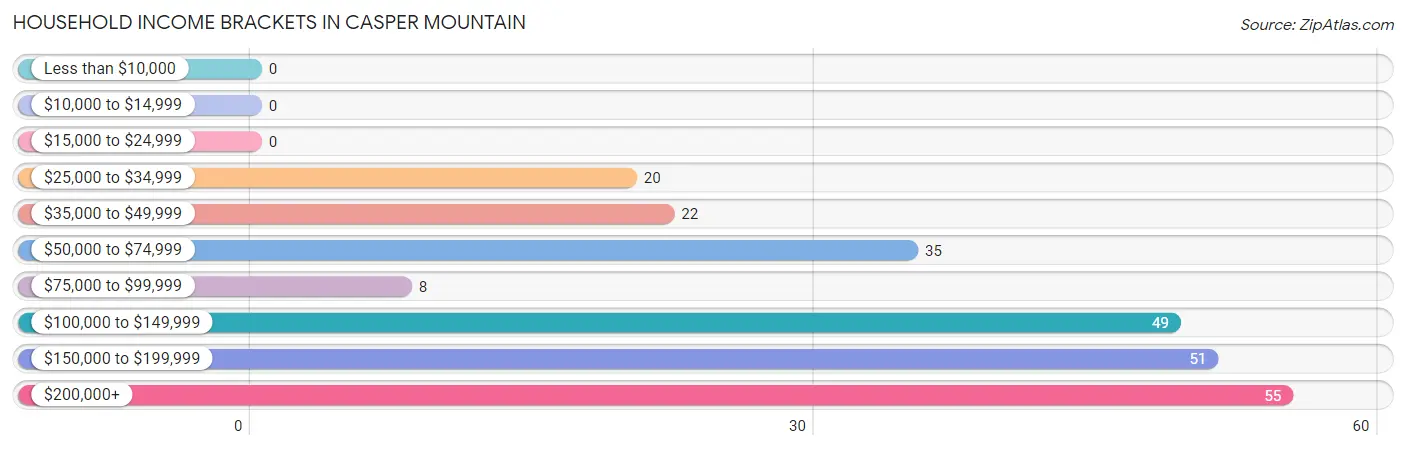
| Income Bracket | # Households | % Households |
| Less than $10,000 | 0 | 0.0% |
| $10,000 to $14,999 | 0 | 0.0% |
| $15,000 to $24,999 | 0 | 0.0% |
| $25,000 to $34,999 | 20 | 8.3% |
| $35,000 to $49,999 | 22 | 9.2% |
| $50,000 to $74,999 | 35 | 14.6% |
| $75,000 to $99,999 | 8 | 3.3% |
| $100,000 to $149,999 | 49 | 20.4% |
| $150,000 to $199,999 | 51 | 21.3% |
| $200,000+ | 55 | 22.9% |
Household Income by Householder Age in Casper Mountain
The median household income in Casper Mountain is $140,556, with the highest median household income of $185,345 found in the 45 to 64 years age bracket for the primary householder. A total of 120 households (50.0%) fall into this category.
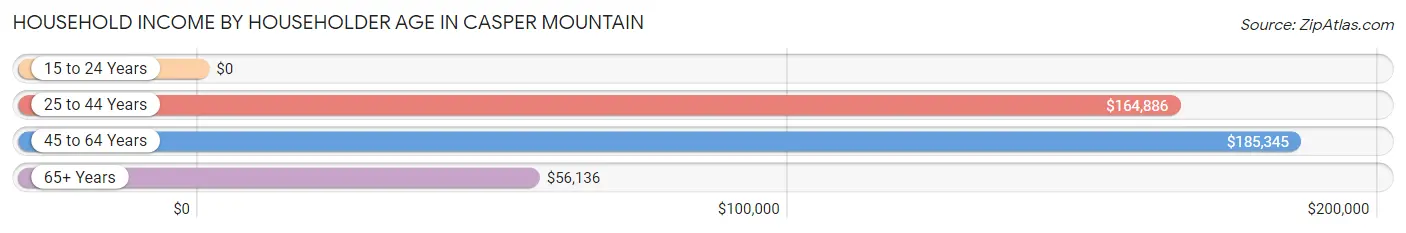
| Income Bracket | # Households | Median Income |
| 15 to 24 Years | 0 (0.0%) | $0 |
| 25 to 44 Years | 42 (17.5%) | $164,886 |
| 45 to 64 Years | 120 (50.0%) | $185,345 |
| 65+ Years | 78 (32.5%) | $56,136 |
| Total | 240 (100.0%) | $140,556 |
Poverty in Casper Mountain
Income Below Poverty by Sex and Age in Casper Mountain
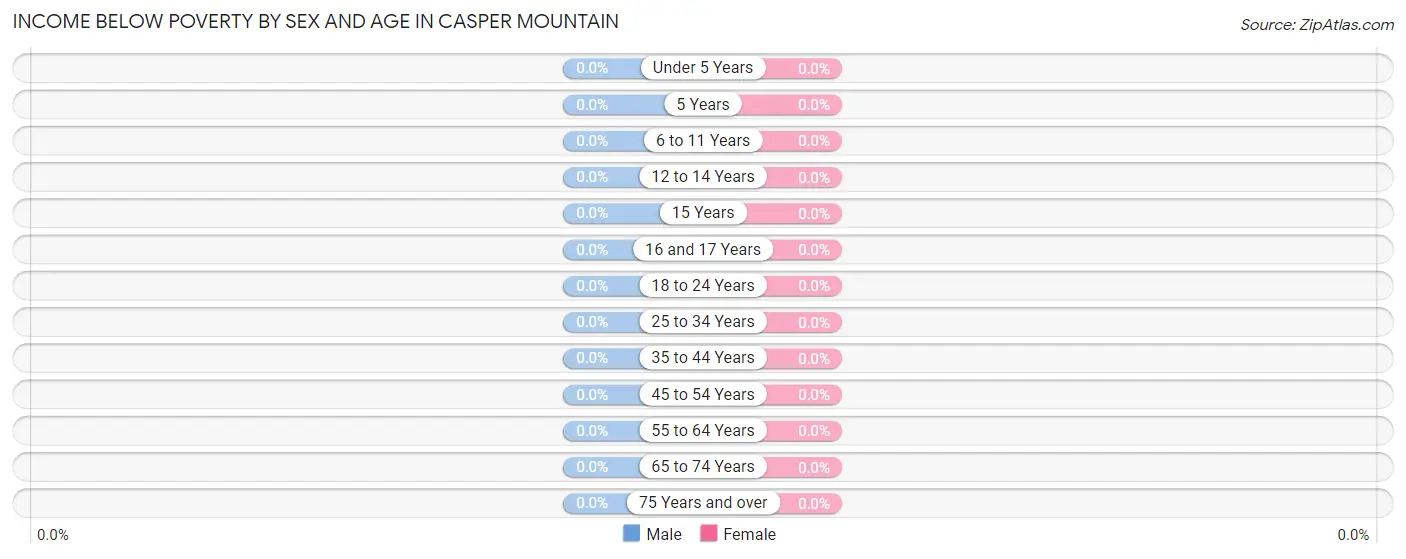
| Age Bracket | Male | Female |
| Under 5 Years | 0 (0.0%) | 0 (0.0%) |
| 5 Years | 0 (0.0%) | 0 (0.0%) |
| 6 to 11 Years | 0 (0.0%) | 0 (0.0%) |
| 12 to 14 Years | 0 (0.0%) | 0 (0.0%) |
| 15 Years | 0 (0.0%) | 0 (0.0%) |
| 16 and 17 Years | 0 (0.0%) | 0 (0.0%) |
| 18 to 24 Years | 0 (0.0%) | 0 (0.0%) |
| 25 to 34 Years | 0 (0.0%) | 0 (0.0%) |
| 35 to 44 Years | 0 (0.0%) | 0 (0.0%) |
| 45 to 54 Years | 0 (0.0%) | 0 (0.0%) |
| 55 to 64 Years | 0 (0.0%) | 0 (0.0%) |
| 65 to 74 Years | 0 (0.0%) | 0 (0.0%) |
| 75 Years and over | 0 (0.0%) | 0 (0.0%) |
| Total | 0 (0.0%) | 0 (0.0%) |
Income Above Poverty by Sex and Age in Casper Mountain
According to the poverty statistics in Casper Mountain, males aged 6 to 11 years and females aged 6 to 11 years are the age groups that are most secure financially, with 100.0% of males and 100.0% of females in these age groups living above the poverty line.
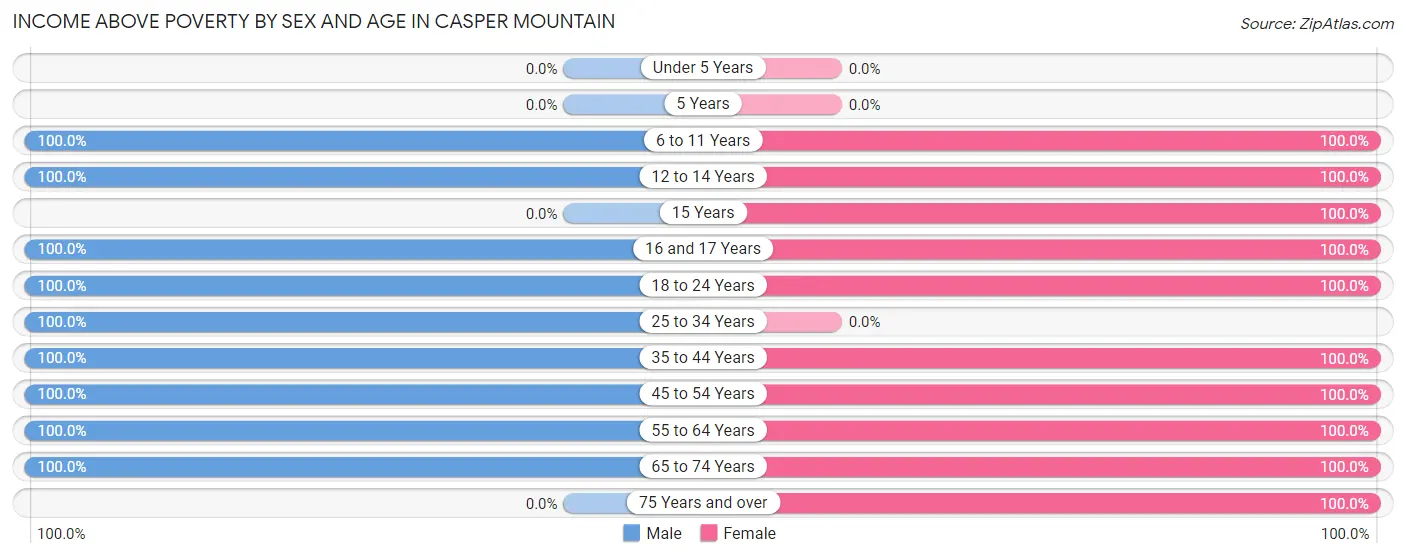
| Age Bracket | Male | Female |
| Under 5 Years | 0 (0.0%) | 0 (0.0%) |
| 5 Years | 0 (0.0%) | 0 (0.0%) |
| 6 to 11 Years | 27 (100.0%) | 28 (100.0%) |
| 12 to 14 Years | 49 (100.0%) | 36 (100.0%) |
| 15 Years | 0 (0.0%) | 19 (100.0%) |
| 16 and 17 Years | 39 (100.0%) | 15 (100.0%) |
| 18 to 24 Years | 7 (100.0%) | 27 (100.0%) |
| 25 to 34 Years | 22 (100.0%) | 0 (0.0%) |
| 35 to 44 Years | 23 (100.0%) | 20 (100.0%) |
| 45 to 54 Years | 73 (100.0%) | 75 (100.0%) |
| 55 to 64 Years | 36 (100.0%) | 38 (100.0%) |
| 65 to 74 Years | 51 (100.0%) | 58 (100.0%) |
| 75 Years and over | 0 (0.0%) | 6 (100.0%) |
| Total | 327 (100.0%) | 322 (100.0%) |
Income Below Poverty Among Married-Couple Families in Casper Mountain
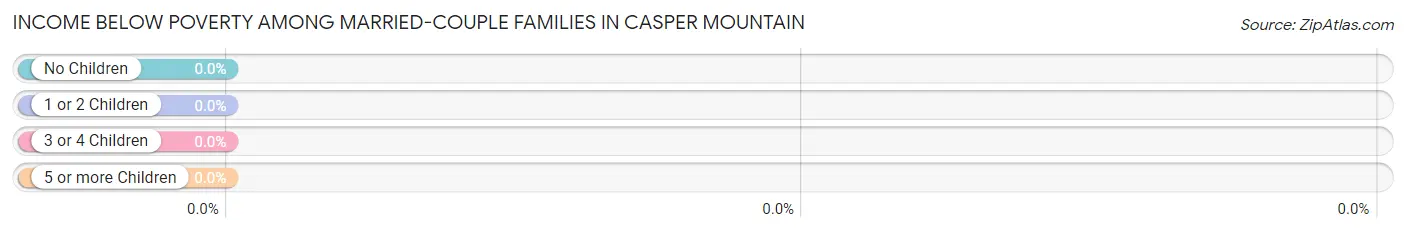
| Children | Above Poverty | Below Poverty |
| No Children | 126 (100.0%) | 0 (0.0%) |
| 1 or 2 Children | 14 (100.0%) | 0 (0.0%) |
| 3 or 4 Children | 10 (100.0%) | 0 (0.0%) |
| 5 or more Children | 14 (100.0%) | 0 (0.0%) |
| Total | 164 (100.0%) | 0 (0.0%) |
Income Below Poverty Among Single-Parent Households in Casper Mountain
| Children | Single Father | Single Mother |
| No Children | 0 (0.0%) | 0 (0.0%) |
| 1 or 2 Children | 0 (0.0%) | 0 (0.0%) |
| 3 or 4 Children | 0 (0.0%) | 0 (0.0%) |
| 5 or more Children | 0 (0.0%) | 0 (0.0%) |
| Total | 0 (0.0%) | 0 (0.0%) |
Income Below Poverty Among Married-Couple vs Single-Parent Households in Casper Mountain
| Children | Married-Couple Families | Single-Parent Households |
| No Children | 0 (0.0%) | 0 (0.0%) |
| 1 or 2 Children | 0 (0.0%) | 0 (0.0%) |
| 3 or 4 Children | 0 (0.0%) | 0 (0.0%) |
| 5 or more Children | 0 (0.0%) | 0 (0.0%) |
| Total | 0 (0.0%) | 0 (0.0%) |
Race in Casper Mountain
The most populous races in Casper Mountain are White / Caucasian (664 | 99.0%), Hispanic or Latino (103 | 15.3%), and Two or more Races (7 | 1.0%).
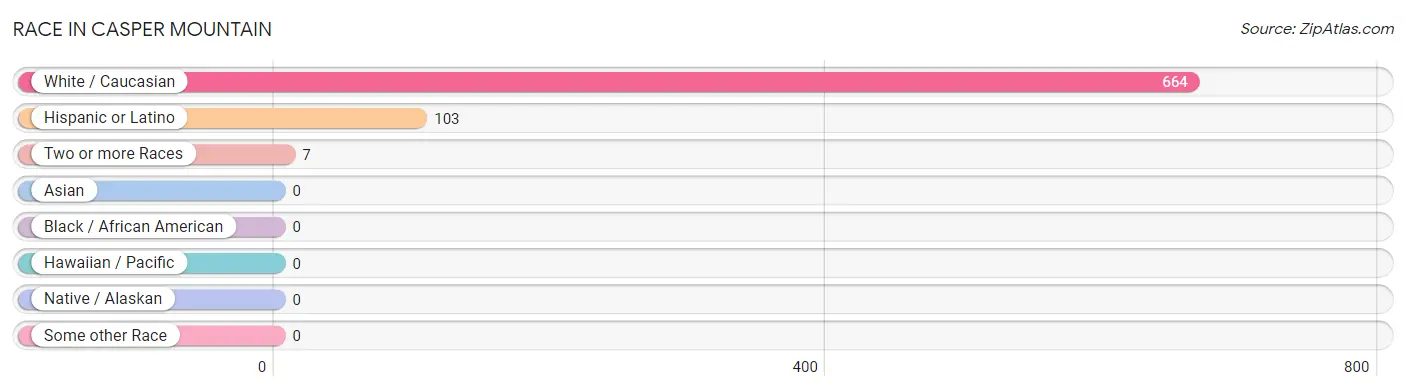
| Race | # Population | % Population |
| Asian | 0 | 0.0% |
| Black / African American | 0 | 0.0% |
| Hawaiian / Pacific | 0 | 0.0% |
| Hispanic or Latino | 103 | 15.3% |
| Native / Alaskan | 0 | 0.0% |
| White / Caucasian | 664 | 99.0% |
| Two or more Races | 7 | 1.0% |
| Some other Race | 0 | 0.0% |
| Total | 671 | 100.0% |
Ancestry in Casper Mountain
The most populous ancestries reported in Casper Mountain are American (85 | 12.7%), English (72 | 10.7%), Mexican (67 | 10.0%), Irish (59 | 8.8%), and Welsh (55 | 8.2%), together accounting for 50.4% of all Casper Mountain residents.
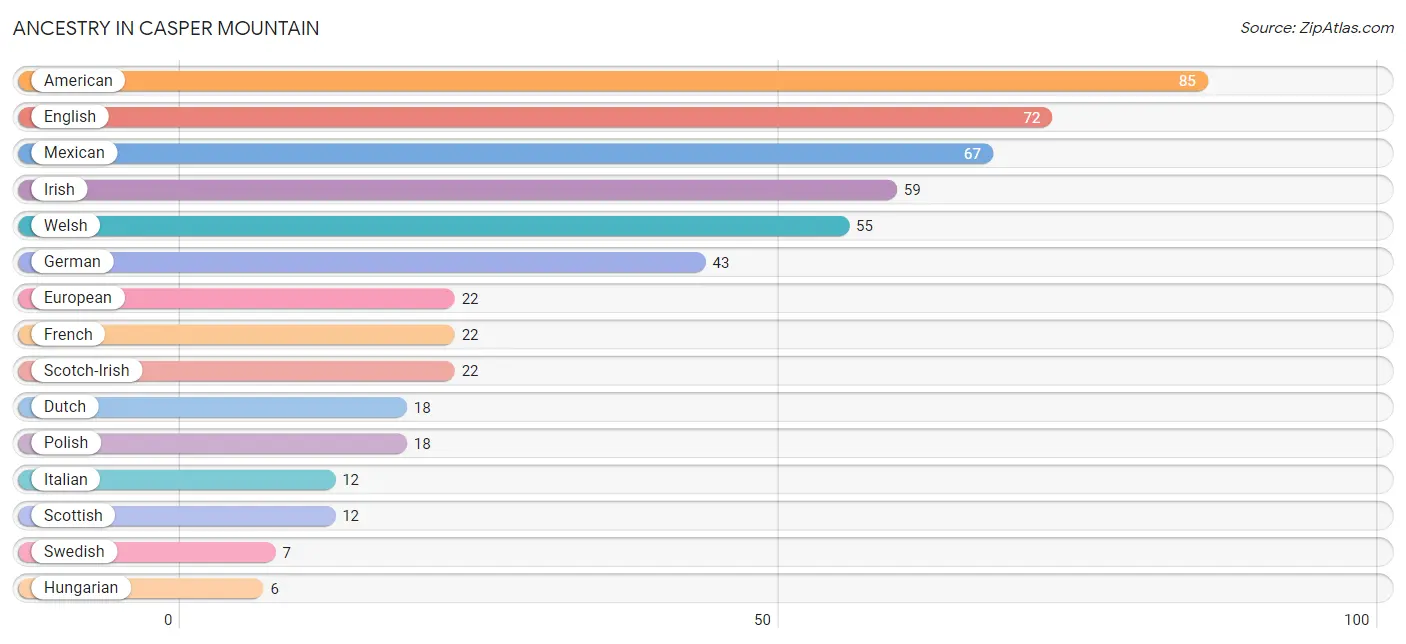
| Ancestry | # Population | % Population |
| American | 85 | 12.7% |
| Dutch | 18 | 2.7% |
| English | 72 | 10.7% |
| European | 22 | 3.3% |
| French | 22 | 3.3% |
| German | 43 | 6.4% |
| Hungarian | 6 | 0.9% |
| Irish | 59 | 8.8% |
| Italian | 12 | 1.8% |
| Mexican | 67 | 10.0% |
| Polish | 18 | 2.7% |
| Scotch-Irish | 22 | 3.3% |
| Scottish | 12 | 1.8% |
| Swedish | 7 | 1.0% |
| Welsh | 55 | 8.2% | View All 15 Rows |
Immigrants in Casper Mountain

| Immigration Origin | # Population | % Population | View All 0 Rows |
Sex and Age in Casper Mountain
Sex and Age in Casper Mountain
The most populous age groups in Casper Mountain are 10 to 14 Years (74 | 21.2%) for men and 45 to 49 Years (59 | 18.3%) for women.
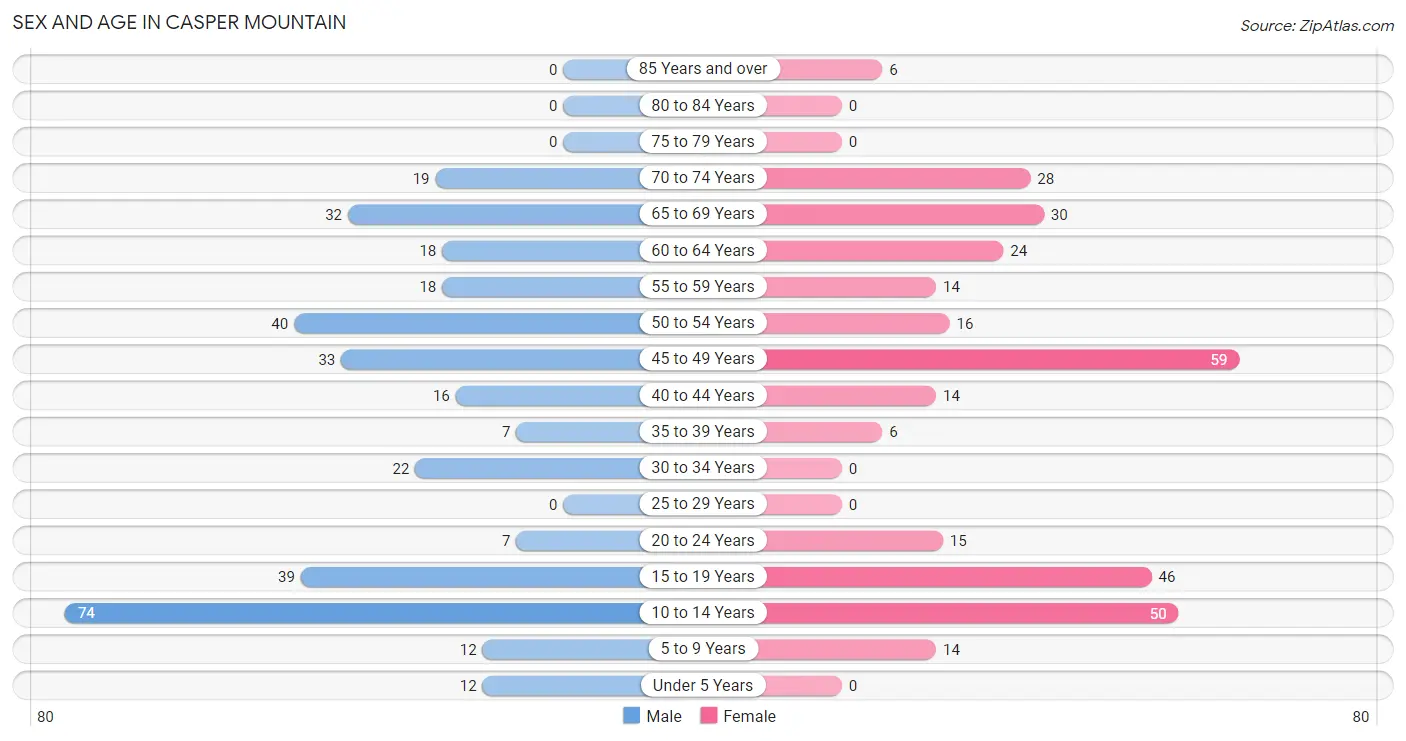
| Age Bracket | Male | Female |
| Under 5 Years | 12 (3.4%) | 0 (0.0%) |
| 5 to 9 Years | 12 (3.4%) | 14 (4.3%) |
| 10 to 14 Years | 74 (21.2%) | 50 (15.5%) |
| 15 to 19 Years | 39 (11.2%) | 46 (14.3%) |
| 20 to 24 Years | 7 (2.0%) | 15 (4.7%) |
| 25 to 29 Years | 0 (0.0%) | 0 (0.0%) |
| 30 to 34 Years | 22 (6.3%) | 0 (0.0%) |
| 35 to 39 Years | 7 (2.0%) | 6 (1.9%) |
| 40 to 44 Years | 16 (4.6%) | 14 (4.3%) |
| 45 to 49 Years | 33 (9.5%) | 59 (18.3%) |
| 50 to 54 Years | 40 (11.5%) | 16 (5.0%) |
| 55 to 59 Years | 18 (5.2%) | 14 (4.3%) |
| 60 to 64 Years | 18 (5.2%) | 24 (7.4%) |
| 65 to 69 Years | 32 (9.2%) | 30 (9.3%) |
| 70 to 74 Years | 19 (5.4%) | 28 (8.7%) |
| 75 to 79 Years | 0 (0.0%) | 0 (0.0%) |
| 80 to 84 Years | 0 (0.0%) | 0 (0.0%) |
| 85 Years and over | 0 (0.0%) | 6 (1.9%) |
| Total | 349 (100.0%) | 322 (100.0%) |
Families and Households in Casper Mountain
Median Family Size in Casper Mountain
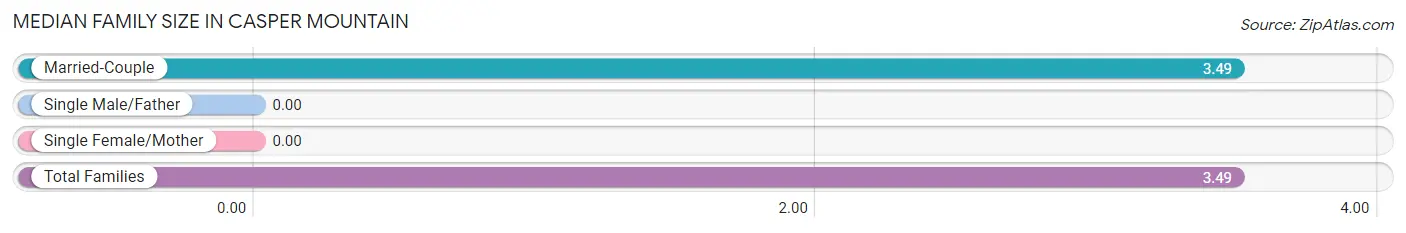
| Family Type | # Families | Family Size |
| Married-Couple | 164 (100.0%) | 3.49 |
| Single Male/Father | 0 (0.0%) | - |
| Single Female/Mother | 0 (0.0%) | - |
| Total Families | 164 (100.0%) | 3.49 |
Median Household Size in Casper Mountain
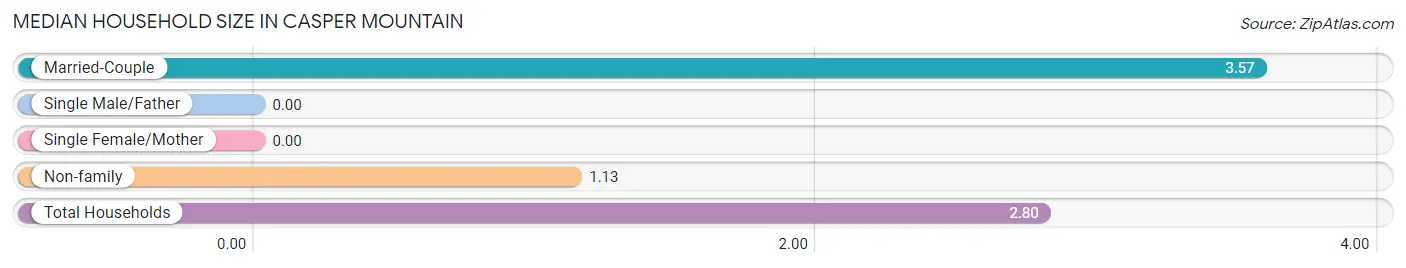
| Household Type | # Households | Household Size |
| Married-Couple | 164 (68.3%) | 3.57 |
| Single Male/Father | 0 (0.0%) | - |
| Single Female/Mother | 0 (0.0%) | - |
| Non-family | 76 (31.7%) | 1.13 |
| Total Households | 240 (100.0%) | 2.80 |
Household Size by Marriage Status in Casper Mountain
Out of a total of 240 households in Casper Mountain, 164 (68.3%) are family households, while 76 (31.7%) are nonfamily households. The most numerous type of family households are 2-person households, comprising 120, and the most common type of nonfamily households are 1-person households, comprising 66.
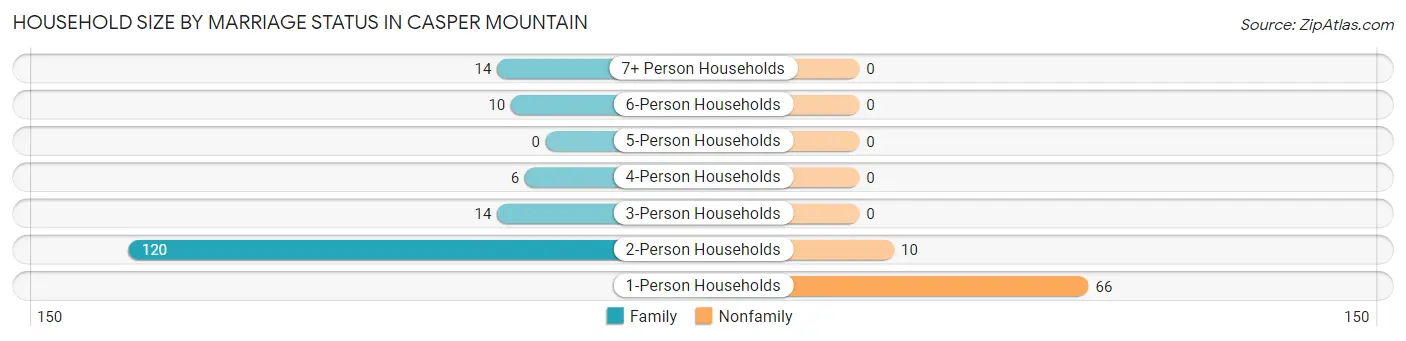
| Household Size | Family Households | Nonfamily Households |
| 1-Person Households | - | 66 (27.5%) |
| 2-Person Households | 120 (50.0%) | 10 (4.2%) |
| 3-Person Households | 14 (5.8%) | 0 (0.0%) |
| 4-Person Households | 6 (2.5%) | 0 (0.0%) |
| 5-Person Households | 0 (0.0%) | 0 (0.0%) |
| 6-Person Households | 10 (4.2%) | 0 (0.0%) |
| 7+ Person Households | 14 (5.8%) | 0 (0.0%) |
| Total | 164 (68.3%) | 76 (31.7%) |
Female Fertility in Casper Mountain
Fertility by Age in Casper Mountain
| Age Bracket | Women with Births | Births / 1,000 Women |
| 15 to 19 years | 0 (0.0%) | 0.0 |
| 20 to 34 years | 0 (0.0%) | 0.0 |
| 35 to 50 years | 0 (0.0%) | 0.0 |
| Total | 0 (0.0%) | 0.0 |
Fertility by Age by Marriage Status in Casper Mountain
| Age Bracket | Married | Unmarried |
| 15 to 19 years | 0 (0.0%) | 0 (0.0%) |
| 20 to 34 years | 0 (0.0%) | 0 (0.0%) |
| 35 to 50 years | 0 (0.0%) | 0 (0.0%) |
| Total | 0 (0.0%) | 0 (0.0%) |
Fertility by Education in Casper Mountain
| Educational Attainment | Women with Births | Births / 1,000 Women |
| Less than High School | 0 (0.0%) | 0.0 |
| High School Diploma | 0 (0.0%) | 0.0 |
| College or Associate's Degree | 0 (0.0%) | 0.0 |
| Bachelor's Degree | 0 (0.0%) | 0.0 |
| Graduate Degree | 0 (0.0%) | 0.0 |
| Total | 0 (0.0%) | 0.0 |
Fertility by Education by Marriage Status in Casper Mountain
| Educational Attainment | Married | Unmarried |
| Less than High School | 0 (0.0%) | 0 (0.0%) |
| High School Diploma | 0 (0.0%) | 0 (0.0%) |
| College or Associate's Degree | 0 (0.0%) | 0 (0.0%) |
| Bachelor's Degree | 0 (0.0%) | 0 (0.0%) |
| Graduate Degree | 0 (0.0%) | 0 (0.0%) |
| Total | 0 (0.0%) | 0 (0.0%) |
Employment Characteristics in Casper Mountain
Employment by Class of Employer in Casper Mountain
Among the 320 employed individuals in Casper Mountain, private company employees (114 | 35.6%), federal government employees (74 | 23.1%), and not-for-profit organizations (44 | 13.8%) make up the most common classes of employment.
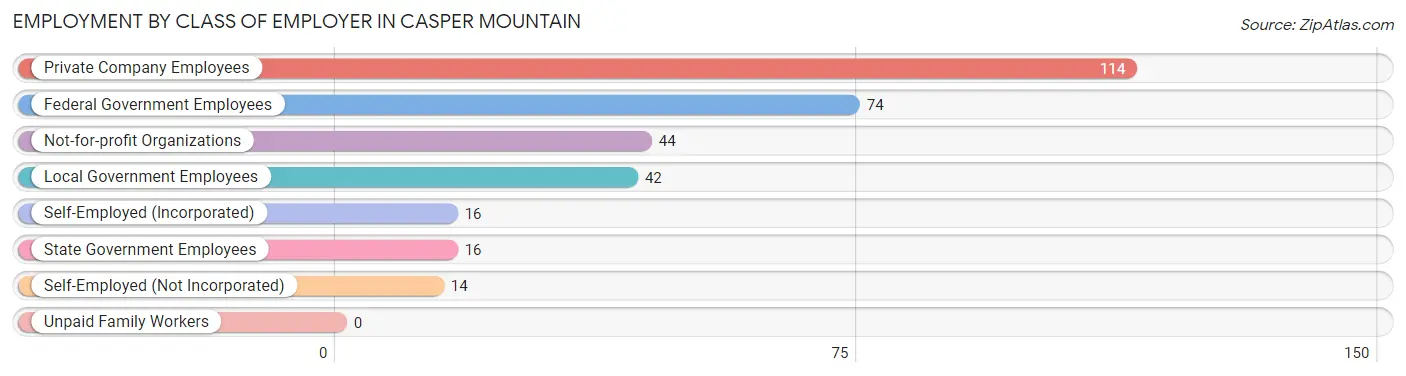
| Employer Class | # Employees | % Employees |
| Private Company Employees | 114 | 35.6% |
| Self-Employed (Incorporated) | 16 | 5.0% |
| Self-Employed (Not Incorporated) | 14 | 4.4% |
| Not-for-profit Organizations | 44 | 13.8% |
| Local Government Employees | 42 | 13.1% |
| State Government Employees | 16 | 5.0% |
| Federal Government Employees | 74 | 23.1% |
| Unpaid Family Workers | 0 | 0.0% |
| Total | 320 | 100.0% |
Employment Status by Age in Casper Mountain
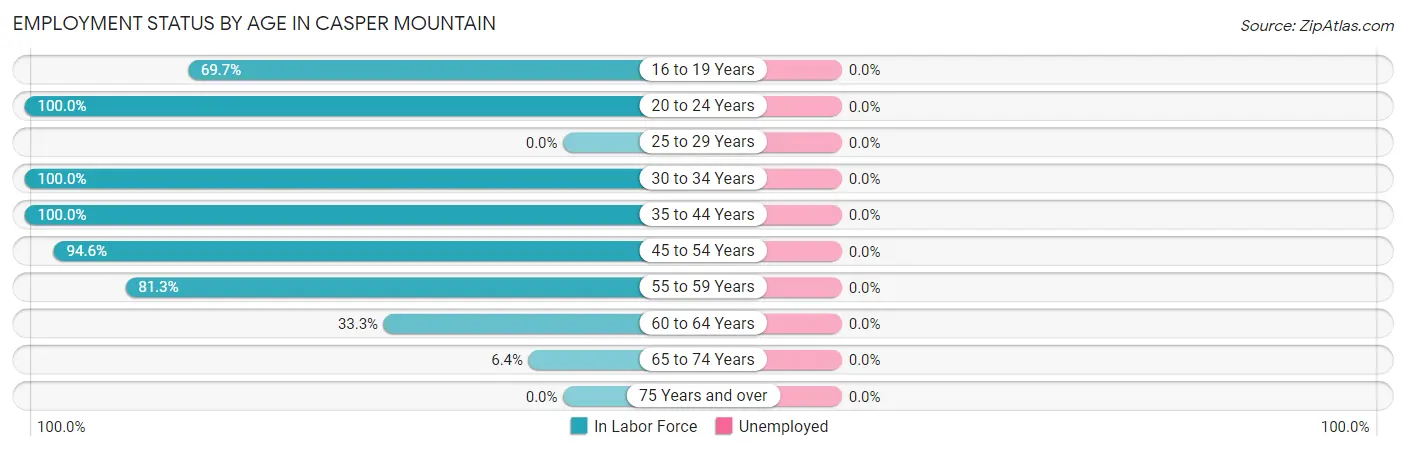
| Age Bracket | In Labor Force | Unemployed |
| 16 to 19 Years | 46 (69.7%) | 0 (0.0%) |
| 20 to 24 Years | 22 (100.0%) | 0 (0.0%) |
| 25 to 29 Years | 0 (0.0%) | 0 (0.0%) |
| 30 to 34 Years | 22 (100.0%) | 0 (0.0%) |
| 35 to 44 Years | 43 (100.0%) | 0 (0.0%) |
| 45 to 54 Years | 140 (94.6%) | 0 (0.0%) |
| 55 to 59 Years | 26 (81.3%) | 0 (0.0%) |
| 60 to 64 Years | 14 (33.3%) | 0 (0.0%) |
| 65 to 74 Years | 7 (6.4%) | 0 (0.0%) |
| 75 Years and over | 0 (0.0%) | 0 (0.0%) |
| Total | 320 (65.3%) | 0 (0.0%) |
Employment Status by Educational Attainment in Casper Mountain
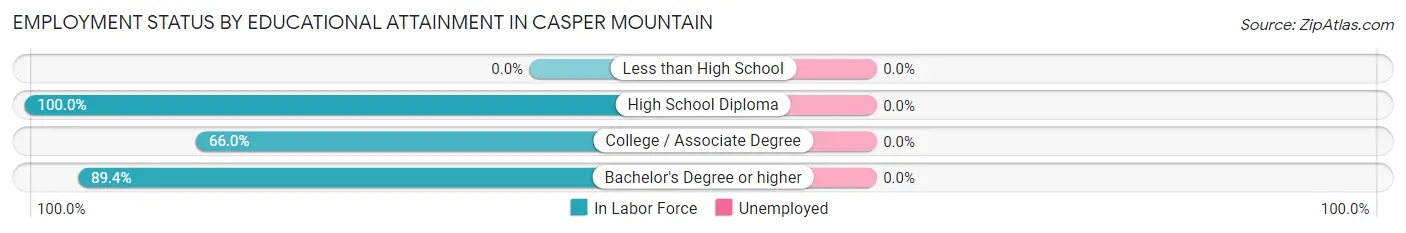
| Educational Attainment | In Labor Force | Unemployed |
| Less than High School | 0 (0.0%) | 0 (0.0%) |
| High School Diploma | 46 (100.0%) | 0 (0.0%) |
| College / Associate Degree | 31 (66.0%) | 0 (0.0%) |
| Bachelor's Degree or higher | 168 (89.4%) | 0 (0.0%) |
| Total | 245 (85.4%) | 0 (0.0%) |
Employment Occupations by Sex in Casper Mountain
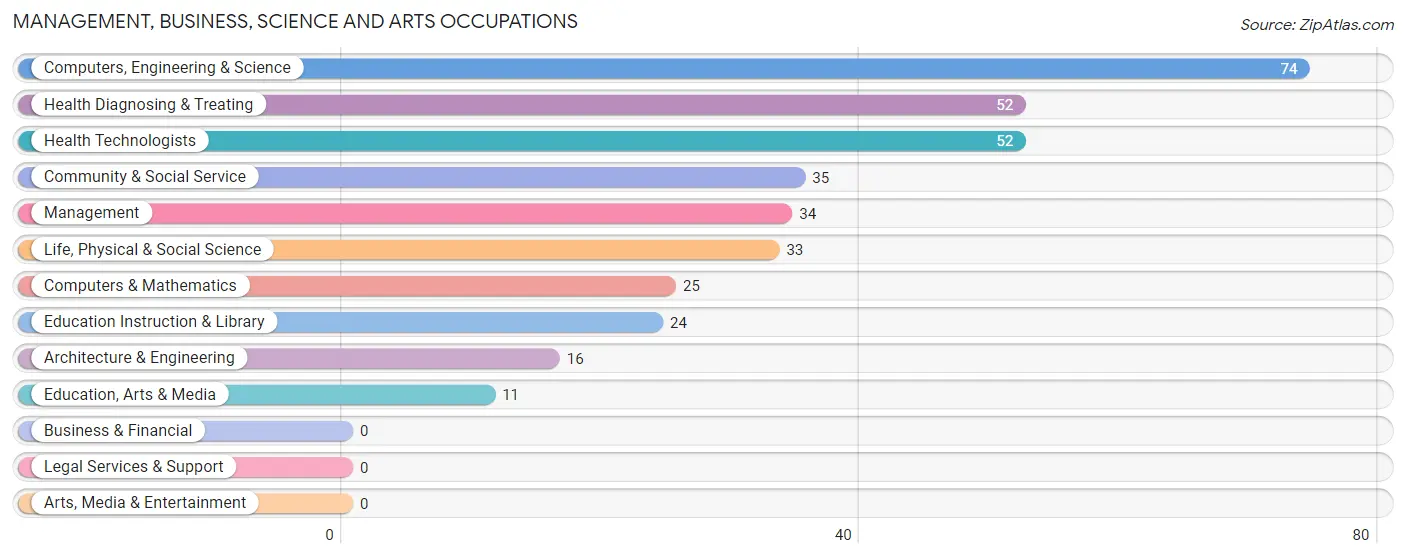
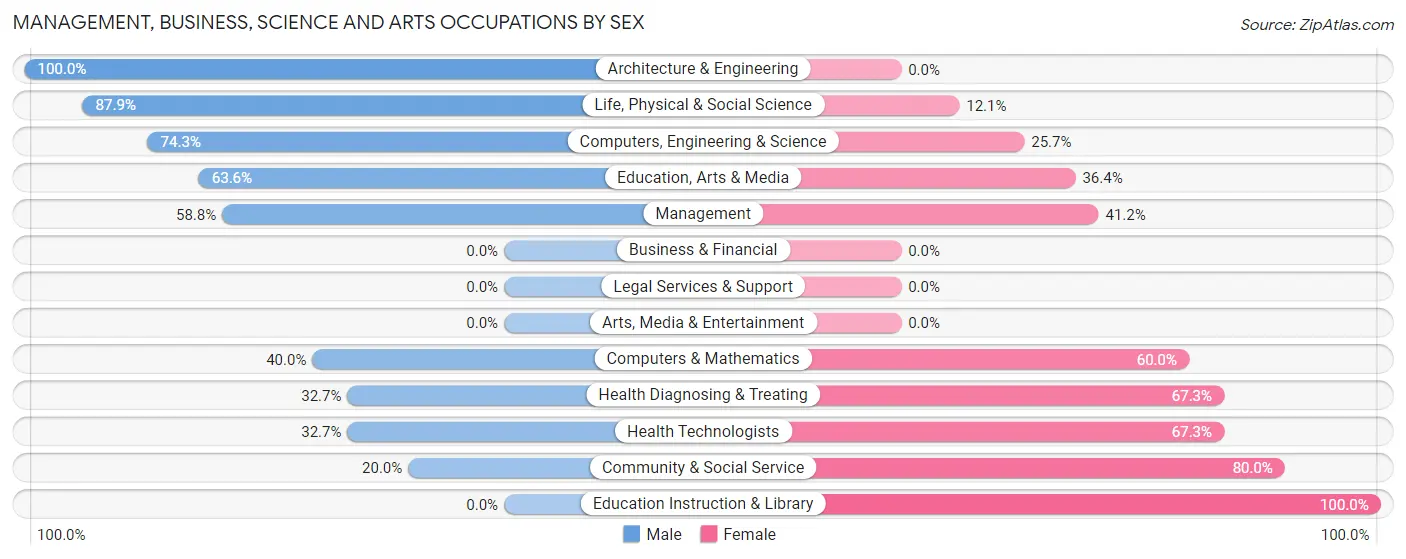
Management, Business, Science and Arts Occupations
The most common Management, Business, Science and Arts occupations in Casper Mountain are Computers, Engineering & Science (74 | 23.1%), Health Diagnosing & Treating (52 | 16.3%), Health Technologists (52 | 16.3%), Community & Social Service (35 | 10.9%), and Management (34 | 10.6%).
Management, Business, Science and Arts Occupations by Sex
Within the Management, Business, Science and Arts occupations in Casper Mountain, the most male-oriented occupations are Architecture & Engineering (100.0%), Life, Physical & Social Science (87.9%), and Computers, Engineering & Science (74.3%), while the most female-oriented occupations are Education Instruction & Library (100.0%), Community & Social Service (80.0%), and Health Diagnosing & Treating (67.3%).
| Occupation | Male | Female |
| Management | 20 (58.8%) | 14 (41.2%) |
| Business & Financial | 0 (0.0%) | 0 (0.0%) |
| Computers, Engineering & Science | 55 (74.3%) | 19 (25.7%) |
| Computers & Mathematics | 10 (40.0%) | 15 (60.0%) |
| Architecture & Engineering | 16 (100.0%) | 0 (0.0%) |
| Life, Physical & Social Science | 29 (87.9%) | 4 (12.1%) |
| Community & Social Service | 7 (20.0%) | 28 (80.0%) |
| Education, Arts & Media | 7 (63.6%) | 4 (36.4%) |
| Legal Services & Support | 0 (0.0%) | 0 (0.0%) |
| Education Instruction & Library | 0 (0.0%) | 24 (100.0%) |
| Arts, Media & Entertainment | 0 (0.0%) | 0 (0.0%) |
| Health Diagnosing & Treating | 17 (32.7%) | 35 (67.3%) |
| Health Technologists | 17 (32.7%) | 35 (67.3%) |
| Total (Category) | 99 (50.8%) | 96 (49.2%) |
| Total (Overall) | 176 (55.0%) | 144 (45.0%) |
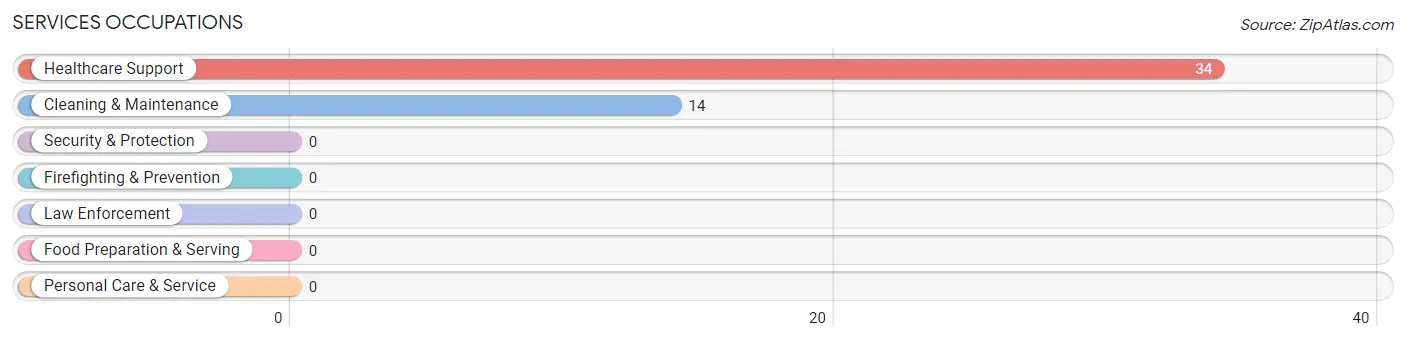
Services Occupations
The most common Services occupations in Casper Mountain are Healthcare Support (34 | 10.6%), and Cleaning & Maintenance (14 | 4.4%).
Services Occupations by Sex
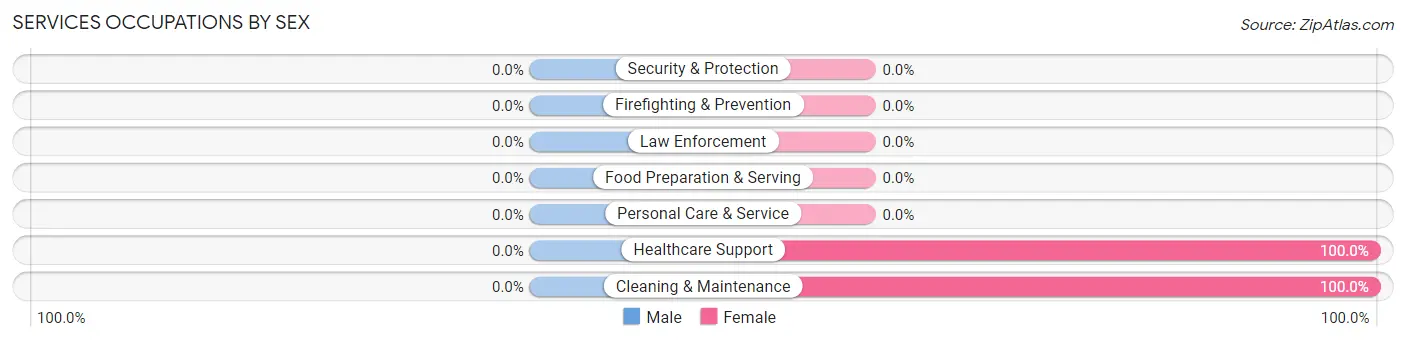
| Occupation | Male | Female |
| Healthcare Support | 0 (0.0%) | 34 (100.0%) |
| Security & Protection | 0 (0.0%) | 0 (0.0%) |
| Firefighting & Prevention | 0 (0.0%) | 0 (0.0%) |
| Law Enforcement | 0 (0.0%) | 0 (0.0%) |
| Food Preparation & Serving | 0 (0.0%) | 0 (0.0%) |
| Cleaning & Maintenance | 0 (0.0%) | 14 (100.0%) |
| Personal Care & Service | 0 (0.0%) | 0 (0.0%) |
| Total (Category) | 0 (0.0%) | 48 (100.0%) |
| Total (Overall) | 176 (55.0%) | 144 (45.0%) |
Sales and Office Occupations
The most common Sales and Office occupations in Casper Mountain are Office & Administration (17 | 5.3%), and Sales & Related (5 | 1.6%).

Sales and Office Occupations by Sex

| Occupation | Male | Female |
| Sales & Related | 5 (100.0%) | 0 (0.0%) |
| Office & Administration | 17 (100.0%) | 0 (0.0%) |
| Total (Category) | 22 (100.0%) | 0 (0.0%) |
| Total (Overall) | 176 (55.0%) | 144 (45.0%) |
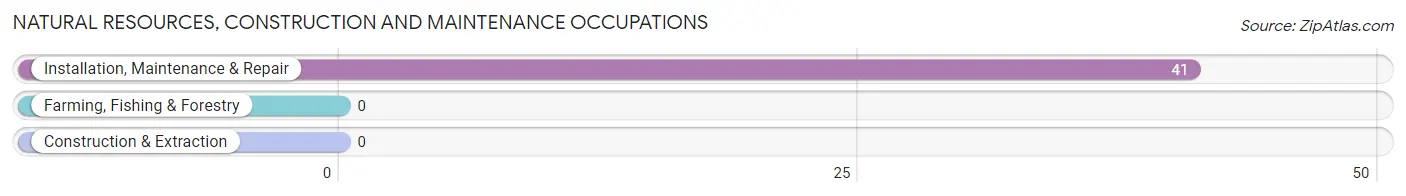
Natural Resources, Construction and Maintenance Occupations
The most common Natural Resources, Construction and Maintenance occupations in Casper Mountain are , and Installation, Maintenance & Repair (41 | 12.8%).
Natural Resources, Construction and Maintenance Occupations by Sex
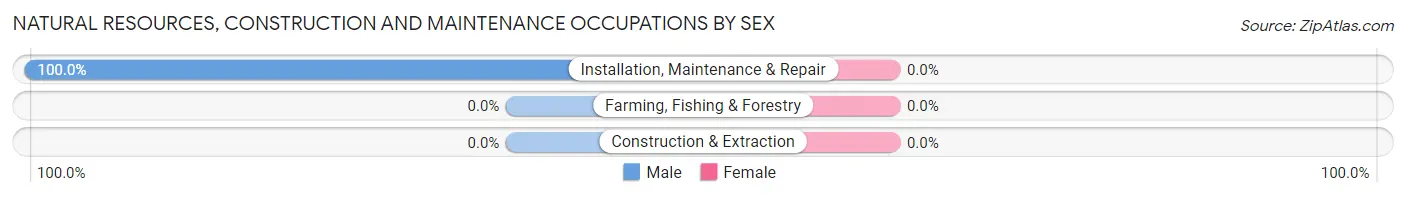
| Occupation | Male | Female |
| Farming, Fishing & Forestry | 0 (0.0%) | 0 (0.0%) |
| Construction & Extraction | 0 (0.0%) | 0 (0.0%) |
| Installation, Maintenance & Repair | 41 (100.0%) | 0 (0.0%) |
| Total (Category) | 41 (100.0%) | 0 (0.0%) |
| Total (Overall) | 176 (55.0%) | 144 (45.0%) |
Production, Transportation and Moving Occupations
The most common Production, Transportation and Moving occupations in Casper Mountain are Production (7 | 2.2%), and Material Moving (7 | 2.2%).
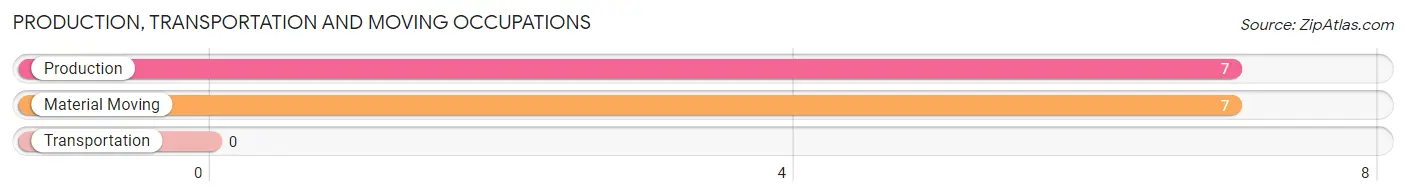
Production, Transportation and Moving Occupations by Sex
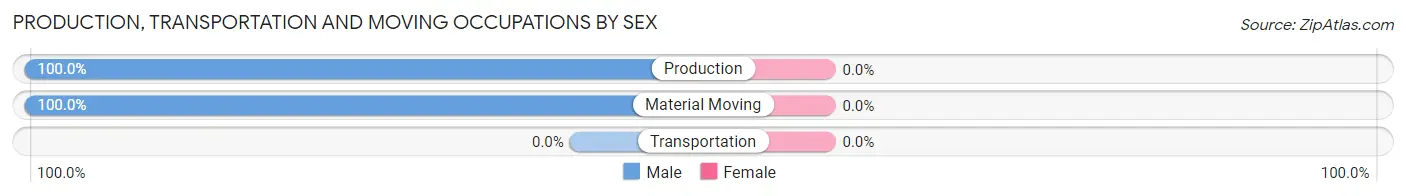
| Occupation | Male | Female |
| Production | 7 (100.0%) | 0 (0.0%) |
| Transportation | 0 (0.0%) | 0 (0.0%) |
| Material Moving | 7 (100.0%) | 0 (0.0%) |
| Total (Category) | 14 (100.0%) | 0 (0.0%) |
| Total (Overall) | 176 (55.0%) | 144 (45.0%) |
Employment Industries by Sex in Casper Mountain
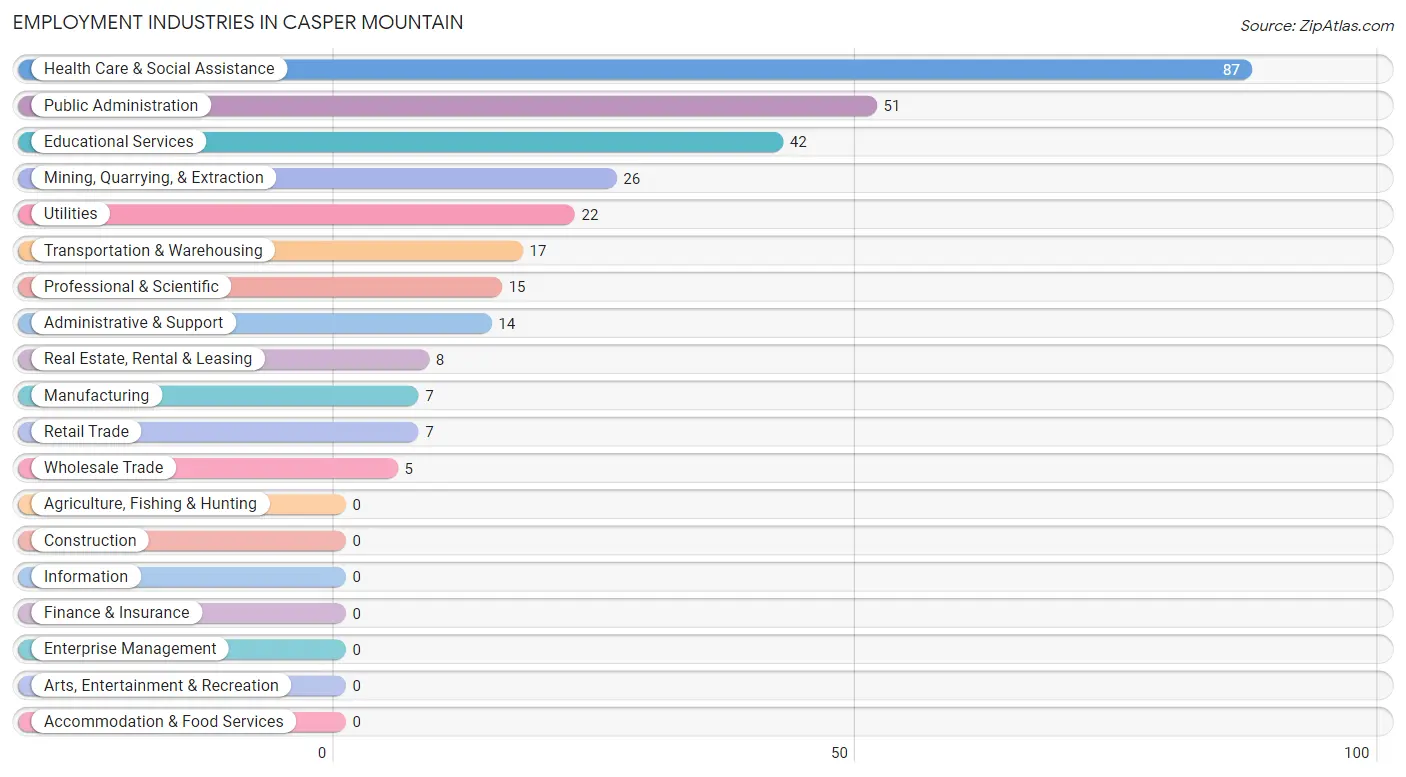
Employment Industries in Casper Mountain
The major employment industries in Casper Mountain include Health Care & Social Assistance (87 | 27.2%), Public Administration (51 | 15.9%), Educational Services (42 | 13.1%), Mining, Quarrying, & Extraction (26 | 8.1%), and Utilities (22 | 6.9%).
Employment Industries by Sex in Casper Mountain
The Casper Mountain industries that see more men than women are Mining, Quarrying, & Extraction (100.0%), Manufacturing (100.0%), and Wholesale Trade (100.0%), whereas the industries that tend to have a higher number of women are Real Estate, Rental & Leasing (100.0%), Professional & Scientific (100.0%), and Administrative & Support (100.0%).
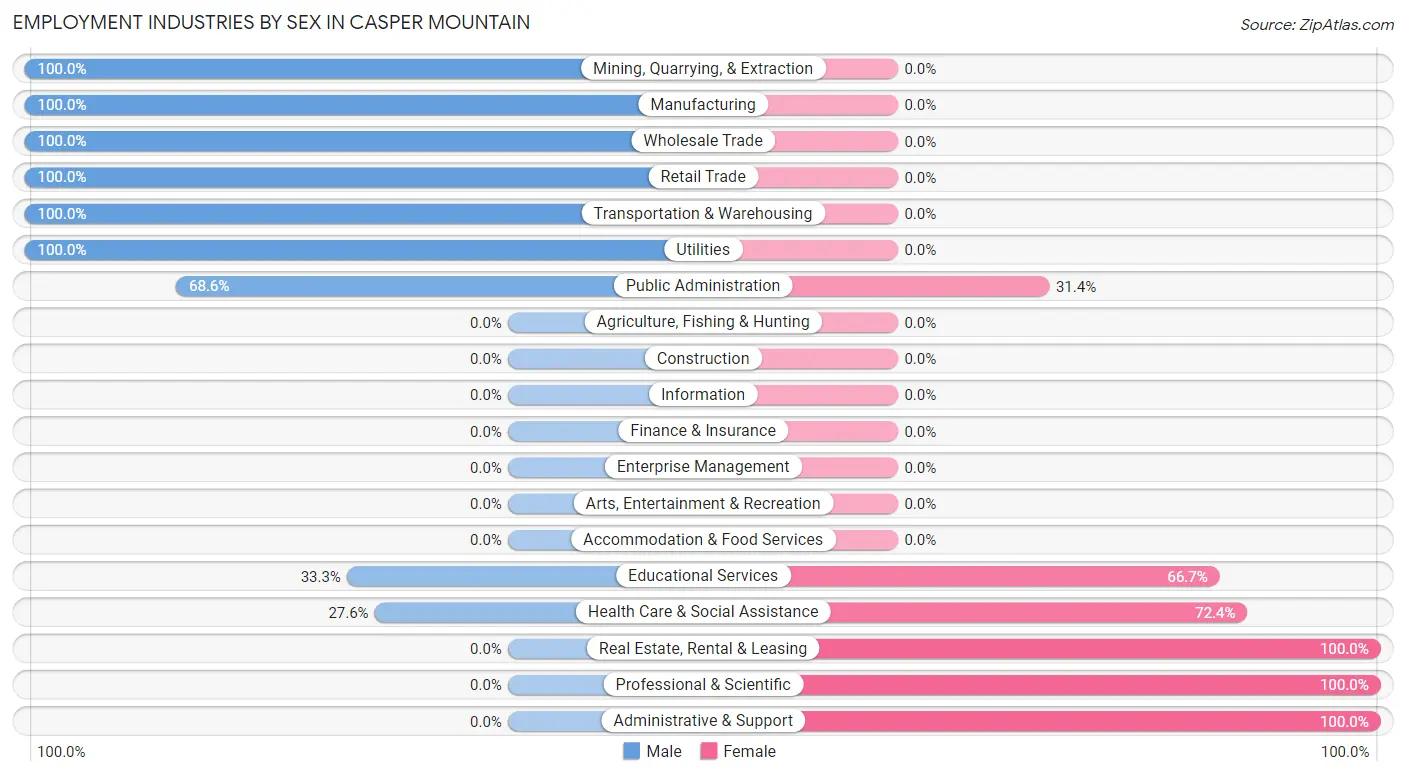
| Industry | Male | Female |
| Agriculture, Fishing & Hunting | 0 (0.0%) | 0 (0.0%) |
| Mining, Quarrying, & Extraction | 26 (100.0%) | 0 (0.0%) |
| Construction | 0 (0.0%) | 0 (0.0%) |
| Manufacturing | 7 (100.0%) | 0 (0.0%) |
| Wholesale Trade | 5 (100.0%) | 0 (0.0%) |
| Retail Trade | 7 (100.0%) | 0 (0.0%) |
| Transportation & Warehousing | 17 (100.0%) | 0 (0.0%) |
| Utilities | 22 (100.0%) | 0 (0.0%) |
| Information | 0 (0.0%) | 0 (0.0%) |
| Finance & Insurance | 0 (0.0%) | 0 (0.0%) |
| Real Estate, Rental & Leasing | 0 (0.0%) | 8 (100.0%) |
| Professional & Scientific | 0 (0.0%) | 15 (100.0%) |
| Enterprise Management | 0 (0.0%) | 0 (0.0%) |
| Administrative & Support | 0 (0.0%) | 14 (100.0%) |
| Educational Services | 14 (33.3%) | 28 (66.7%) |
| Health Care & Social Assistance | 24 (27.6%) | 63 (72.4%) |
| Arts, Entertainment & Recreation | 0 (0.0%) | 0 (0.0%) |
| Accommodation & Food Services | 0 (0.0%) | 0 (0.0%) |
| Public Administration | 35 (68.6%) | 16 (31.4%) |
| Total | 176 (55.0%) | 144 (45.0%) |
Education in Casper Mountain
School Enrollment in Casper Mountain
The most common levels of schooling among the 241 students in Casper Mountain are middle school (105 | 43.6%), high school (78 | 32.4%), and elementary school (40 | 16.6%).
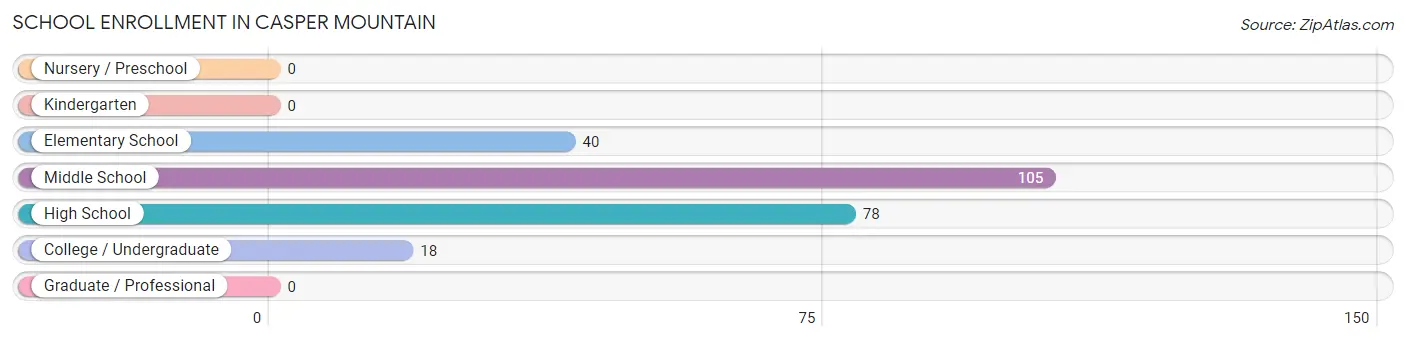
| School Level | # Students | % Students |
| Nursery / Preschool | 0 | 0.0% |
| Kindergarten | 0 | 0.0% |
| Elementary School | 40 | 16.6% |
| Middle School | 105 | 43.6% |
| High School | 78 | 32.4% |
| College / Undergraduate | 18 | 7.5% |
| Graduate / Professional | 0 | 0.0% |
| Total | 241 | 100.0% |
School Enrollment by Age by Funding Source in Casper Mountain
Out of a total of 241 students who are enrolled in schools in Casper Mountain, 139 (57.7%) attend a private institution, while the remaining 102 (42.3%) are enrolled in public schools. The age group of 10 to 14 year olds has the highest likelihood of being enrolled in private schools, with 87 (70.2% in the age bracket) enrolled. Conversely, the age group of 35 years and over has the lowest likelihood of being enrolled in a private school, with 18 (100.0% in the age bracket) attending a public institution.
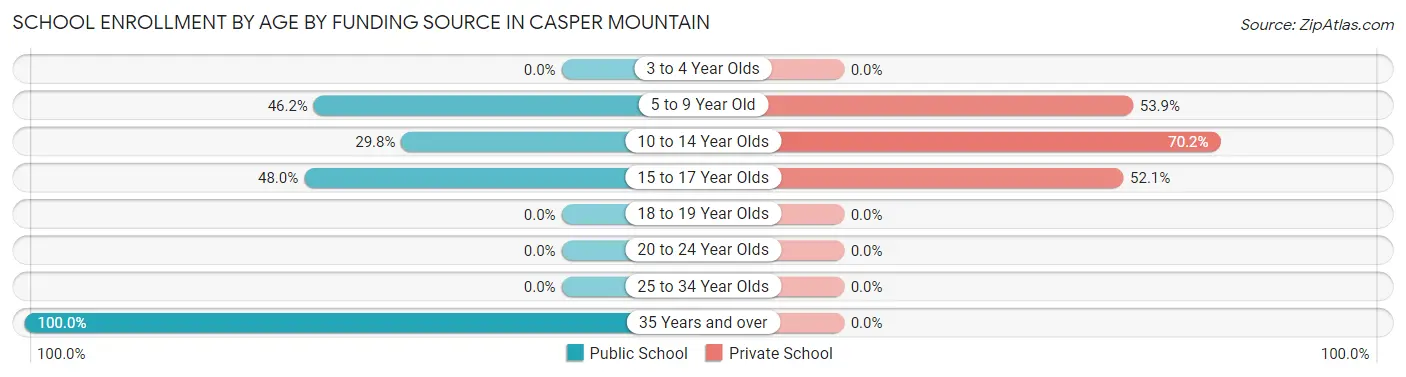
| Age Bracket | Public School | Private School |
| 3 to 4 Year Olds | 0 (0.0%) | 0 (0.0%) |
| 5 to 9 Year Old | 12 (46.2%) | 14 (53.8%) |
| 10 to 14 Year Olds | 37 (29.8%) | 87 (70.2%) |
| 15 to 17 Year Olds | 35 (47.9%) | 38 (52.0%) |
| 18 to 19 Year Olds | 0 (0.0%) | 0 (0.0%) |
| 20 to 24 Year Olds | 0 (0.0%) | 0 (0.0%) |
| 25 to 34 Year Olds | 0 (0.0%) | 0 (0.0%) |
| 35 Years and over | 18 (100.0%) | 0 (0.0%) |
| Total | 102 (42.3%) | 139 (57.7%) |
Educational Attainment by Field of Study in Casper Mountain
Education (65 | 24.2%), literature & languages (43 | 16.0%), science & technology (35 | 13.0%), engineering (33 | 12.3%), and social sciences (22 | 8.2%) are the most common fields of study among 269 individuals in Casper Mountain who have obtained a bachelor's degree or higher.
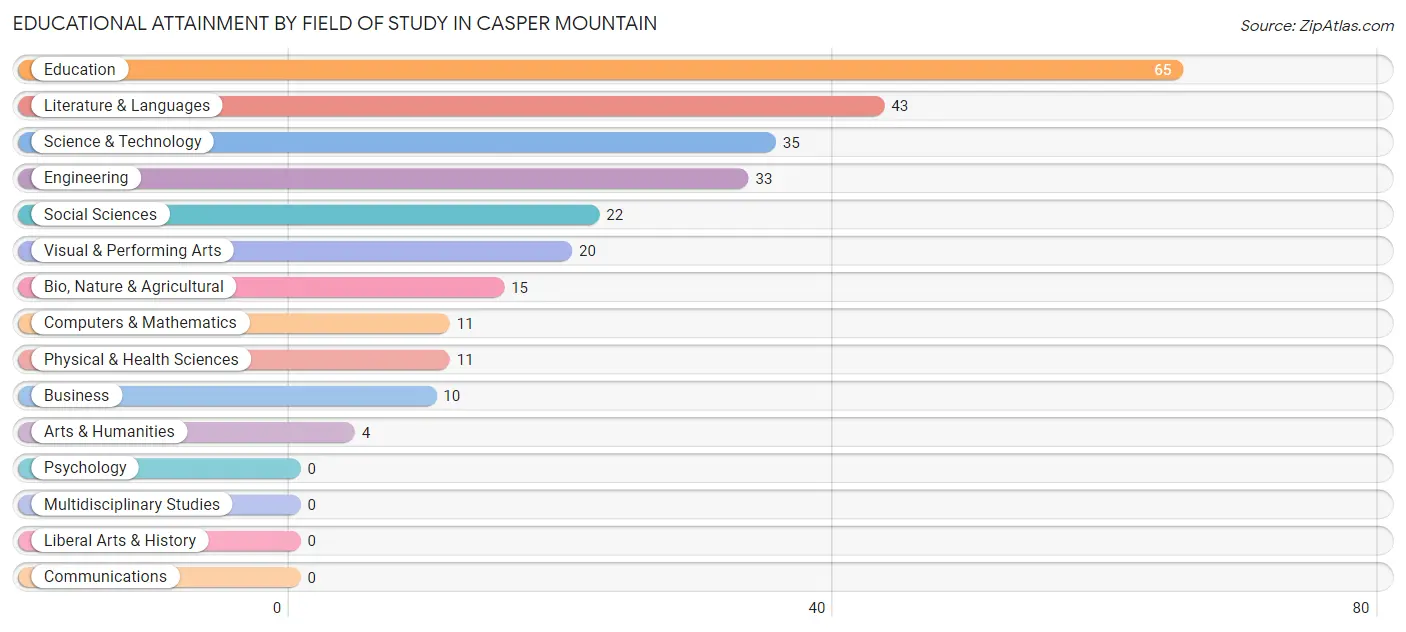
| Field of Study | # Graduates | % Graduates |
| Computers & Mathematics | 11 | 4.1% |
| Bio, Nature & Agricultural | 15 | 5.6% |
| Physical & Health Sciences | 11 | 4.1% |
| Psychology | 0 | 0.0% |
| Social Sciences | 22 | 8.2% |
| Engineering | 33 | 12.3% |
| Multidisciplinary Studies | 0 | 0.0% |
| Science & Technology | 35 | 13.0% |
| Business | 10 | 3.7% |
| Education | 65 | 24.2% |
| Literature & Languages | 43 | 16.0% |
| Liberal Arts & History | 0 | 0.0% |
| Visual & Performing Arts | 20 | 7.4% |
| Communications | 0 | 0.0% |
| Arts & Humanities | 4 | 1.5% |
| Total | 269 | 100.0% |
Transportation & Commute in Casper Mountain
Vehicle Availability by Sex in Casper Mountain
The most prevalent vehicle ownership categories in Casper Mountain are males with 5 or more vehicles (65, accounting for 36.9%) and females with 5 or more vehicles (67, making up 45.1%).
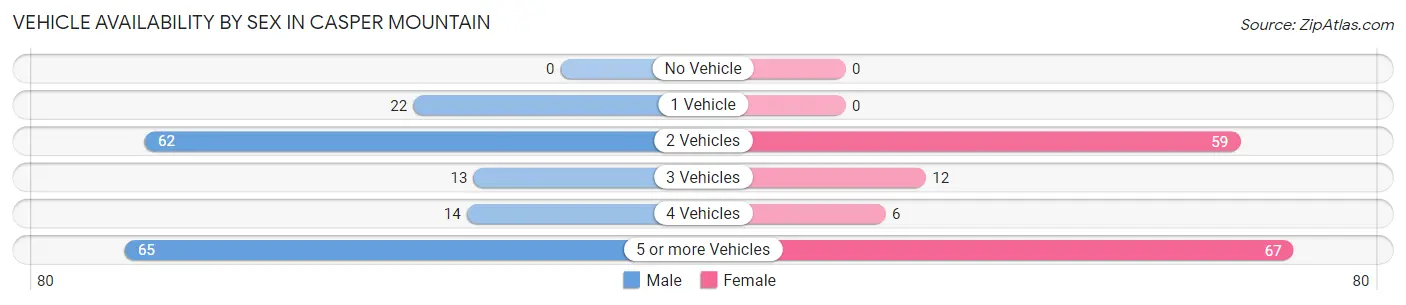
| Vehicles Available | Male | Female |
| No Vehicle | 0 (0.0%) | 0 (0.0%) |
| 1 Vehicle | 22 (12.5%) | 0 (0.0%) |
| 2 Vehicles | 62 (35.2%) | 59 (41.0%) |
| 3 Vehicles | 13 (7.4%) | 12 (8.3%) |
| 4 Vehicles | 14 (8.0%) | 6 (4.2%) |
| 5 or more Vehicles | 65 (36.9%) | 67 (46.5%) |
| Total | 176 (100.0%) | 144 (100.0%) |
Commute Time in Casper Mountain
The most frequently occuring commute durations in Casper Mountain are 15 to 19 minutes (88 commuters, 27.5%), 10 to 14 minutes (47 commuters, 14.7%), and 20 to 24 minutes (44 commuters, 13.8%).
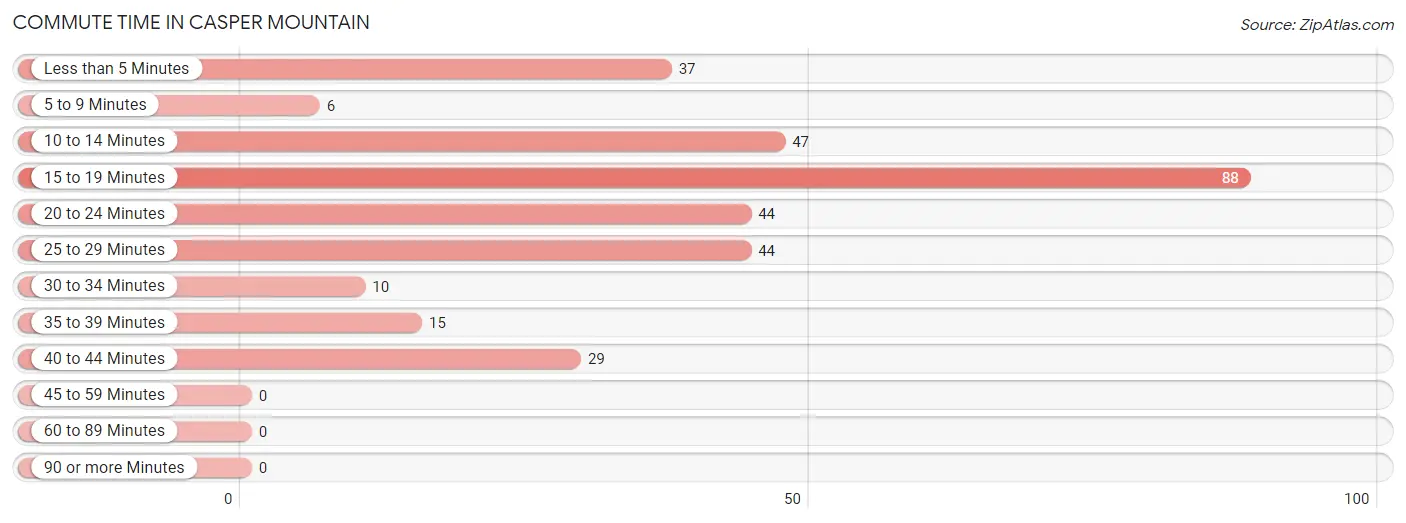
| Commute Time | # Commuters | % Commuters |
| Less than 5 Minutes | 37 | 11.6% |
| 5 to 9 Minutes | 6 | 1.9% |
| 10 to 14 Minutes | 47 | 14.7% |
| 15 to 19 Minutes | 88 | 27.5% |
| 20 to 24 Minutes | 44 | 13.8% |
| 25 to 29 Minutes | 44 | 13.8% |
| 30 to 34 Minutes | 10 | 3.1% |
| 35 to 39 Minutes | 15 | 4.7% |
| 40 to 44 Minutes | 29 | 9.1% |
| 45 to 59 Minutes | 0 | 0.0% |
| 60 to 89 Minutes | 0 | 0.0% |
| 90 or more Minutes | 0 | 0.0% |
Commute Time by Sex in Casper Mountain
The most common commute times in Casper Mountain are 15 to 19 minutes (53 commuters, 30.1%) for males and 15 to 19 minutes (35 commuters, 24.3%) for females.
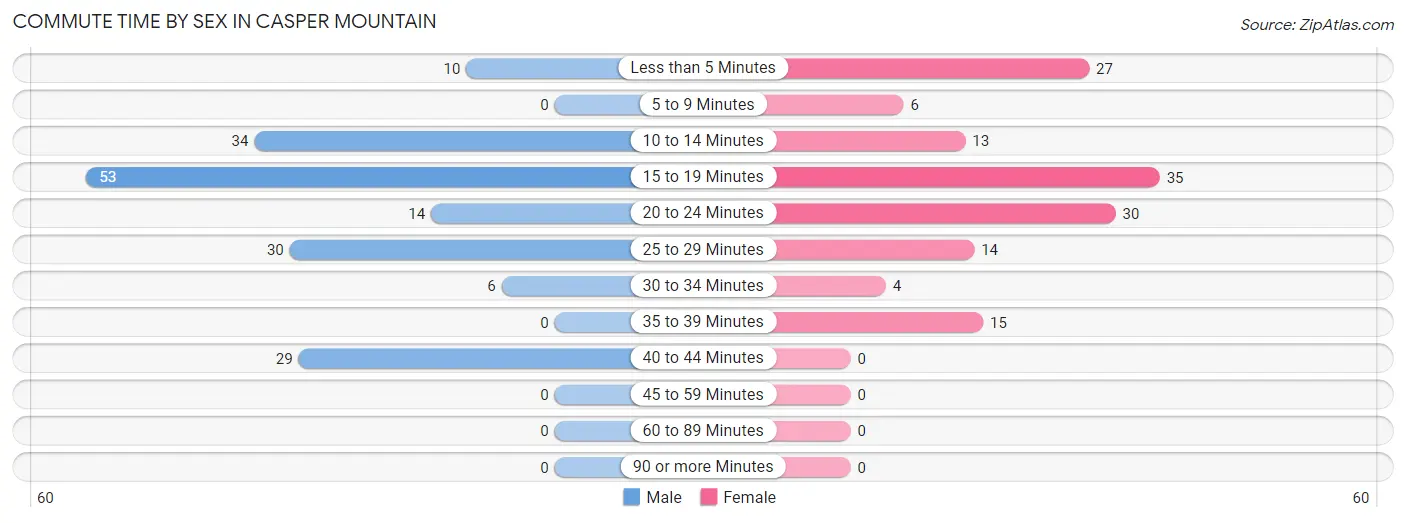
| Commute Time | Male | Female |
| Less than 5 Minutes | 10 (5.7%) | 27 (18.8%) |
| 5 to 9 Minutes | 0 (0.0%) | 6 (4.2%) |
| 10 to 14 Minutes | 34 (19.3%) | 13 (9.0%) |
| 15 to 19 Minutes | 53 (30.1%) | 35 (24.3%) |
| 20 to 24 Minutes | 14 (8.0%) | 30 (20.8%) |
| 25 to 29 Minutes | 30 (17.1%) | 14 (9.7%) |
| 30 to 34 Minutes | 6 (3.4%) | 4 (2.8%) |
| 35 to 39 Minutes | 0 (0.0%) | 15 (10.4%) |
| 40 to 44 Minutes | 29 (16.5%) | 0 (0.0%) |
| 45 to 59 Minutes | 0 (0.0%) | 0 (0.0%) |
| 60 to 89 Minutes | 0 (0.0%) | 0 (0.0%) |
| 90 or more Minutes | 0 (0.0%) | 0 (0.0%) |
Time of Departure to Work by Sex in Casper Mountain
The most frequent times of departure to work in Casper Mountain are 6:30 AM to 6:59 AM (77, 43.8%) for males and 7:30 AM to 7:59 AM (36, 25.0%) for females.
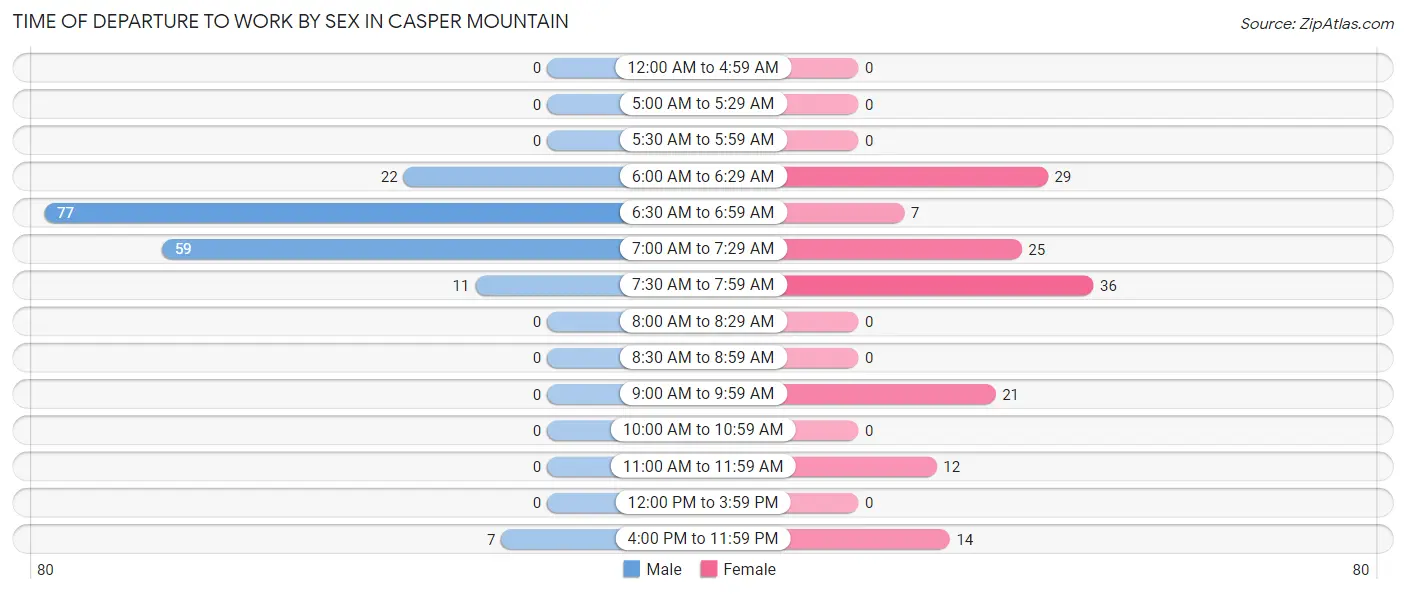
| Time of Departure | Male | Female |
| 12:00 AM to 4:59 AM | 0 (0.0%) | 0 (0.0%) |
| 5:00 AM to 5:29 AM | 0 (0.0%) | 0 (0.0%) |
| 5:30 AM to 5:59 AM | 0 (0.0%) | 0 (0.0%) |
| 6:00 AM to 6:29 AM | 22 (12.5%) | 29 (20.1%) |
| 6:30 AM to 6:59 AM | 77 (43.8%) | 7 (4.9%) |
| 7:00 AM to 7:29 AM | 59 (33.5%) | 25 (17.4%) |
| 7:30 AM to 7:59 AM | 11 (6.2%) | 36 (25.0%) |
| 8:00 AM to 8:29 AM | 0 (0.0%) | 0 (0.0%) |
| 8:30 AM to 8:59 AM | 0 (0.0%) | 0 (0.0%) |
| 9:00 AM to 9:59 AM | 0 (0.0%) | 21 (14.6%) |
| 10:00 AM to 10:59 AM | 0 (0.0%) | 0 (0.0%) |
| 11:00 AM to 11:59 AM | 0 (0.0%) | 12 (8.3%) |
| 12:00 PM to 3:59 PM | 0 (0.0%) | 0 (0.0%) |
| 4:00 PM to 11:59 PM | 7 (4.0%) | 14 (9.7%) |
| Total | 176 (100.0%) | 144 (100.0%) |
Housing Occupancy in Casper Mountain
Occupancy by Ownership in Casper Mountain
Of the total 240 dwellings in Casper Mountain, owner-occupied units account for 230 (95.8%), while renter-occupied units make up 10 (4.2%).
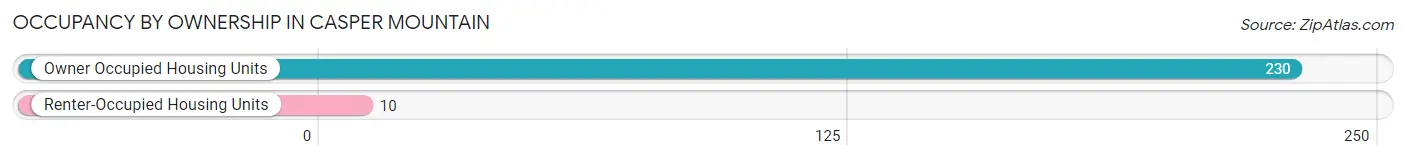
| Occupancy | # Housing Units | % Housing Units |
| Owner Occupied Housing Units | 230 | 95.8% |
| Renter-Occupied Housing Units | 10 | 4.2% |
| Total Occupied Housing Units | 240 | 100.0% |
Occupancy by Household Size in Casper Mountain
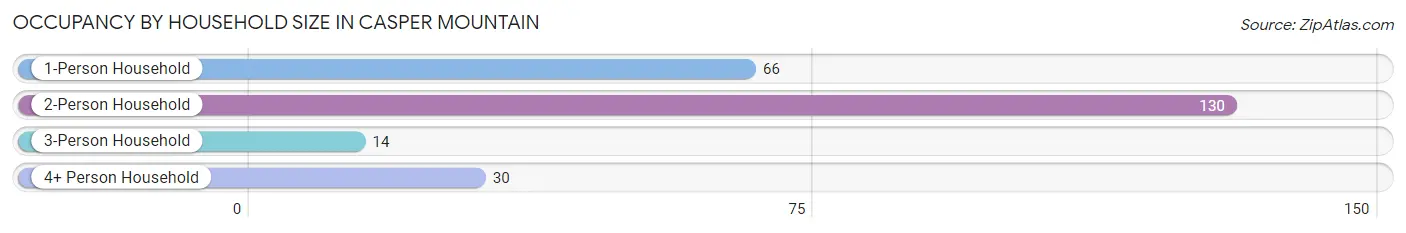
| Household Size | # Housing Units | % Housing Units |
| 1-Person Household | 66 | 27.5% |
| 2-Person Household | 130 | 54.2% |
| 3-Person Household | 14 | 5.8% |
| 4+ Person Household | 30 | 12.5% |
| Total Housing Units | 240 | 100.0% |
Occupancy by Ownership by Household Size in Casper Mountain
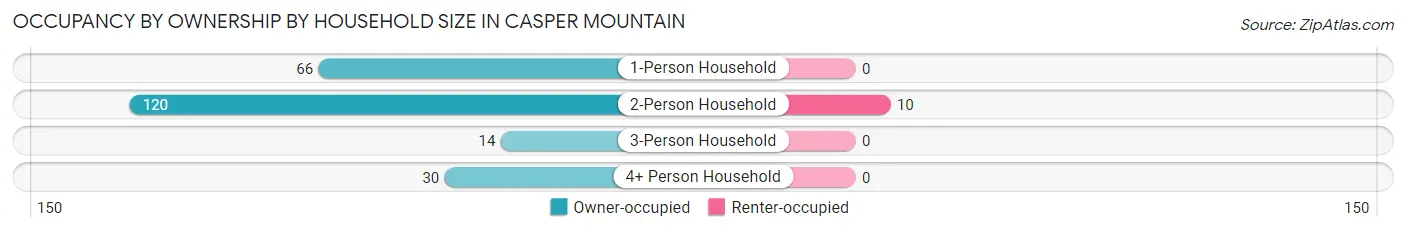
| Household Size | Owner-occupied | Renter-occupied |
| 1-Person Household | 66 (100.0%) | 0 (0.0%) |
| 2-Person Household | 120 (92.3%) | 10 (7.7%) |
| 3-Person Household | 14 (100.0%) | 0 (0.0%) |
| 4+ Person Household | 30 (100.0%) | 0 (0.0%) |
| Total Housing Units | 230 (95.8%) | 10 (4.2%) |
Occupancy by Educational Attainment in Casper Mountain
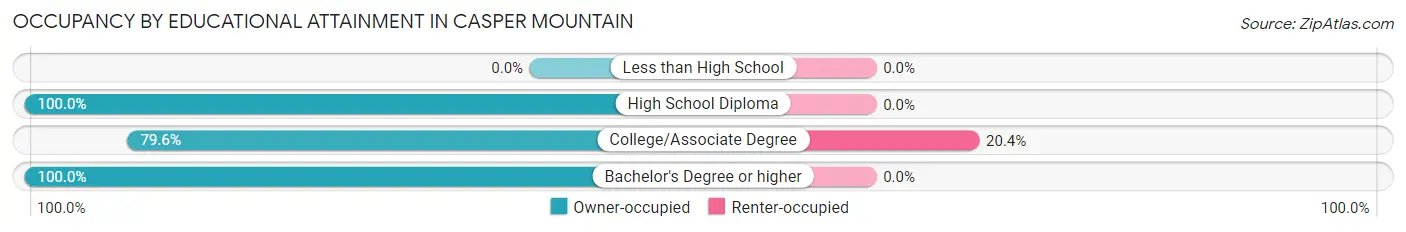
| Household Size | Owner-occupied | Renter-occupied |
| Less than High School | 0 (0.0%) | 0 (0.0%) |
| High School Diploma | 35 (100.0%) | 0 (0.0%) |
| College/Associate Degree | 39 (79.6%) | 10 (20.4%) |
| Bachelor's Degree or higher | 156 (100.0%) | 0 (0.0%) |
Occupancy by Age of Householder in Casper Mountain
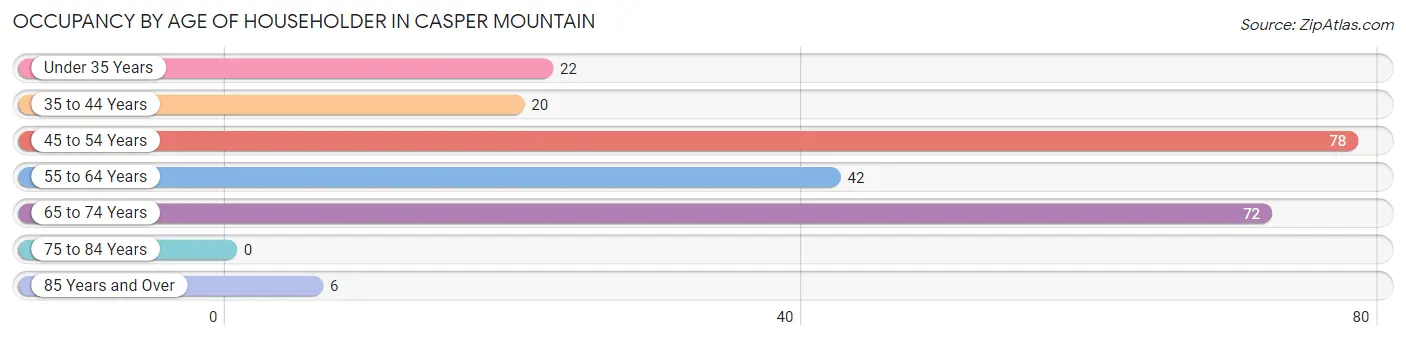
| Age Bracket | # Households | % Households |
| Under 35 Years | 22 | 9.2% |
| 35 to 44 Years | 20 | 8.3% |
| 45 to 54 Years | 78 | 32.5% |
| 55 to 64 Years | 42 | 17.5% |
| 65 to 74 Years | 72 | 30.0% |
| 75 to 84 Years | 0 | 0.0% |
| 85 Years and Over | 6 | 2.5% |
| Total | 240 | 100.0% |
Housing Finances in Casper Mountain
Median Income by Occupancy in Casper Mountain
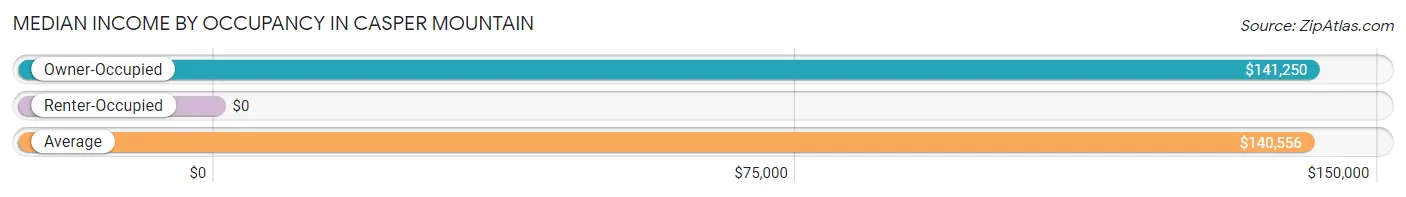
| Occupancy Type | # Households | Median Income |
| Owner-Occupied | 230 (95.8%) | $141,250 |
| Renter-Occupied | 10 (4.2%) | $0 |
| Average | 240 (100.0%) | $140,556 |
Occupancy by Householder Income Bracket in Casper Mountain
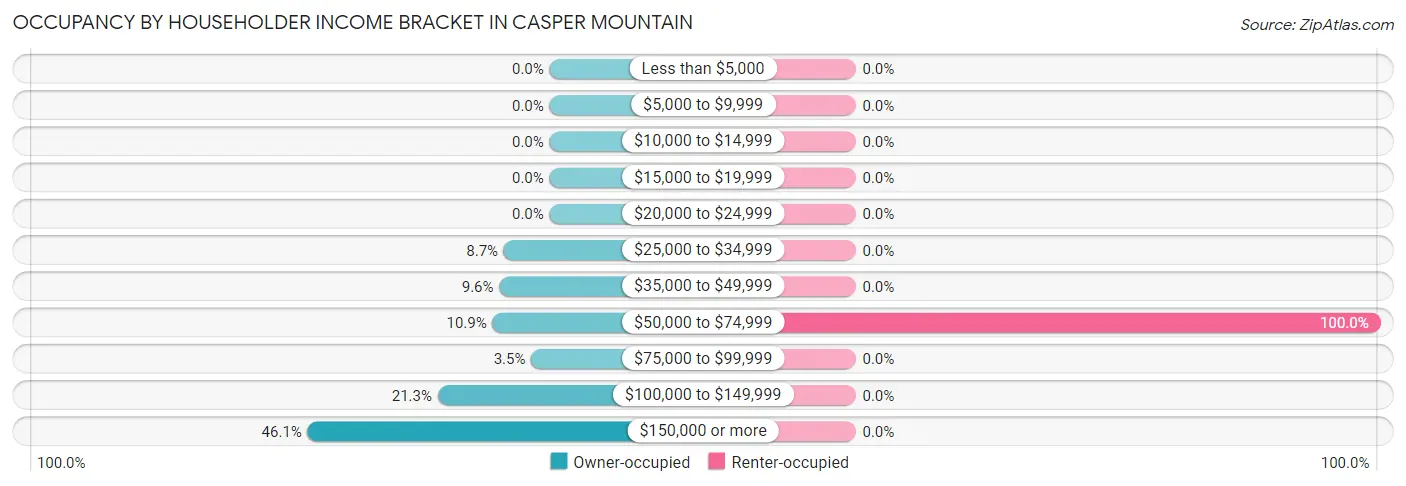
| Income Bracket | Owner-occupied | Renter-occupied |
| Less than $5,000 | 0 (0.0%) | 0 (0.0%) |
| $5,000 to $9,999 | 0 (0.0%) | 0 (0.0%) |
| $10,000 to $14,999 | 0 (0.0%) | 0 (0.0%) |
| $15,000 to $19,999 | 0 (0.0%) | 0 (0.0%) |
| $20,000 to $24,999 | 0 (0.0%) | 0 (0.0%) |
| $25,000 to $34,999 | 20 (8.7%) | 0 (0.0%) |
| $35,000 to $49,999 | 22 (9.6%) | 0 (0.0%) |
| $50,000 to $74,999 | 25 (10.9%) | 10 (100.0%) |
| $75,000 to $99,999 | 8 (3.5%) | 0 (0.0%) |
| $100,000 to $149,999 | 49 (21.3%) | 0 (0.0%) |
| $150,000 or more | 106 (46.1%) | 0 (0.0%) |
| Total | 230 (100.0%) | 10 (100.0%) |
Monthly Housing Cost Tiers in Casper Mountain
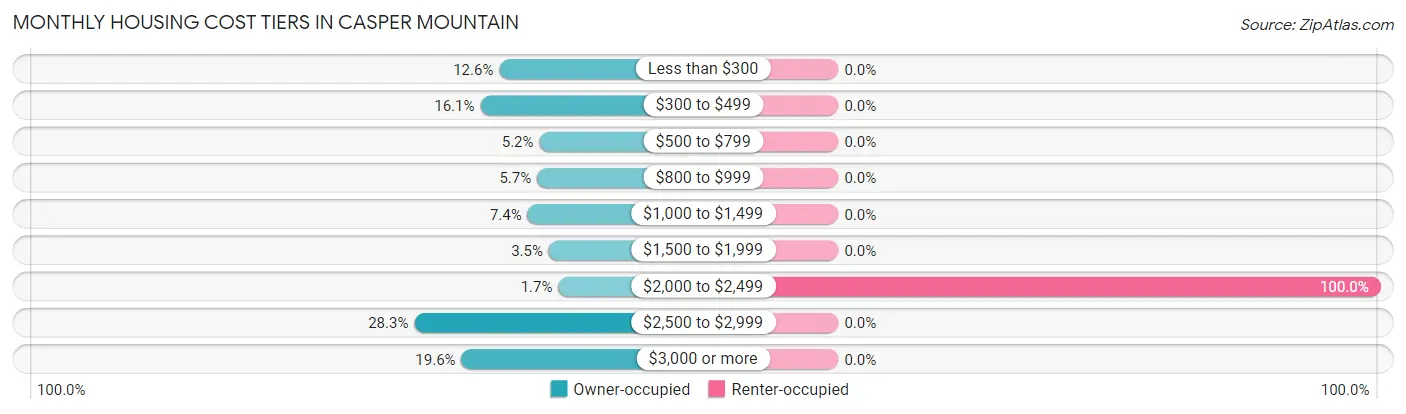
| Monthly Cost | Owner-occupied | Renter-occupied |
| Less than $300 | 29 (12.6%) | 0 (0.0%) |
| $300 to $499 | 37 (16.1%) | 0 (0.0%) |
| $500 to $799 | 12 (5.2%) | 0 (0.0%) |
| $800 to $999 | 13 (5.7%) | 0 (0.0%) |
| $1,000 to $1,499 | 17 (7.4%) | 0 (0.0%) |
| $1,500 to $1,999 | 8 (3.5%) | 0 (0.0%) |
| $2,000 to $2,499 | 4 (1.7%) | 10 (100.0%) |
| $2,500 to $2,999 | 65 (28.3%) | 0 (0.0%) |
| $3,000 or more | 45 (19.6%) | 0 (0.0%) |
| Total | 230 (100.0%) | 10 (100.0%) |
Physical Housing Characteristics in Casper Mountain
Housing Structures in Casper Mountain
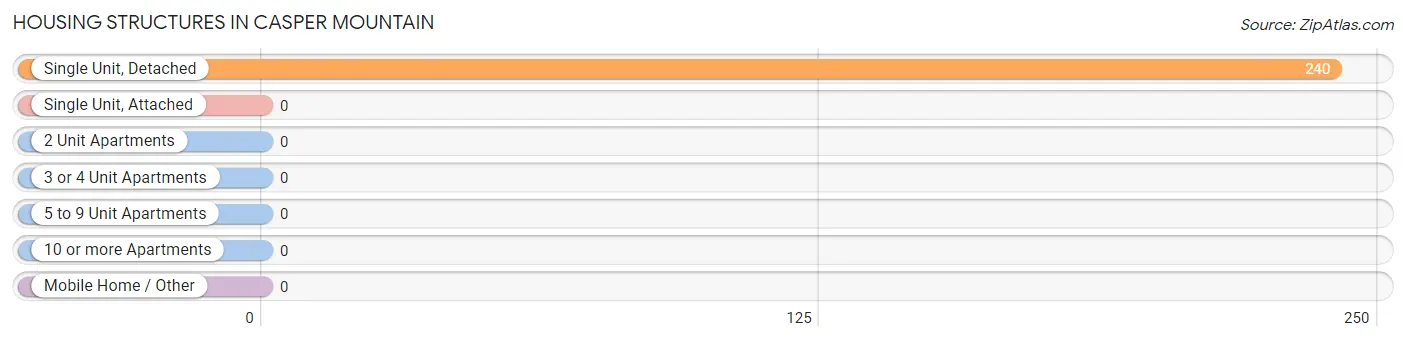
| Structure Type | # Housing Units | % Housing Units |
| Single Unit, Detached | 240 | 100.0% |
| Single Unit, Attached | 0 | 0.0% |
| 2 Unit Apartments | 0 | 0.0% |
| 3 or 4 Unit Apartments | 0 | 0.0% |
| 5 to 9 Unit Apartments | 0 | 0.0% |
| 10 or more Apartments | 0 | 0.0% |
| Mobile Home / Other | 0 | 0.0% |
| Total | 240 | 100.0% |
Housing Structures by Occupancy in Casper Mountain
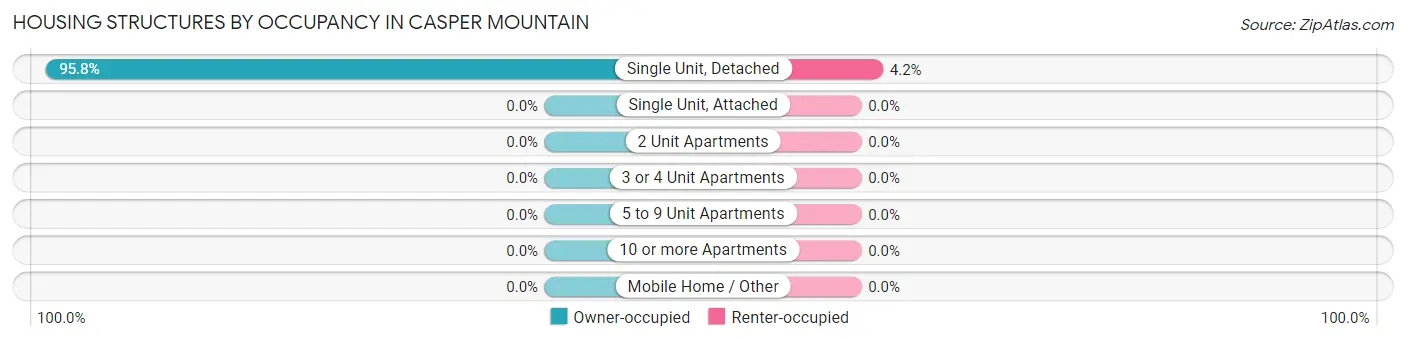
| Structure Type | Owner-occupied | Renter-occupied |
| Single Unit, Detached | 230 (95.8%) | 10 (4.2%) |
| Single Unit, Attached | 0 (0.0%) | 0 (0.0%) |
| 2 Unit Apartments | 0 (0.0%) | 0 (0.0%) |
| 3 or 4 Unit Apartments | 0 (0.0%) | 0 (0.0%) |
| 5 to 9 Unit Apartments | 0 (0.0%) | 0 (0.0%) |
| 10 or more Apartments | 0 (0.0%) | 0 (0.0%) |
| Mobile Home / Other | 0 (0.0%) | 0 (0.0%) |
| Total | 230 (95.8%) | 10 (4.2%) |
Housing Structures by Number of Rooms in Casper Mountain
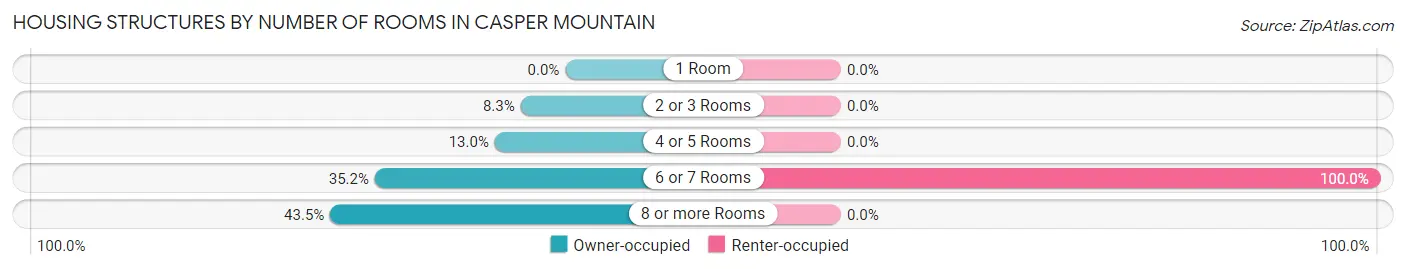
| Number of Rooms | Owner-occupied | Renter-occupied |
| 1 Room | 0 (0.0%) | 0 (0.0%) |
| 2 or 3 Rooms | 19 (8.3%) | 0 (0.0%) |
| 4 or 5 Rooms | 30 (13.0%) | 0 (0.0%) |
| 6 or 7 Rooms | 81 (35.2%) | 10 (100.0%) |
| 8 or more Rooms | 100 (43.5%) | 0 (0.0%) |
| Total | 230 (100.0%) | 10 (100.0%) |
Housing Structure by Heating Type in Casper Mountain
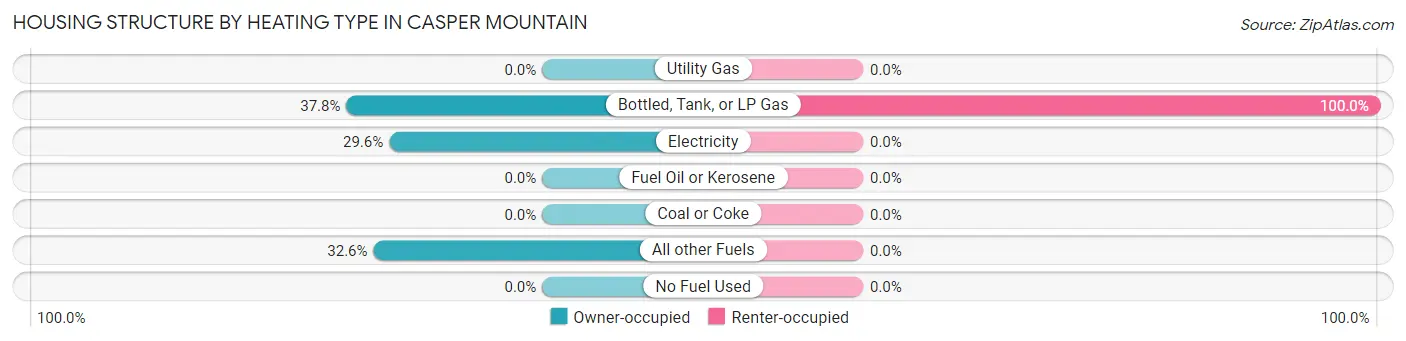
| Heating Type | Owner-occupied | Renter-occupied |
| Utility Gas | 0 (0.0%) | 0 (0.0%) |
| Bottled, Tank, or LP Gas | 87 (37.8%) | 10 (100.0%) |
| Electricity | 68 (29.6%) | 0 (0.0%) |
| Fuel Oil or Kerosene | 0 (0.0%) | 0 (0.0%) |
| Coal or Coke | 0 (0.0%) | 0 (0.0%) |
| All other Fuels | 75 (32.6%) | 0 (0.0%) |
| No Fuel Used | 0 (0.0%) | 0 (0.0%) |
| Total | 230 (100.0%) | 10 (100.0%) |
Household Vehicle Usage in Casper Mountain
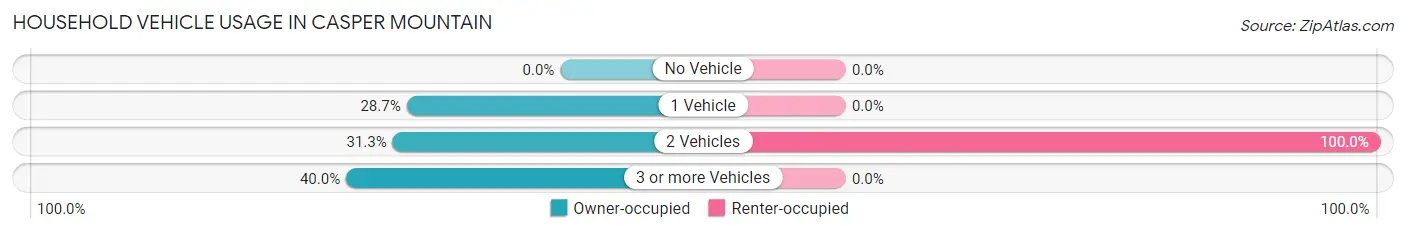
| Vehicles per Household | Owner-occupied | Renter-occupied |
| No Vehicle | 0 (0.0%) | 0 (0.0%) |
| 1 Vehicle | 66 (28.7%) | 0 (0.0%) |
| 2 Vehicles | 72 (31.3%) | 10 (100.0%) |
| 3 or more Vehicles | 92 (40.0%) | 0 (0.0%) |
| Total | 230 (100.0%) | 10 (100.0%) |
Real Estate & Mortgages in Casper Mountain
Real Estate and Mortgage Overview in Casper Mountain
| Characteristic | Without Mortgage | With Mortgage |
| Housing Units | 90 | 140 |
| Median Property Value | $321,400 | $469,800 |
| Median Household Income | $55,000 | $100 |
| Monthly Housing Costs | $370 | $45 |
| Real Estate Taxes | $1,250 | $0 |
Property Value by Mortgage Status in Casper Mountain
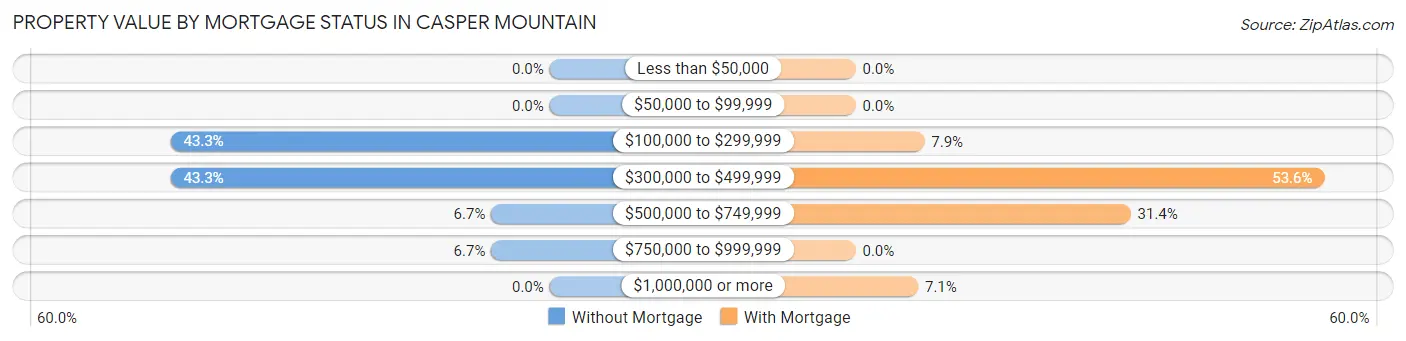
| Property Value | Without Mortgage | With Mortgage |
| Less than $50,000 | 0 (0.0%) | 0 (0.0%) |
| $50,000 to $99,999 | 0 (0.0%) | 0 (0.0%) |
| $100,000 to $299,999 | 39 (43.3%) | 11 (7.9%) |
| $300,000 to $499,999 | 39 (43.3%) | 75 (53.6%) |
| $500,000 to $749,999 | 6 (6.7%) | 44 (31.4%) |
| $750,000 to $999,999 | 6 (6.7%) | 0 (0.0%) |
| $1,000,000 or more | 0 (0.0%) | 10 (7.1%) |
| Total | 90 (100.0%) | 140 (100.0%) |
Household Income by Mortgage Status in Casper Mountain
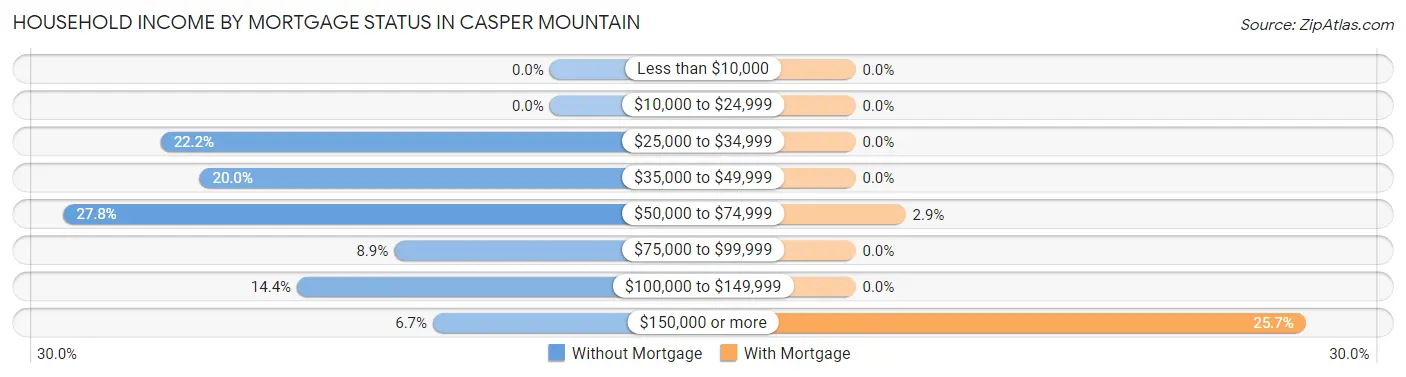
| Household Income | Without Mortgage | With Mortgage |
| Less than $10,000 | 0 (0.0%) | 0 (0.0%) |
| $10,000 to $24,999 | 0 (0.0%) | 0 (0.0%) |
| $25,000 to $34,999 | 20 (22.2%) | 0 (0.0%) |
| $35,000 to $49,999 | 18 (20.0%) | 0 (0.0%) |
| $50,000 to $74,999 | 25 (27.8%) | 4 (2.9%) |
| $75,000 to $99,999 | 8 (8.9%) | 0 (0.0%) |
| $100,000 to $149,999 | 13 (14.4%) | 0 (0.0%) |
| $150,000 or more | 6 (6.7%) | 36 (25.7%) |
| Total | 90 (100.0%) | 140 (100.0%) |
Property Value to Household Income Ratio in Casper Mountain
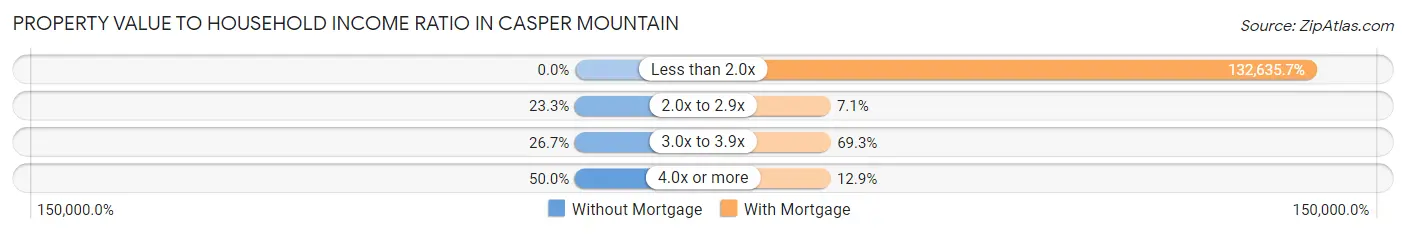
| Value-to-Income Ratio | Without Mortgage | With Mortgage |
| Less than 2.0x | 0 (0.0%) | 185,690 (132,635.7%) |
| 2.0x to 2.9x | 21 (23.3%) | 10 (7.1%) |
| 3.0x to 3.9x | 24 (26.7%) | 97 (69.3%) |
| 4.0x or more | 45 (50.0%) | 18 (12.9%) |
| Total | 90 (100.0%) | 140 (100.0%) |
Real Estate Taxes by Mortgage Status in Casper Mountain
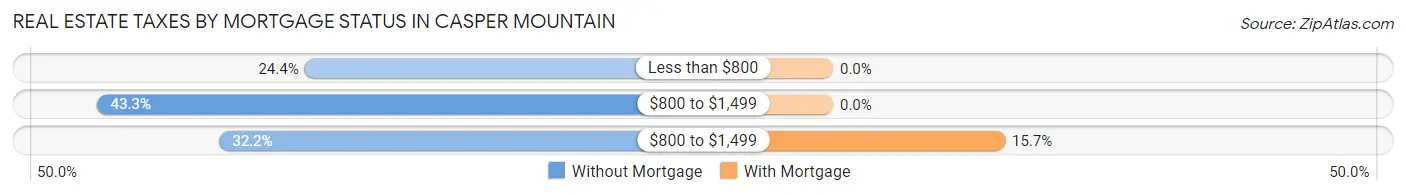
| Property Taxes | Without Mortgage | With Mortgage |
| Less than $800 | 22 (24.4%) | 0 (0.0%) |
| $800 to $1,499 | 39 (43.3%) | 0 (0.0%) |
| $800 to $1,499 | 29 (32.2%) | 22 (15.7%) |
| Total | 90 (100.0%) | 140 (100.0%) |
Health & Disability in Casper Mountain
Health Insurance Coverage by Age in Casper Mountain
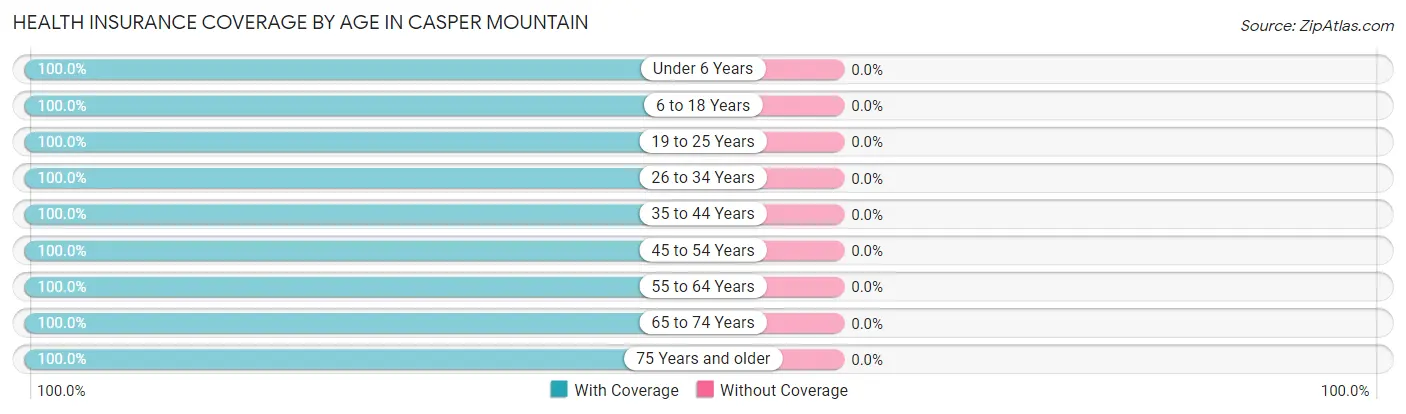
| Age Bracket | With Coverage | Without Coverage |
| Under 6 Years | 12 (100.0%) | 0 (0.0%) |
| 6 to 18 Years | 235 (100.0%) | 0 (0.0%) |
| 19 to 25 Years | 22 (100.0%) | 0 (0.0%) |
| 26 to 34 Years | 22 (100.0%) | 0 (0.0%) |
| 35 to 44 Years | 43 (100.0%) | 0 (0.0%) |
| 45 to 54 Years | 148 (100.0%) | 0 (0.0%) |
| 55 to 64 Years | 74 (100.0%) | 0 (0.0%) |
| 65 to 74 Years | 109 (100.0%) | 0 (0.0%) |
| 75 Years and older | 6 (100.0%) | 0 (0.0%) |
| Total | 671 (100.0%) | 0 (0.0%) |
Health Insurance Coverage by Citizenship Status in Casper Mountain

| Citizenship Status | With Coverage | Without Coverage |
| Native Born | 12 (100.0%) | 0 (0.0%) |
| Foreign Born, Citizen | 235 (100.0%) | 0 (0.0%) |
| Foreign Born, not a Citizen | 22 (100.0%) | 0 (0.0%) |
Health Insurance Coverage by Household Income in Casper Mountain
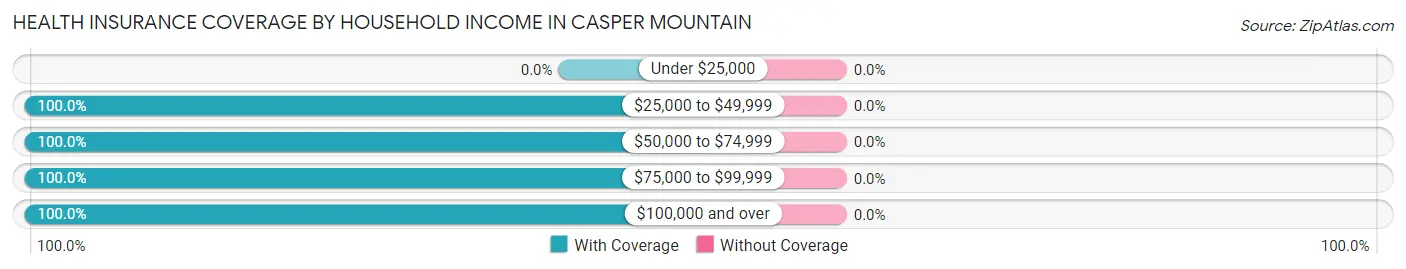
| Household Income | With Coverage | Without Coverage |
| Under $25,000 | 0 (0.0%) | 0 (0.0%) |
| $25,000 to $49,999 | 47 (100.0%) | 0 (0.0%) |
| $50,000 to $74,999 | 63 (100.0%) | 0 (0.0%) |
| $75,000 to $99,999 | 15 (100.0%) | 0 (0.0%) |
| $100,000 and over | 546 (100.0%) | 0 (0.0%) |
Public vs Private Health Insurance Coverage by Age in Casper Mountain
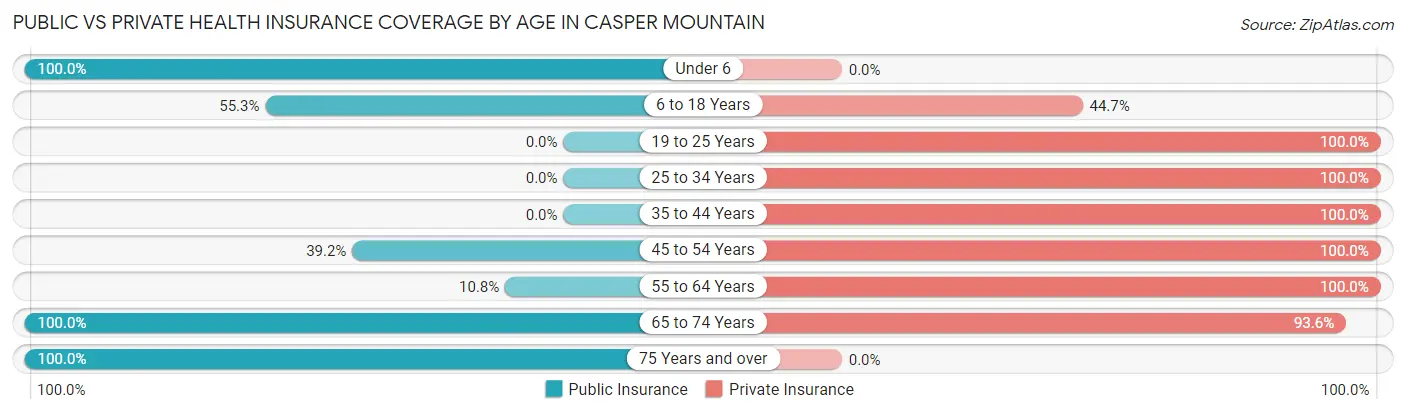
| Age Bracket | Public Insurance | Private Insurance |
| Under 6 | 12 (100.0%) | 0 (0.0%) |
| 6 to 18 Years | 130 (55.3%) | 105 (44.7%) |
| 19 to 25 Years | 0 (0.0%) | 22 (100.0%) |
| 25 to 34 Years | 0 (0.0%) | 22 (100.0%) |
| 35 to 44 Years | 0 (0.0%) | 43 (100.0%) |
| 45 to 54 Years | 58 (39.2%) | 148 (100.0%) |
| 55 to 64 Years | 8 (10.8%) | 74 (100.0%) |
| 65 to 74 Years | 109 (100.0%) | 102 (93.6%) |
| 75 Years and over | 6 (100.0%) | 0 (0.0%) |
| Total | 323 (48.1%) | 516 (76.9%) |
Disability Status by Sex by Age in Casper Mountain
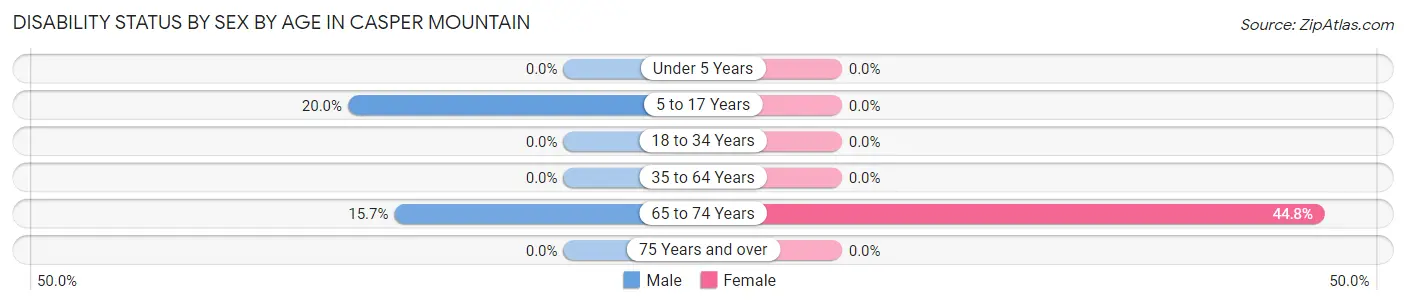
| Age Bracket | Male | Female |
| Under 5 Years | 0 (0.0%) | 0 (0.0%) |
| 5 to 17 Years | 25 (20.0%) | 0 (0.0%) |
| 18 to 34 Years | 0 (0.0%) | 0 (0.0%) |
| 35 to 64 Years | 0 (0.0%) | 0 (0.0%) |
| 65 to 74 Years | 8 (15.7%) | 26 (44.8%) |
| 75 Years and over | 0 (0.0%) | 0 (0.0%) |
Disability Class by Sex by Age in Casper Mountain
Disability Class: Hearing Difficulty
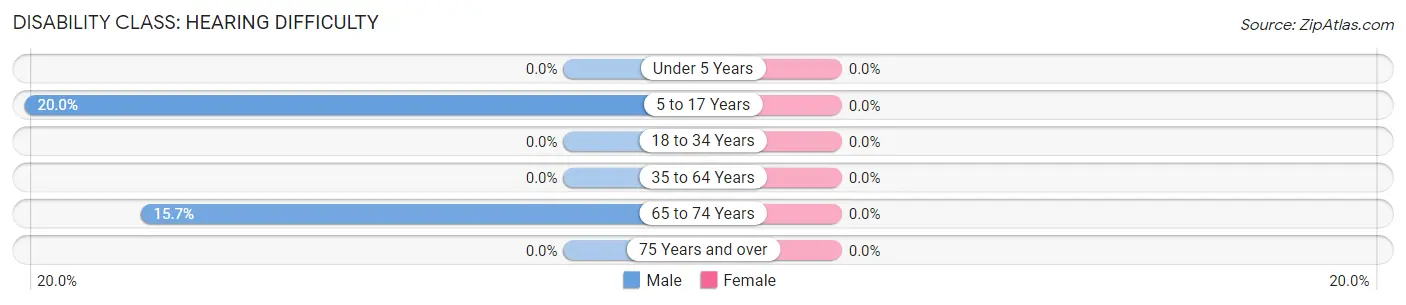
| Age Bracket | Male | Female |
| Under 5 Years | 0 (0.0%) | 0 (0.0%) |
| 5 to 17 Years | 25 (20.0%) | 0 (0.0%) |
| 18 to 34 Years | 0 (0.0%) | 0 (0.0%) |
| 35 to 64 Years | 0 (0.0%) | 0 (0.0%) |
| 65 to 74 Years | 8 (15.7%) | 0 (0.0%) |
| 75 Years and over | 0 (0.0%) | 0 (0.0%) |
Disability Class: Vision Difficulty
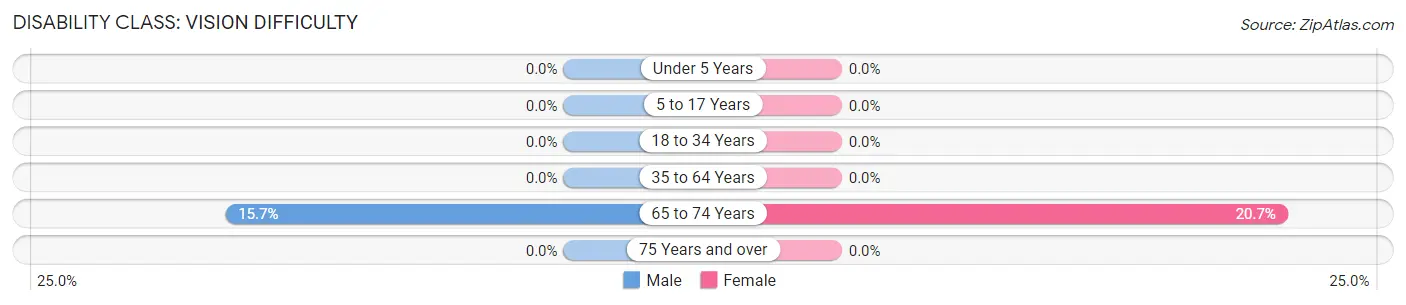
| Age Bracket | Male | Female |
| Under 5 Years | 0 (0.0%) | 0 (0.0%) |
| 5 to 17 Years | 0 (0.0%) | 0 (0.0%) |
| 18 to 34 Years | 0 (0.0%) | 0 (0.0%) |
| 35 to 64 Years | 0 (0.0%) | 0 (0.0%) |
| 65 to 74 Years | 8 (15.7%) | 12 (20.7%) |
| 75 Years and over | 0 (0.0%) | 0 (0.0%) |
Disability Class: Cognitive Difficulty
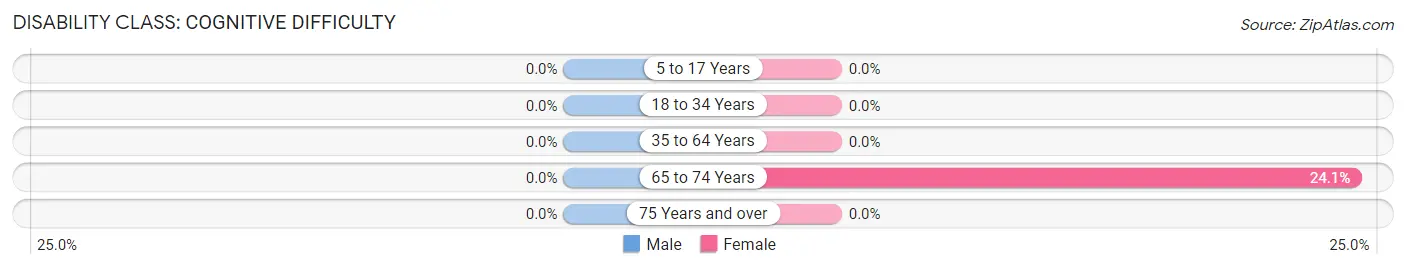
| Age Bracket | Male | Female |
| 5 to 17 Years | 0 (0.0%) | 0 (0.0%) |
| 18 to 34 Years | 0 (0.0%) | 0 (0.0%) |
| 35 to 64 Years | 0 (0.0%) | 0 (0.0%) |
| 65 to 74 Years | 0 (0.0%) | 14 (24.1%) |
| 75 Years and over | 0 (0.0%) | 0 (0.0%) |
Disability Class: Ambulatory Difficulty

| Age Bracket | Male | Female |
| 5 to 17 Years | 0 (0.0%) | 0 (0.0%) |
| 18 to 34 Years | 0 (0.0%) | 0 (0.0%) |
| 35 to 64 Years | 0 (0.0%) | 0 (0.0%) |
| 65 to 74 Years | 0 (0.0%) | 14 (24.1%) |
| 75 Years and over | 0 (0.0%) | 0 (0.0%) |
Disability Class: Self-Care Difficulty
| Age Bracket | Male | Female |
| 5 to 17 Years | 0 (0.0%) | 0 (0.0%) |
| 18 to 34 Years | 0 (0.0%) | 0 (0.0%) |
| 35 to 64 Years | 0 (0.0%) | 0 (0.0%) |
| 65 to 74 Years | 0 (0.0%) | 0 (0.0%) |
| 75 Years and over | 0 (0.0%) | 0 (0.0%) |
Technology Access in Casper Mountain
Computing Device Access in Casper Mountain
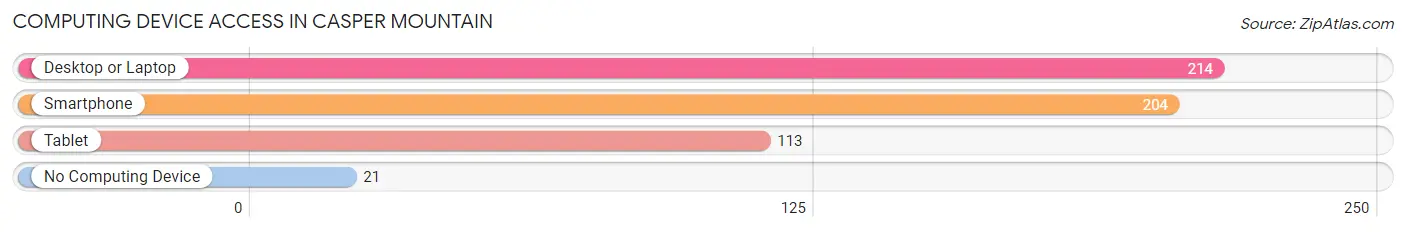
| Device Type | # Households | % Households |
| Desktop or Laptop | 214 | 89.2% |
| Smartphone | 204 | 85.0% |
| Tablet | 113 | 47.1% |
| No Computing Device | 21 | 8.7% |
| Total | 240 | 100.0% |
Internet Access in Casper Mountain
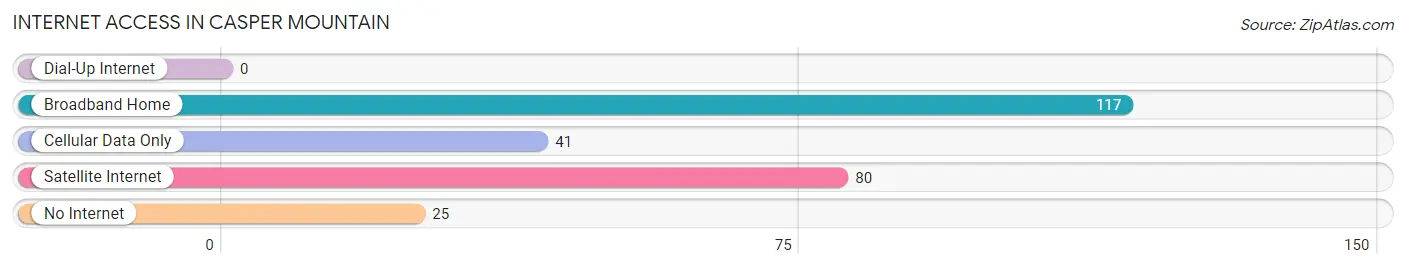
| Internet Type | # Households | % Households |
| Dial-Up Internet | 0 | 0.0% |
| Broadband Home | 117 | 48.7% |
| Cellular Data Only | 41 | 17.1% |
| Satellite Internet | 80 | 33.3% |
| No Internet | 25 | 10.4% |
| Total | 240 | 100.0% |
Casper Mountain Summary
Casper Mountain is a mountain located in Natrona County, Wyoming, United States. It is part of the Laramie Mountains and is the highest peak in the range, with an elevation of 8,127 feet (2,475 m). The mountain is located just north of the city of Casper, Wyoming, and is a popular destination for outdoor recreation.
History
The area around Casper Mountain has been inhabited for thousands of years by various Native American tribes, including the Arapaho, Cheyenne, and Shoshone. The mountain was first explored by Europeans in the early 1800s, when fur trappers and traders began to explore the area. In 1867, the Union Pacific Railroad was built through the area, and the town of Casper was established in 1888.
The mountain has been a popular destination for outdoor recreation since the early 1900s. In the 1920s, the Casper Mountain Ski Club was formed, and the first ski lift was built in the 1930s. The ski area was expanded in the 1950s, and the Casper Mountain Ski Area was established in the 1960s.
Geography
Casper Mountain is located in Natrona County, Wyoming, and is part of the Laramie Mountains. The mountain is 8,127 feet (2,475 m) in elevation, making it the highest peak in the range. The mountain is located just north of the city of Casper, Wyoming, and is surrounded by the Casper Mountain Wilderness Area.
The mountain is composed of sedimentary rocks, including sandstone, shale, and limestone. The mountain is covered in a variety of vegetation, including sagebrush, grasses, and juniper trees. The mountain is home to a variety of wildlife, including mule deer, elk, bighorn sheep, and mountain lions.
Economy
The economy of Casper Mountain is largely based on tourism and outdoor recreation. The mountain is a popular destination for skiing, snowboarding, hiking, camping, and mountain biking. The Casper Mountain Ski Area is a popular destination for skiing and snowboarding, and the mountain is also home to several campgrounds and hiking trails.
The mountain is also home to several businesses, including restaurants, hotels, and retail stores. The mountain is also home to several oil and gas wells, and the area is a popular destination for hunting and fishing.
Demographics
As of the 2010 census, the population of Casper Mountain was 1,845. The population is largely white (94.3%), with small percentages of Native American (2.2%), Asian (1.2%), and African American (0.7%) residents. The median household income is $50,000, and the median age is 44.
The mountain is home to several small communities, including the towns of Casper Mountain, Edgerton, and Powder River. The mountain is also home to several small unincorporated communities, including the towns of Muddy Gap, Powder River, and South Pass.
Common Questions
What is Per Capita Income in Casper Mountain?
Per Capita income in Casper Mountain is $58,020.
What is the Median Family Income in Casper Mountain?
Median Family Income in Casper Mountain is $185,172.
What is the Median Household income in Casper Mountain?
Median Household Income in Casper Mountain is $140,556.
What is Inequality or Gini Index in Casper Mountain?
Inequality or Gini Index in Casper Mountain is 0.42.
What is the Total Population of Casper Mountain?
Total Population of Casper Mountain is 671.
What is the Total Male Population of Casper Mountain?
Total Male Population of Casper Mountain is 349.
What is the Total Female Population of Casper Mountain?
Total Female Population of Casper Mountain is 322.
What is the Ratio of Males per 100 Females in Casper Mountain?
There are 108.39 Males per 100 Females in Casper Mountain.
What is the Ratio of Females per 100 Males in Casper Mountain?
There are 92.26 Females per 100 Males in Casper Mountain.
What is the Median Population Age in Casper Mountain?
Median Population Age in Casper Mountain is 45.2 Years.
What is the Average Family Size in Casper Mountain
Average Family Size in Casper Mountain is 3.5 People.
What is the Average Household Size in Casper Mountain
Average Household Size in Casper Mountain is 2.8 People.
How Large is the Labor Force in Casper Mountain?
There are 320 People in the Labor Forcein in Casper Mountain.
What is the Percentage of People in the Labor Force in Casper Mountain?
65.3% of People are in the Labor Force in Casper Mountain.