Williamstown, WV Map & Demographics
Williamstown Map
Williamstown Overview
$42,496
PER CAPITA INCOME
$86,735
AVG FAMILY INCOME
$68,029
AVG HOUSEHOLD INCOME
33.1%
WAGE / INCOME GAP [ % ]
66.9¢/ $1
WAGE / INCOME GAP [ $ ]
0.50
INEQUALITY / GINI INDEX
2,980
TOTAL POPULATION
1,388
MALE POPULATION
1,592
FEMALE POPULATION
87.19
MALES / 100 FEMALES
114.70
FEMALES / 100 MALES
49.1
MEDIAN AGE
2.6
AVG FAMILY SIZE
2.1
AVG HOUSEHOLD SIZE
1,471
LABOR FORCE [ PEOPLE ]
59.2%
PERCENT IN LABOR FORCE
2.6%
UNEMPLOYMENT RATE
Williamstown Zip Codes
Williamstown Area Codes
Income in Williamstown
Income Overview in Williamstown
Per Capita Income in Williamstown is $42,496, while median incomes of families and households are $86,735 and $68,029 respectively.
| Characteristic | Number | Measure |
| Per Capita Income | 2,980 | $42,496 |
| Median Family Income | 944 | $86,735 |
| Mean Family Income | 944 | $117,566 |
| Median Household Income | 1,429 | $68,029 |
| Mean Household Income | 1,429 | $89,953 |
| Income Deficit | 944 | $0 |
| Wage / Income Gap (%) | 2,980 | 33.13% |
| Wage / Income Gap ($) | 2,980 | 66.87¢ per $1 |
| Gini / Inequality Index | 2,980 | 0.50 |
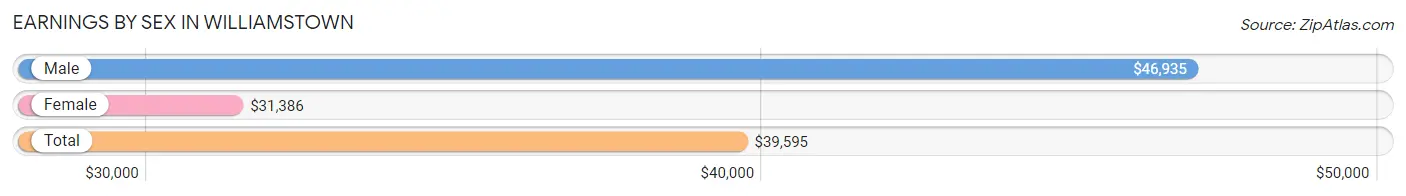
Earnings by Sex in Williamstown
Average Earnings in Williamstown are $39,595, $46,935 for men and $31,386 for women, a difference of 33.1%.
| Sex | Number | Average Earnings |
| Male | 729 (50.2%) | $46,935 |
| Female | 723 (49.8%) | $31,386 |
| Total | 1,452 (100.0%) | $39,595 |
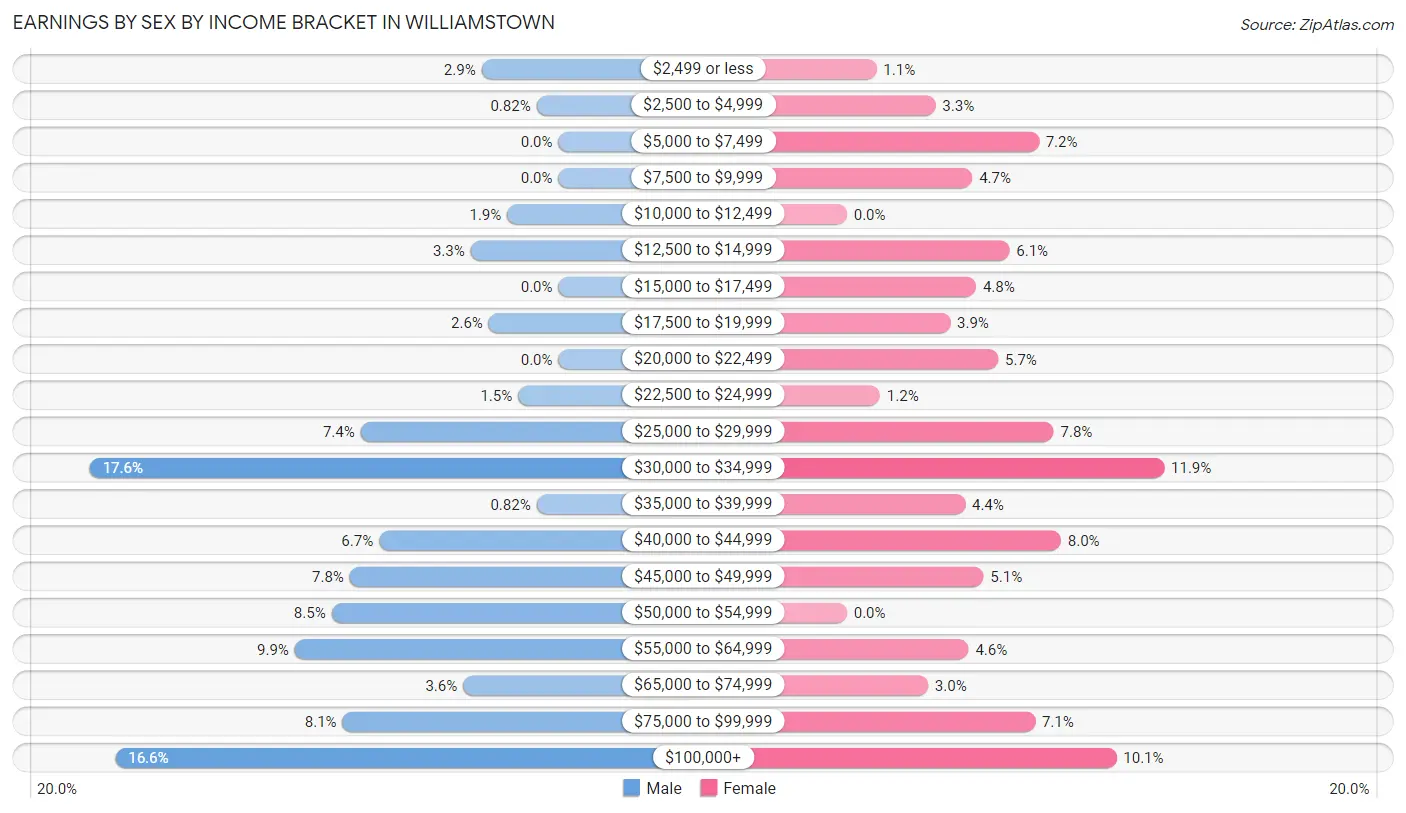
Earnings by Sex by Income Bracket in Williamstown
The most common earnings brackets in Williamstown are $30,000 to $34,999 for men (128 | 17.6%) and $30,000 to $34,999 for women (86 | 11.9%).
| Income | Male | Female |
| $2,499 or less | 21 (2.9%) | 8 (1.1%) |
| $2,500 to $4,999 | 6 (0.8%) | 24 (3.3%) |
| $5,000 to $7,499 | 0 (0.0%) | 52 (7.2%) |
| $7,500 to $9,999 | 0 (0.0%) | 34 (4.7%) |
| $10,000 to $12,499 | 14 (1.9%) | 0 (0.0%) |
| $12,500 to $14,999 | 24 (3.3%) | 44 (6.1%) |
| $15,000 to $17,499 | 0 (0.0%) | 35 (4.8%) |
| $17,500 to $19,999 | 19 (2.6%) | 28 (3.9%) |
| $20,000 to $22,499 | 0 (0.0%) | 41 (5.7%) |
| $22,500 to $24,999 | 11 (1.5%) | 9 (1.2%) |
| $25,000 to $29,999 | 54 (7.4%) | 56 (7.7%) |
| $30,000 to $34,999 | 128 (17.6%) | 86 (11.9%) |
| $35,000 to $39,999 | 6 (0.8%) | 32 (4.4%) |
| $40,000 to $44,999 | 49 (6.7%) | 58 (8.0%) |
| $45,000 to $49,999 | 57 (7.8%) | 37 (5.1%) |
| $50,000 to $54,999 | 62 (8.5%) | 0 (0.0%) |
| $55,000 to $64,999 | 72 (9.9%) | 33 (4.6%) |
| $65,000 to $74,999 | 26 (3.6%) | 22 (3.0%) |
| $75,000 to $99,999 | 59 (8.1%) | 51 (7.0%) |
| $100,000+ | 121 (16.6%) | 73 (10.1%) |
| Total | 729 (100.0%) | 723 (100.0%) |
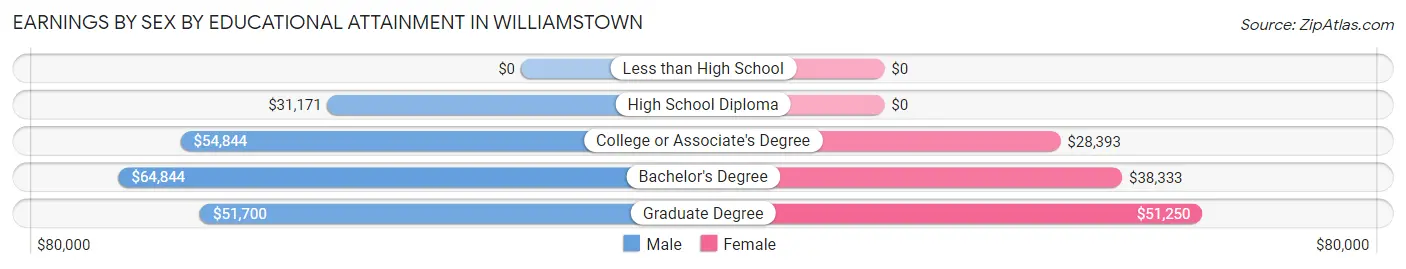
Earnings by Sex by Educational Attainment in Williamstown
Average earnings in Williamstown are $49,333 for men and $32,114 for women, a difference of 34.9%. Men with an educational attainment of bachelor's degree enjoy the highest average annual earnings of $64,844, while those with high school diploma education earn the least with $31,171. Women with an educational attainment of graduate degree earn the most with the average annual earnings of $51,250, while those with college or associate's degree education have the smallest earnings of $28,393.
| Educational Attainment | Male Income | Female Income |
| Less than High School | - | - |
| High School Diploma | $31,171 | $0 |
| College or Associate's Degree | $54,844 | $28,393 |
| Bachelor's Degree | $64,844 | $38,333 |
| Graduate Degree | $51,700 | $51,250 |
| Total | $49,333 | $32,114 |
Family Income in Williamstown
Family Income Brackets in Williamstown
According to the Williamstown family income data, there are 262 families falling into the $75,000 to $99,999 income range, which is the most common income bracket and makes up 27.8% of all families.
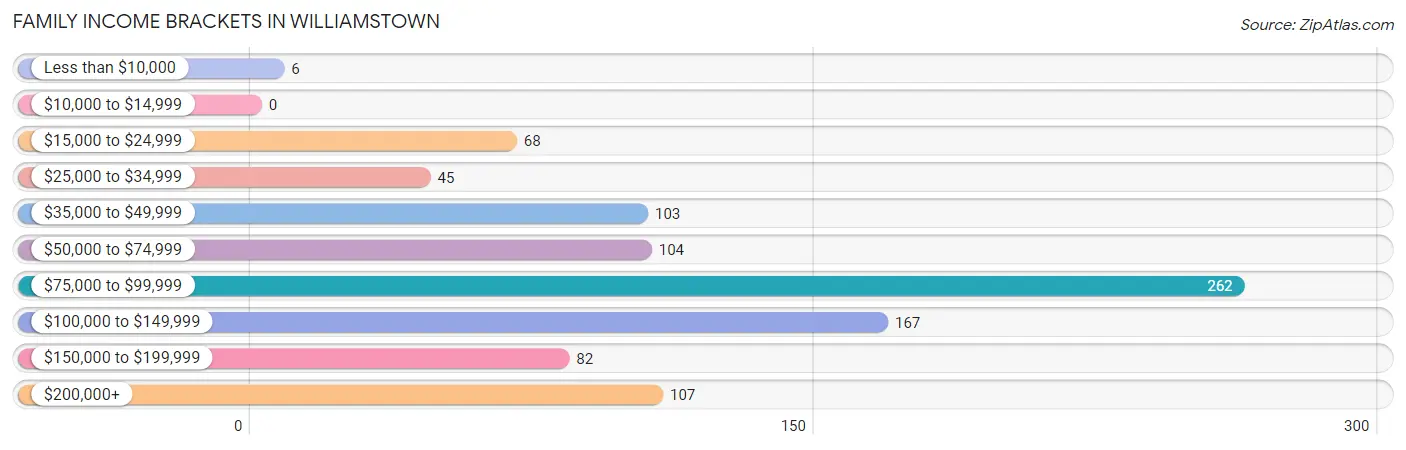
| Income Bracket | # Families | % Families |
| Less than $10,000 | 6 | 0.6% |
| $10,000 to $14,999 | 0 | 0.0% |
| $15,000 to $24,999 | 68 | 7.2% |
| $25,000 to $34,999 | 45 | 4.8% |
| $35,000 to $49,999 | 103 | 10.9% |
| $50,000 to $74,999 | 104 | 11.0% |
| $75,000 to $99,999 | 262 | 27.8% |
| $100,000 to $149,999 | 167 | 17.7% |
| $150,000 to $199,999 | 82 | 8.7% |
| $200,000+ | 107 | 11.3% |
Family Income by Famaliy Size in Williamstown
4-person families (118 | 12.5%) account for the highest median family income in Williamstown with $169,342 per family, while 4-person families (118 | 12.5%) have the highest median income of $42,336 per family member.
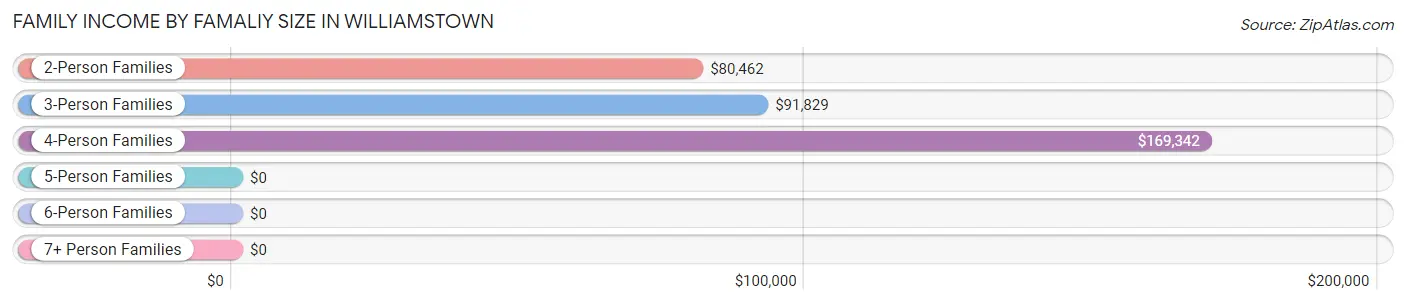
| Income Bracket | # Families | Median Income |
| 2-Person Families | 619 (65.6%) | $80,462 |
| 3-Person Families | 169 (17.9%) | $91,829 |
| 4-Person Families | 118 (12.5%) | $169,342 |
| 5-Person Families | 38 (4.0%) | $0 |
| 6-Person Families | 0 (0.0%) | $0 |
| 7+ Person Families | 0 (0.0%) | $0 |
| Total | 944 (100.0%) | $86,735 |
Family Income by Number of Earners in Williamstown
The median family income in Williamstown is $86,735, with families comprising 3+ earners (119) having the highest median family income of $113,750, while families with no earners (223) have the lowest median family income of $71,146, accounting for 12.6% and 23.6% of families, respectively.
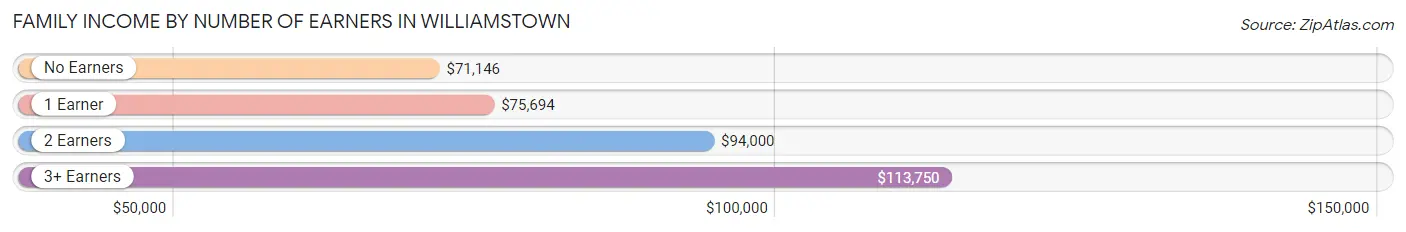
| Number of Earners | # Families | Median Income |
| No Earners | 223 (23.6%) | $71,146 |
| 1 Earner | 328 (34.7%) | $75,694 |
| 2 Earners | 274 (29.0%) | $94,000 |
| 3+ Earners | 119 (12.6%) | $113,750 |
| Total | 944 (100.0%) | $86,735 |
Household Income in Williamstown
Household Income Brackets in Williamstown
With 280 households falling in the category, the $75,000 to $99,999 income range is the most frequent in Williamstown, accounting for 19.6% of all households. In contrast, only 70 households (4.9%) fall into the less than $10,000 income bracket, making it the least populous group.
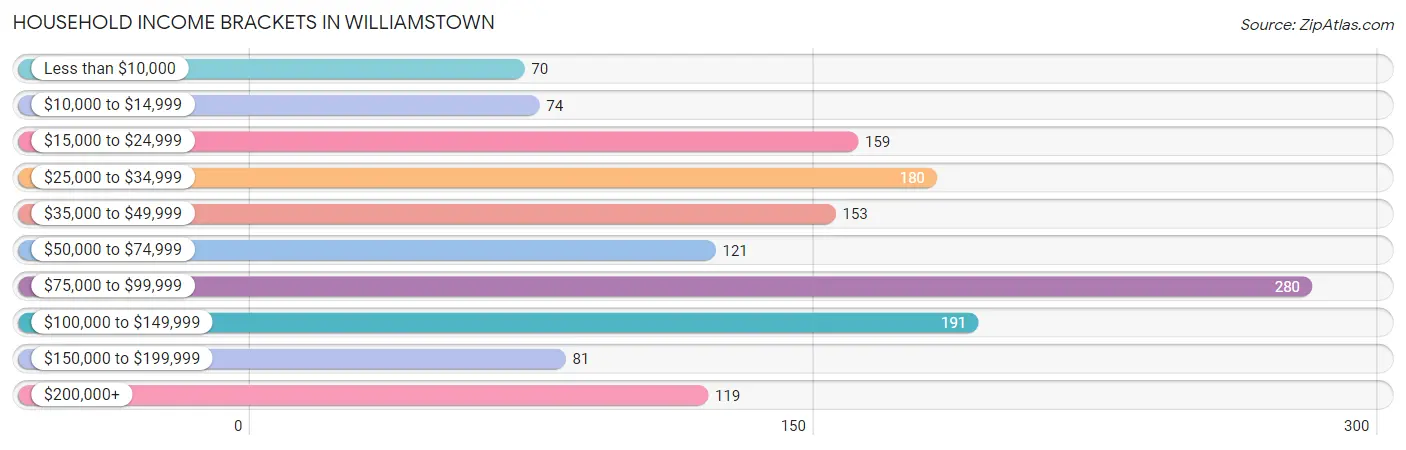
| Income Bracket | # Households | % Households |
| Less than $10,000 | 70 | 4.9% |
| $10,000 to $14,999 | 74 | 5.2% |
| $15,000 to $24,999 | 159 | 11.1% |
| $25,000 to $34,999 | 180 | 12.6% |
| $35,000 to $49,999 | 153 | 10.7% |
| $50,000 to $74,999 | 121 | 8.5% |
| $75,000 to $99,999 | 280 | 19.6% |
| $100,000 to $149,999 | 191 | 13.4% |
| $150,000 to $199,999 | 81 | 5.7% |
| $200,000+ | 119 | 8.3% |
Household Income by Householder Age in Williamstown
The median household income in Williamstown is $68,029, with the highest median household income of $76,944 found in the 45 to 64 years age bracket for the primary householder. A total of 568 households (39.8%) fall into this category. Meanwhile, the 15 to 24 years age bracket for the primary householder has the lowest median household income of $0, with 28 households (2.0%) in this group.
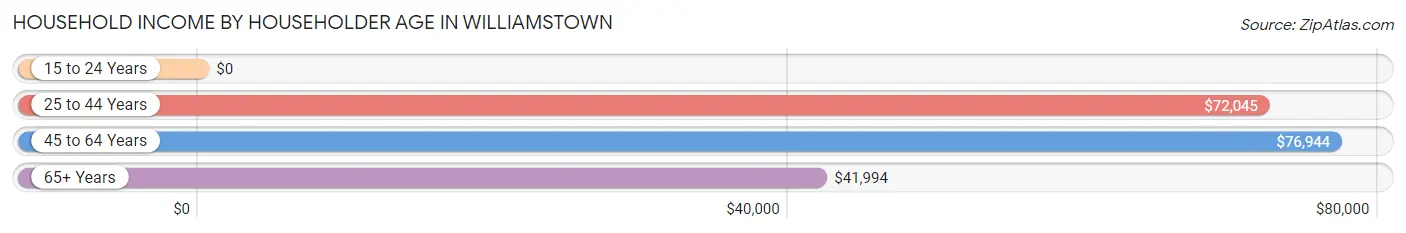
| Income Bracket | # Households | Median Income |
| 15 to 24 Years | 28 (2.0%) | $0 |
| 25 to 44 Years | 368 (25.8%) | $72,045 |
| 45 to 64 Years | 568 (39.8%) | $76,944 |
| 65+ Years | 465 (32.5%) | $41,994 |
| Total | 1,429 (100.0%) | $68,029 |
Poverty in Williamstown
Income Below Poverty by Sex and Age in Williamstown
With 5.6% poverty level for males and 8.6% for females among the residents of Williamstown, 16 and 17 year old males and 12 to 14 year old females are the most vulnerable to poverty, with 5 males (29.4%) and 22 females (30.1%) in their respective age groups living below the poverty level.
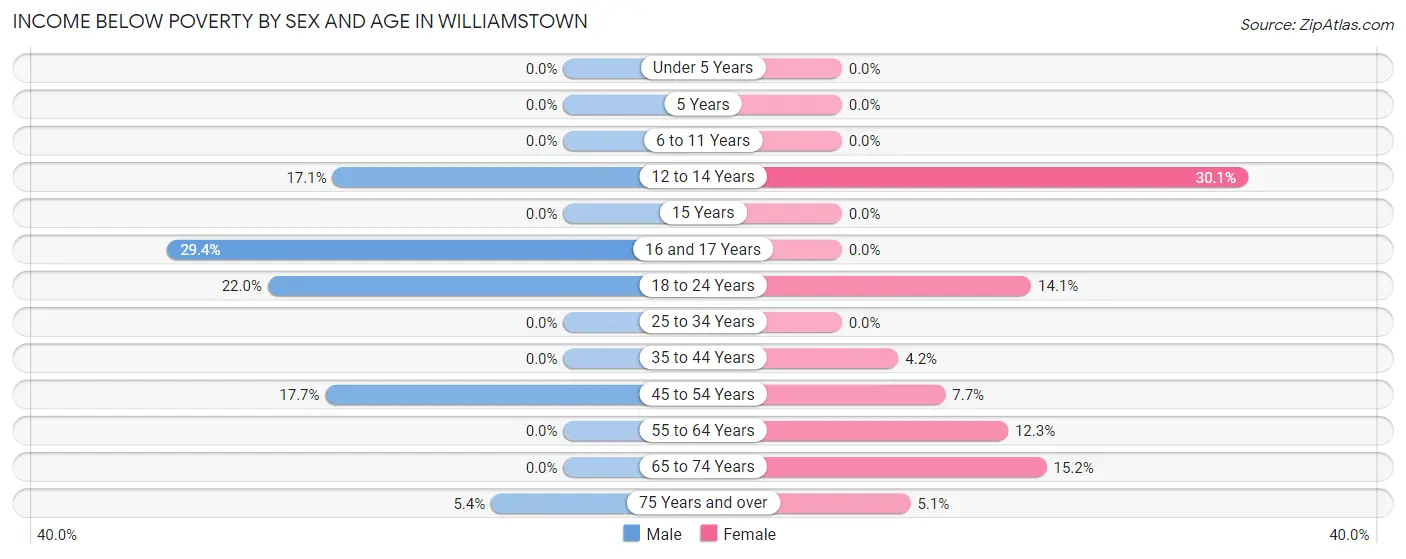
| Age Bracket | Male | Female |
| Under 5 Years | 0 (0.0%) | 0 (0.0%) |
| 5 Years | 0 (0.0%) | 0 (0.0%) |
| 6 to 11 Years | 0 (0.0%) | 0 (0.0%) |
| 12 to 14 Years | 6 (17.1%) | 22 (30.1%) |
| 15 Years | 0 (0.0%) | 0 (0.0%) |
| 16 and 17 Years | 5 (29.4%) | 0 (0.0%) |
| 18 to 24 Years | 9 (22.0%) | 9 (14.1%) |
| 25 to 34 Years | 0 (0.0%) | 0 (0.0%) |
| 35 to 44 Years | 0 (0.0%) | 6 (4.2%) |
| 45 to 54 Years | 50 (17.7%) | 16 (7.7%) |
| 55 to 64 Years | 0 (0.0%) | 29 (12.3%) |
| 65 to 74 Years | 0 (0.0%) | 45 (15.2%) |
| 75 Years and over | 8 (5.4%) | 8 (5.1%) |
| Total | 78 (5.6%) | 135 (8.6%) |
Income Above Poverty by Sex and Age in Williamstown
According to the poverty statistics in Williamstown, males aged under 5 years and females aged under 5 years are the age groups that are most secure financially, with 100.0% of males and 100.0% of females in these age groups living above the poverty line.
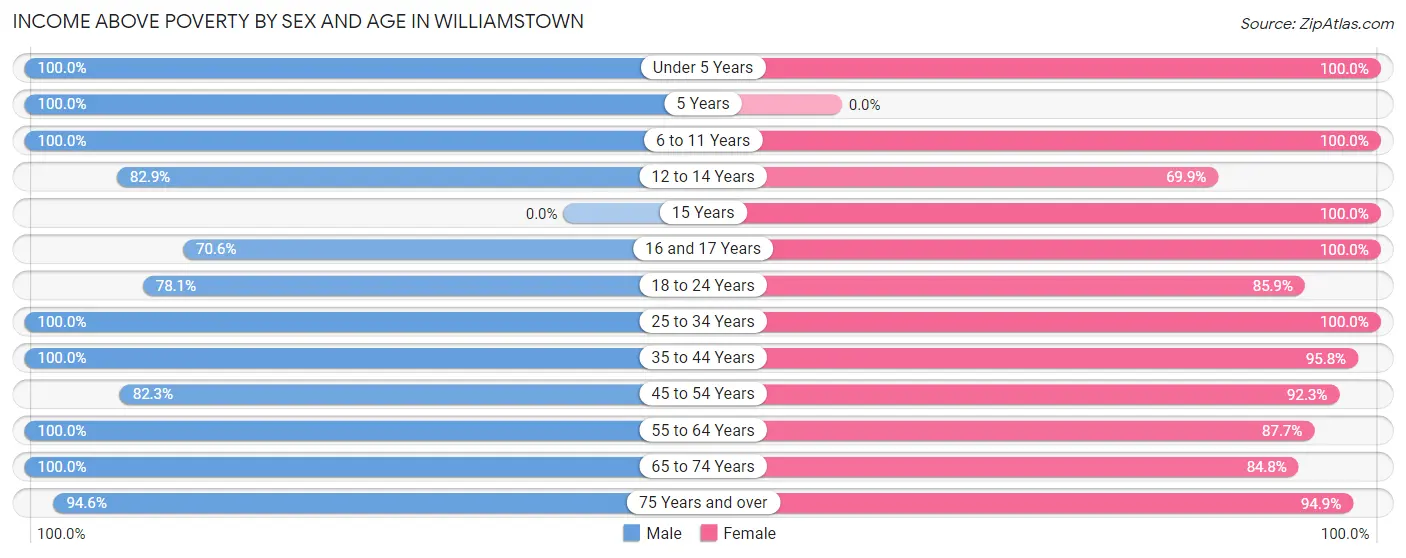
| Age Bracket | Male | Female |
| Under 5 Years | 59 (100.0%) | 58 (100.0%) |
| 5 Years | 15 (100.0%) | 0 (0.0%) |
| 6 to 11 Years | 128 (100.0%) | 91 (100.0%) |
| 12 to 14 Years | 29 (82.9%) | 51 (69.9%) |
| 15 Years | 0 (0.0%) | 22 (100.0%) |
| 16 and 17 Years | 12 (70.6%) | 30 (100.0%) |
| 18 to 24 Years | 32 (78.0%) | 55 (85.9%) |
| 25 to 34 Years | 225 (100.0%) | 201 (100.0%) |
| 35 to 44 Years | 102 (100.0%) | 137 (95.8%) |
| 45 to 54 Years | 233 (82.3%) | 192 (92.3%) |
| 55 to 64 Years | 164 (100.0%) | 206 (87.7%) |
| 65 to 74 Years | 170 (100.0%) | 251 (84.8%) |
| 75 Years and over | 141 (94.6%) | 149 (94.9%) |
| Total | 1,310 (94.4%) | 1,443 (91.4%) |
Income Below Poverty Among Married-Couple Families in Williamstown
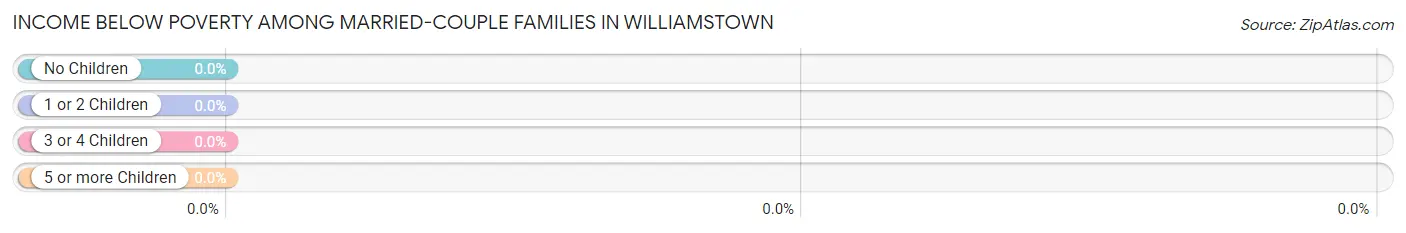
| Children | Above Poverty | Below Poverty |
| No Children | 599 (100.0%) | 0 (0.0%) |
| 1 or 2 Children | 145 (100.0%) | 0 (0.0%) |
| 3 or 4 Children | 28 (100.0%) | 0 (0.0%) |
| 5 or more Children | 0 (0.0%) | 0 (0.0%) |
| Total | 772 (100.0%) | 0 (0.0%) |
Income Below Poverty Among Single-Parent Households in Williamstown
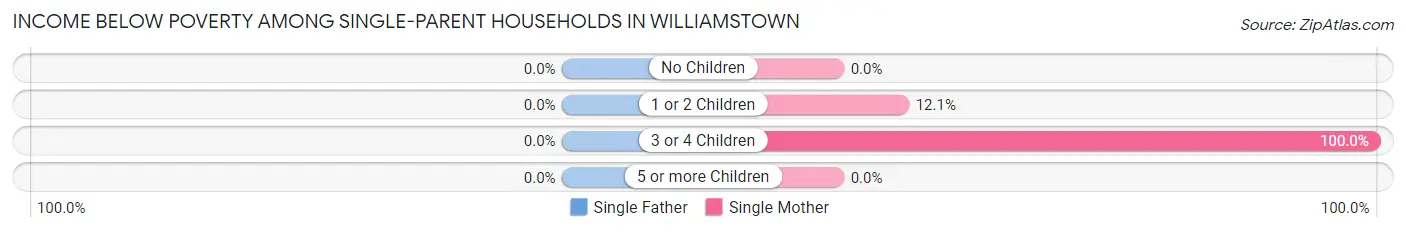
| Children | Single Father | Single Mother |
| No Children | 0 (0.0%) | 0 (0.0%) |
| 1 or 2 Children | 0 (0.0%) | 12 (12.1%) |
| 3 or 4 Children | 0 (0.0%) | 6 (100.0%) |
| 5 or more Children | 0 (0.0%) | 0 (0.0%) |
| Total | 0 (0.0%) | 18 (14.0%) |
Income Below Poverty Among Married-Couple vs Single-Parent Households in Williamstown
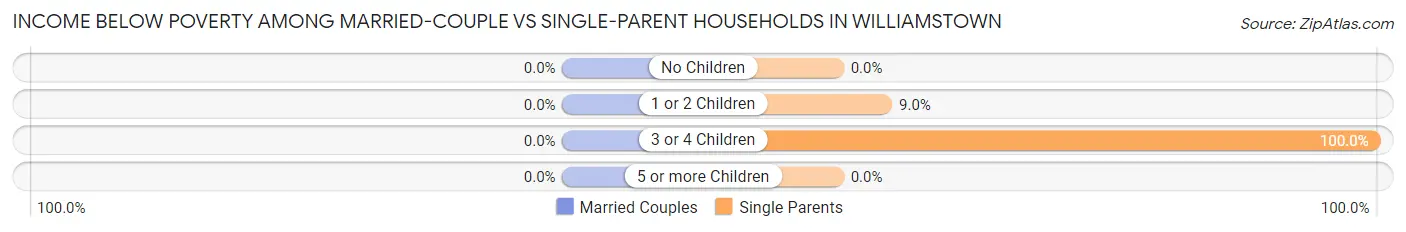
| Children | Married-Couple Families | Single-Parent Households |
| No Children | 0 (0.0%) | 0 (0.0%) |
| 1 or 2 Children | 0 (0.0%) | 12 (9.0%) |
| 3 or 4 Children | 0 (0.0%) | 6 (100.0%) |
| 5 or more Children | 0 (0.0%) | 0 (0.0%) |
| Total | 0 (0.0%) | 18 (10.5%) |
Race in Williamstown
The most populous races in Williamstown are White / Caucasian (2,943 | 98.8%), Two or more Races (33 | 1.1%), and Hispanic or Latino (10 | 0.3%).
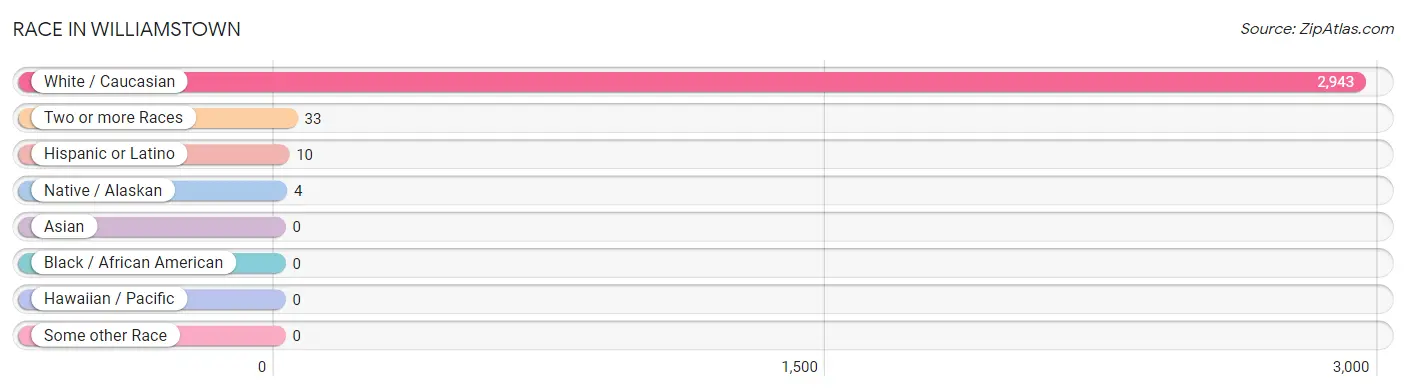
| Race | # Population | % Population |
| Asian | 0 | 0.0% |
| Black / African American | 0 | 0.0% |
| Hawaiian / Pacific | 0 | 0.0% |
| Hispanic or Latino | 10 | 0.3% |
| Native / Alaskan | 4 | 0.1% |
| White / Caucasian | 2,943 | 98.8% |
| Two or more Races | 33 | 1.1% |
| Some other Race | 0 | 0.0% |
| Total | 2,980 | 100.0% |
Ancestry in Williamstown
The most populous ancestries reported in Williamstown are German (507 | 17.0%), English (482 | 16.2%), American (425 | 14.3%), Irish (415 | 13.9%), and European (163 | 5.5%), together accounting for 66.8% of all Williamstown residents.
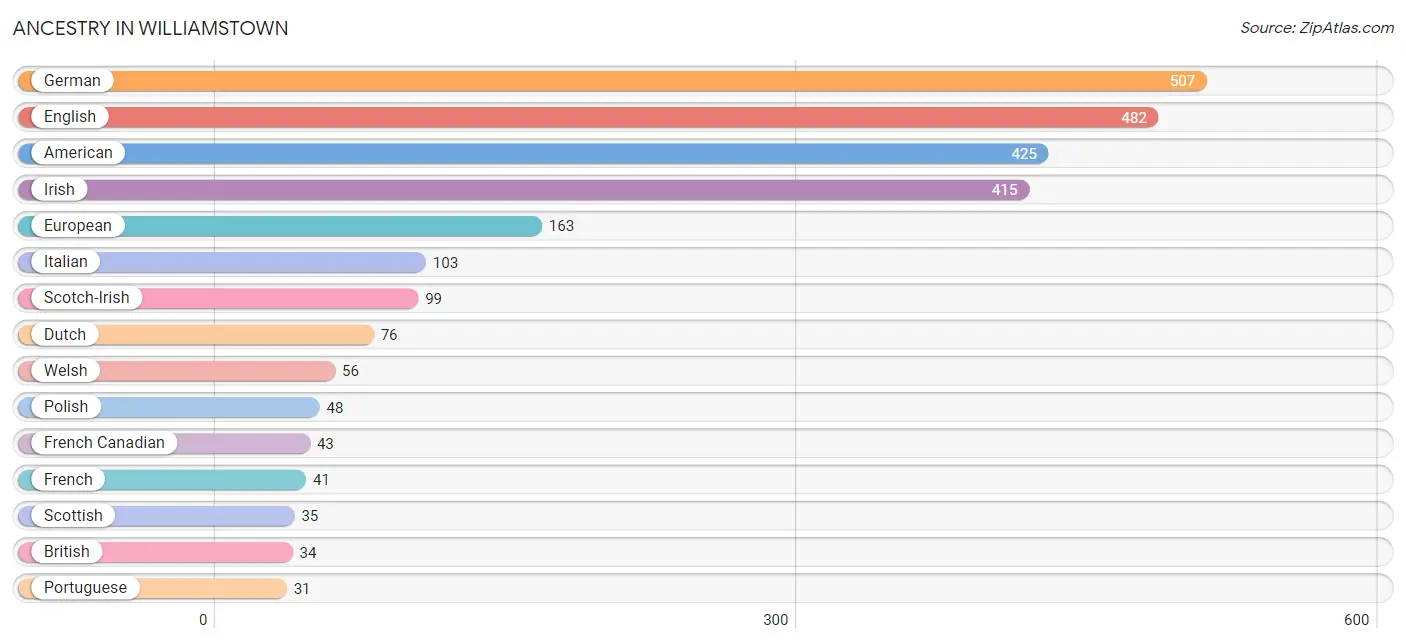
| Ancestry | # Population | % Population |
| American | 425 | 14.3% |
| Arab | 7 | 0.2% |
| Austrian | 27 | 0.9% |
| British | 34 | 1.1% |
| Cherokee | 12 | 0.4% |
| Dutch | 76 | 2.5% |
| English | 482 | 16.2% |
| European | 163 | 5.5% |
| French | 41 | 1.4% |
| French Canadian | 43 | 1.4% |
| German | 507 | 17.0% |
| Hungarian | 14 | 0.5% |
| Irish | 415 | 13.9% |
| Italian | 103 | 3.5% |
| Mexican | 10 | 0.3% |
| Polish | 48 | 1.6% |
| Portuguese | 31 | 1.0% |
| Scotch-Irish | 99 | 3.3% |
| Scottish | 35 | 1.2% |
| Swedish | 28 | 0.9% |
| Swiss | 29 | 1.0% |
| Turkish | 11 | 0.4% |
| Welsh | 56 | 1.9% | View All 23 Rows |
Immigrants in Williamstown

| Immigration Origin | # Population | % Population | View All 0 Rows |
Sex and Age in Williamstown
Sex and Age in Williamstown
The most populous age groups in Williamstown are 25 to 29 Years (184 | 13.3%) for men and 70 to 74 Years (153 | 9.6%) for women.
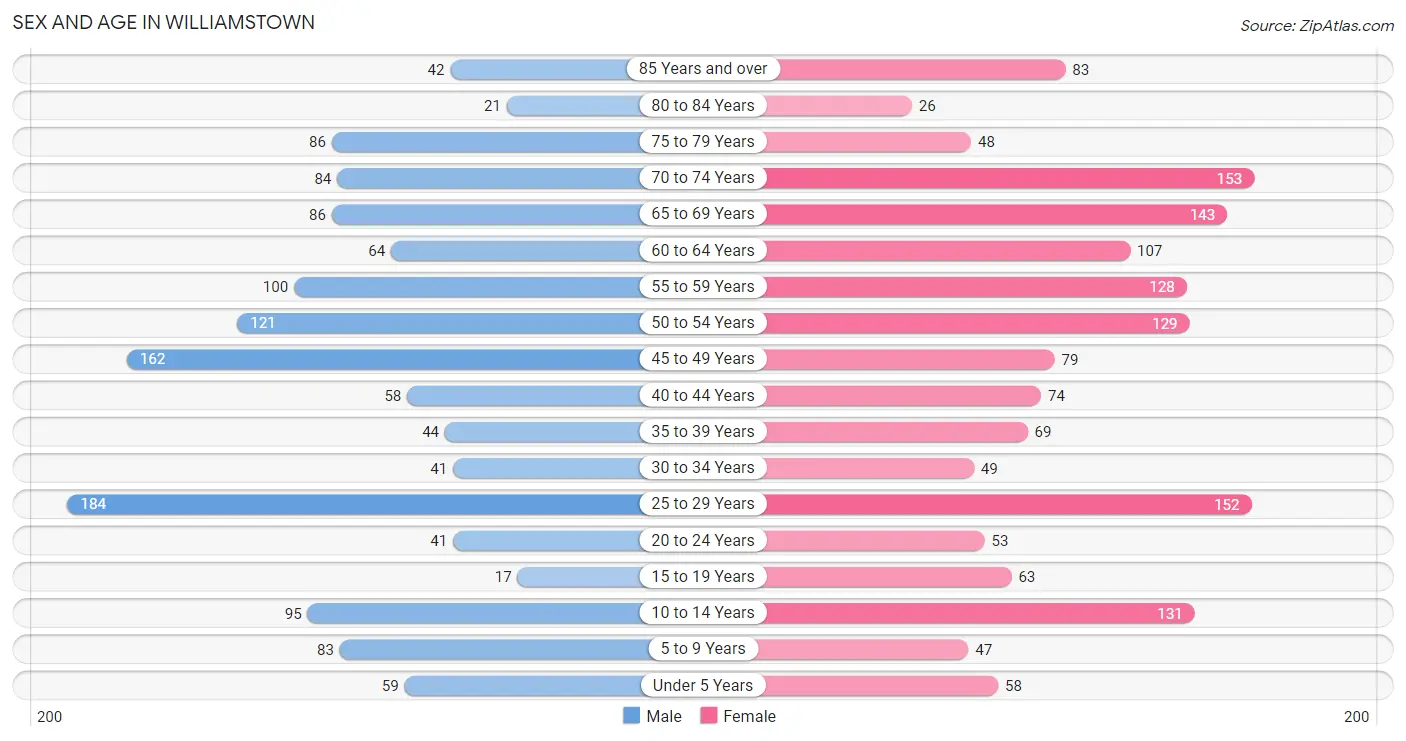
| Age Bracket | Male | Female |
| Under 5 Years | 59 (4.3%) | 58 (3.6%) |
| 5 to 9 Years | 83 (6.0%) | 47 (2.9%) |
| 10 to 14 Years | 95 (6.8%) | 131 (8.2%) |
| 15 to 19 Years | 17 (1.2%) | 63 (4.0%) |
| 20 to 24 Years | 41 (2.9%) | 53 (3.3%) |
| 25 to 29 Years | 184 (13.3%) | 152 (9.6%) |
| 30 to 34 Years | 41 (2.9%) | 49 (3.1%) |
| 35 to 39 Years | 44 (3.2%) | 69 (4.3%) |
| 40 to 44 Years | 58 (4.2%) | 74 (4.6%) |
| 45 to 49 Years | 162 (11.7%) | 79 (5.0%) |
| 50 to 54 Years | 121 (8.7%) | 129 (8.1%) |
| 55 to 59 Years | 100 (7.2%) | 128 (8.0%) |
| 60 to 64 Years | 64 (4.6%) | 107 (6.7%) |
| 65 to 69 Years | 86 (6.2%) | 143 (9.0%) |
| 70 to 74 Years | 84 (6.0%) | 153 (9.6%) |
| 75 to 79 Years | 86 (6.2%) | 48 (3.0%) |
| 80 to 84 Years | 21 (1.5%) | 26 (1.6%) |
| 85 Years and over | 42 (3.0%) | 83 (5.2%) |
| Total | 1,388 (100.0%) | 1,592 (100.0%) |
Families and Households in Williamstown
Median Family Size in Williamstown
The median family size in Williamstown is 2.59 persons per family, with married-couple families (772 | 81.8%) accounting for the largest median family size of 2.65 persons per family. On the other hand, single female/mother families (129 | 13.7%) represent the smallest median family size with 2.29 persons per family.
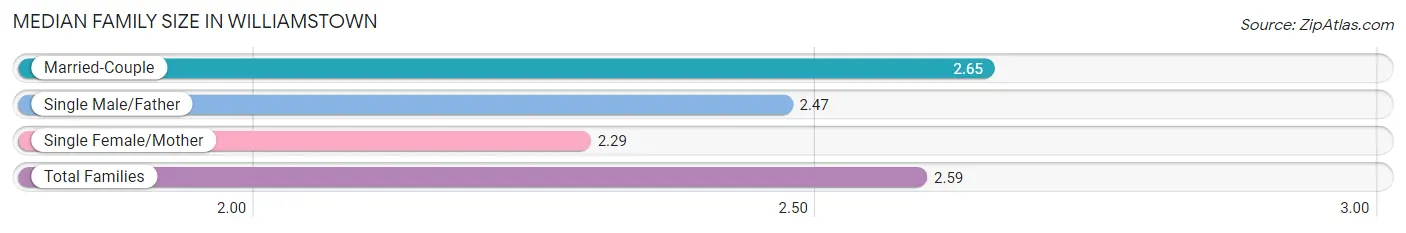
| Family Type | # Families | Family Size |
| Married-Couple | 772 (81.8%) | 2.65 |
| Single Male/Father | 43 (4.6%) | 2.47 |
| Single Female/Mother | 129 (13.7%) | 2.29 |
| Total Families | 944 (100.0%) | 2.59 |
Median Household Size in Williamstown
The median household size in Williamstown is 2.09 persons per household, with married-couple households (772 | 54.0%) accounting for the largest median household size of 2.65 persons per household. non-family households (485 | 33.9%) represent the smallest median household size with 1.11 persons per household.
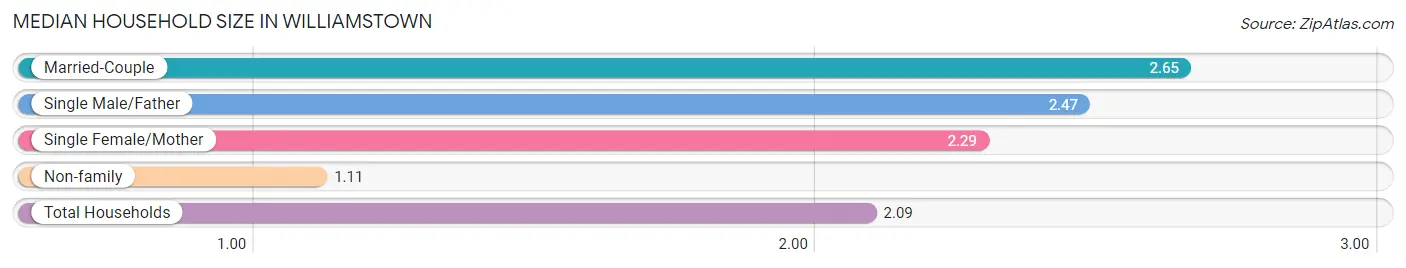
| Household Type | # Households | Household Size |
| Married-Couple | 772 (54.0%) | 2.65 |
| Single Male/Father | 43 (3.0%) | 2.47 |
| Single Female/Mother | 129 (9.0%) | 2.29 |
| Non-family | 485 (33.9%) | 1.11 |
| Total Households | 1,429 (100.0%) | 2.09 |
Household Size by Marriage Status in Williamstown
Out of a total of 1,429 households in Williamstown, 944 (66.1%) are family households, while 485 (33.9%) are nonfamily households. The most numerous type of family households are 2-person households, comprising 619, and the most common type of nonfamily households are 1-person households, comprising 454.
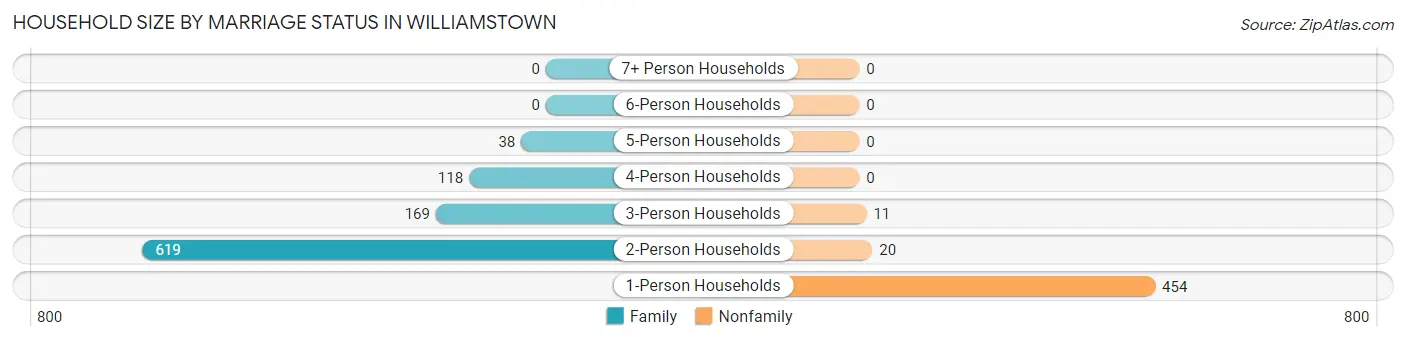
| Household Size | Family Households | Nonfamily Households |
| 1-Person Households | - | 454 (31.8%) |
| 2-Person Households | 619 (43.3%) | 20 (1.4%) |
| 3-Person Households | 169 (11.8%) | 11 (0.8%) |
| 4-Person Households | 118 (8.3%) | 0 (0.0%) |
| 5-Person Households | 38 (2.7%) | 0 (0.0%) |
| 6-Person Households | 0 (0.0%) | 0 (0.0%) |
| 7+ Person Households | 0 (0.0%) | 0 (0.0%) |
| Total | 944 (66.1%) | 485 (33.9%) |
Female Fertility in Williamstown
Fertility by Age in Williamstown
Average fertility rate in Williamstown is 56.0 births per 1,000 women. Women in the age bracket of 20 to 34 years have the highest fertility rate with 122.0 births per 1,000 women. Women in the age bracket of 20 to 34 years acount for 100.0% of all women with births.
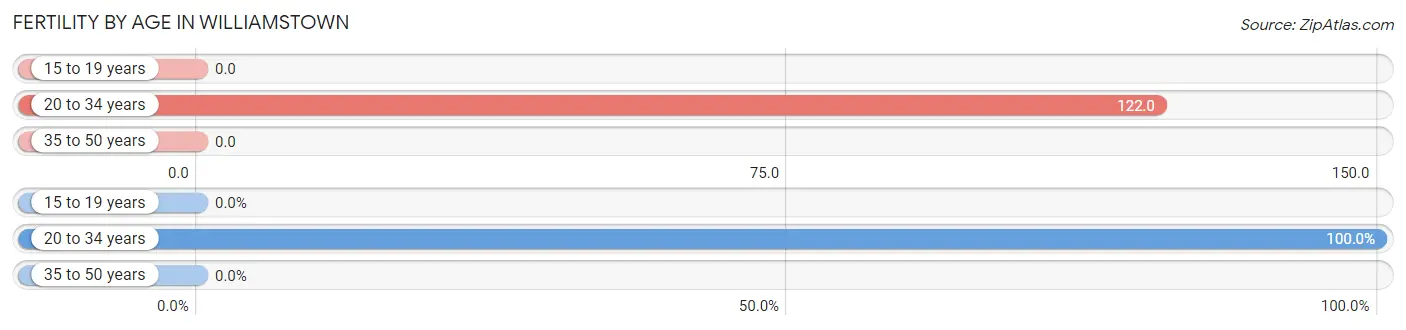
| Age Bracket | Women with Births | Births / 1,000 Women |
| 15 to 19 years | 0 (0.0%) | 0.0 |
| 20 to 34 years | 31 (100.0%) | 122.0 |
| 35 to 50 years | 0 (0.0%) | 0.0 |
| Total | 31 (100.0%) | 56.0 |
Fertility by Age by Marriage Status in Williamstown
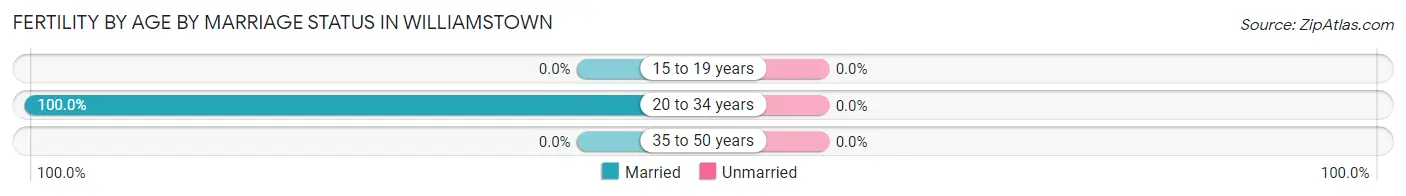
| Age Bracket | Married | Unmarried |
| 15 to 19 years | 0 (0.0%) | 0 (0.0%) |
| 20 to 34 years | 31 (100.0%) | 0 (0.0%) |
| 35 to 50 years | 0 (0.0%) | 0 (0.0%) |
| Total | 31 (100.0%) | 0 (0.0%) |
Fertility by Education in Williamstown
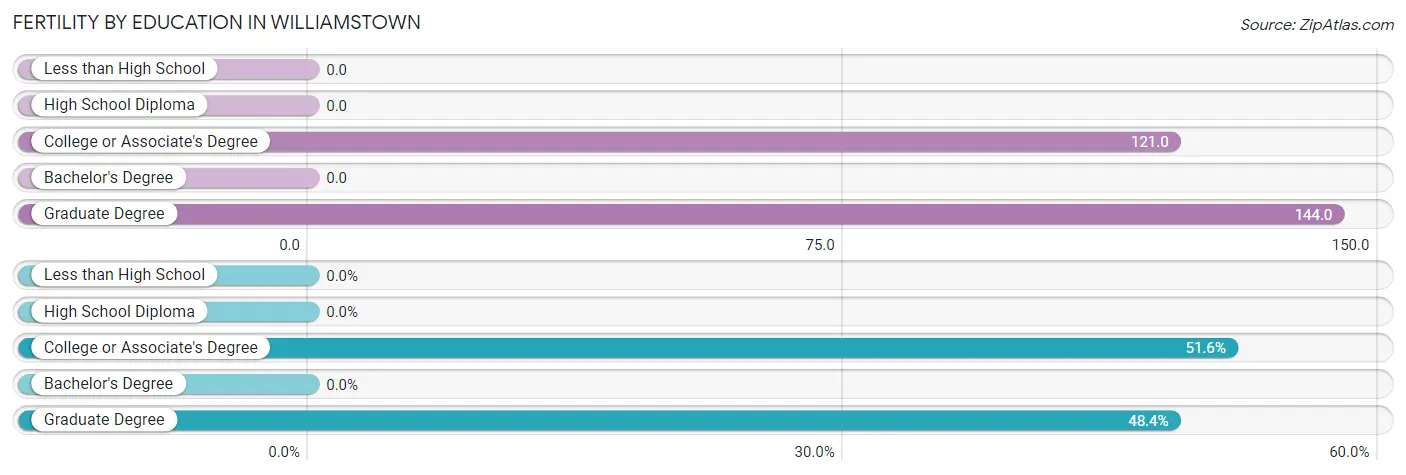
| Educational Attainment | Women with Births | Births / 1,000 Women |
| Less than High School | 0 (0.0%) | 0.0 |
| High School Diploma | 0 (0.0%) | 0.0 |
| College or Associate's Degree | 16 (51.6%) | 121.0 |
| Bachelor's Degree | 0 (0.0%) | 0.0 |
| Graduate Degree | 15 (48.4%) | 144.0 |
| Total | 31 (100.0%) | 56.0 |
Fertility by Education by Marriage Status in Williamstown
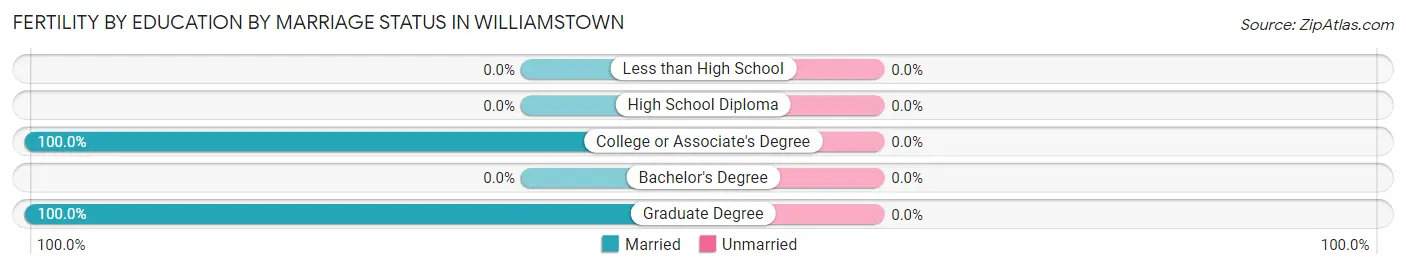
| Educational Attainment | Married | Unmarried |
| Less than High School | 0 (0.0%) | 0 (0.0%) |
| High School Diploma | 0 (0.0%) | 0 (0.0%) |
| College or Associate's Degree | 16 (100.0%) | 0 (0.0%) |
| Bachelor's Degree | 0 (0.0%) | 0 (0.0%) |
| Graduate Degree | 15 (100.0%) | 0 (0.0%) |
| Total | 31 (100.0%) | 0 (0.0%) |
Employment Characteristics in Williamstown
Employment by Class of Employer in Williamstown
Among the 1,393 employed individuals in Williamstown, private company employees (819 | 58.8%), not-for-profit organizations (144 | 10.3%), and federal government employees (118 | 8.5%) make up the most common classes of employment.
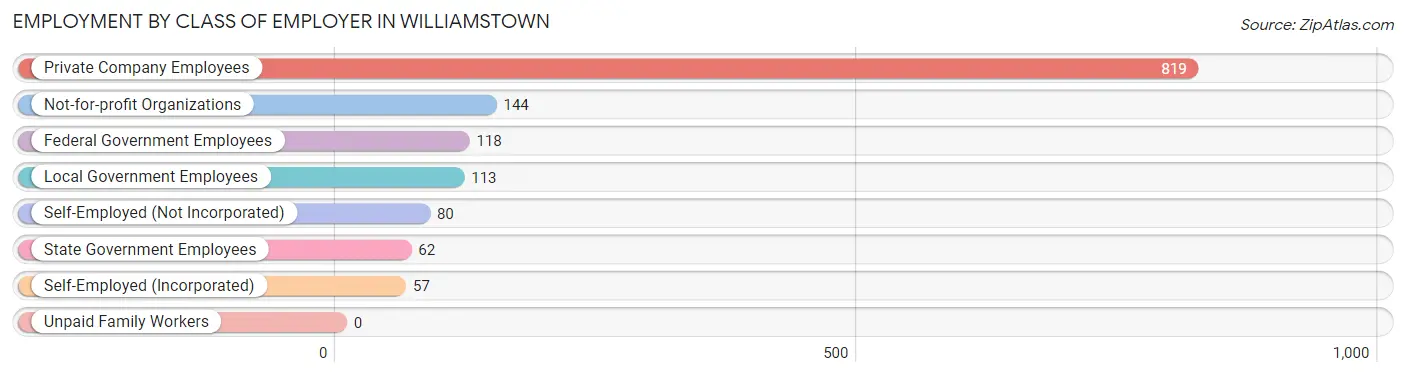
| Employer Class | # Employees | % Employees |
| Private Company Employees | 819 | 58.8% |
| Self-Employed (Incorporated) | 57 | 4.1% |
| Self-Employed (Not Incorporated) | 80 | 5.7% |
| Not-for-profit Organizations | 144 | 10.3% |
| Local Government Employees | 113 | 8.1% |
| State Government Employees | 62 | 4.4% |
| Federal Government Employees | 118 | 8.5% |
| Unpaid Family Workers | 0 | 0.0% |
| Total | 1,393 | 100.0% |
Employment Status by Age in Williamstown
According to the labor force statistics for Williamstown, out of the total population over 16 years of age (2,485), 59.2% or 1,471 individuals are in the labor force, with 2.6% or 38 of them unemployed. The age group with the highest labor force participation rate is 20 to 24 years, with 100.0% or 94 individuals in the labor force. Within the labor force, the 16 to 19 years age range has the highest percentage of unemployed individuals, with 41.4% or 12 of them being unemployed.
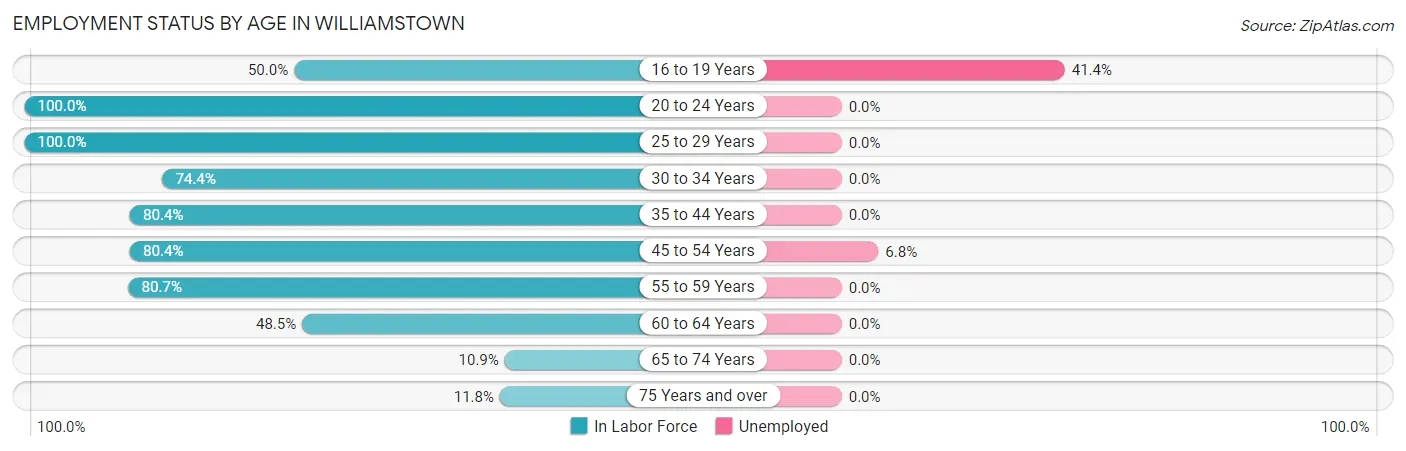
| Age Bracket | In Labor Force | Unemployed |
| 16 to 19 Years | 29 (50.0%) | 12 (41.4%) |
| 20 to 24 Years | 94 (100.0%) | 0 (0.0%) |
| 25 to 29 Years | 336 (100.0%) | 0 (0.0%) |
| 30 to 34 Years | 67 (74.4%) | 0 (0.0%) |
| 35 to 44 Years | 197 (80.4%) | 0 (0.0%) |
| 45 to 54 Years | 395 (80.4%) | 27 (6.8%) |
| 55 to 59 Years | 184 (80.7%) | 0 (0.0%) |
| 60 to 64 Years | 83 (48.5%) | 0 (0.0%) |
| 65 to 74 Years | 51 (10.9%) | 0 (0.0%) |
| 75 Years and over | 36 (11.8%) | 0 (0.0%) |
| Total | 1,471 (59.2%) | 38 (2.6%) |
Employment Status by Educational Attainment in Williamstown
According to labor force statistics for Williamstown, 80.8% of individuals (1,261) out of the total population between 25 and 64 years of age (1,561) are in the labor force, with 2.1% or 26 of them being unemployed. The group with the highest labor force participation rate are those with the educational attainment of college / associate degree, with 84.0% or 320 individuals in the labor force. Within the labor force, individuals with high school diploma education have the highest percentage of unemployment, with 5.6% or 17 of them being unemployed.
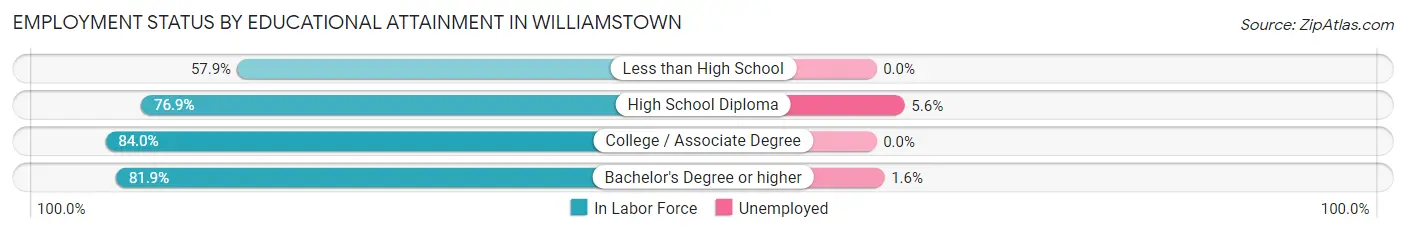
| Educational Attainment | In Labor Force | Unemployed |
| Less than High School | 11 (57.9%) | 0 (0.0%) |
| High School Diploma | 303 (76.9%) | 22 (5.6%) |
| College / Associate Degree | 320 (84.0%) | 0 (0.0%) |
| Bachelor's Degree or higher | 628 (81.9%) | 12 (1.6%) |
| Total | 1,261 (80.8%) | 33 (2.1%) |
Employment Occupations by Sex in Williamstown
Management, Business, Science and Arts Occupations
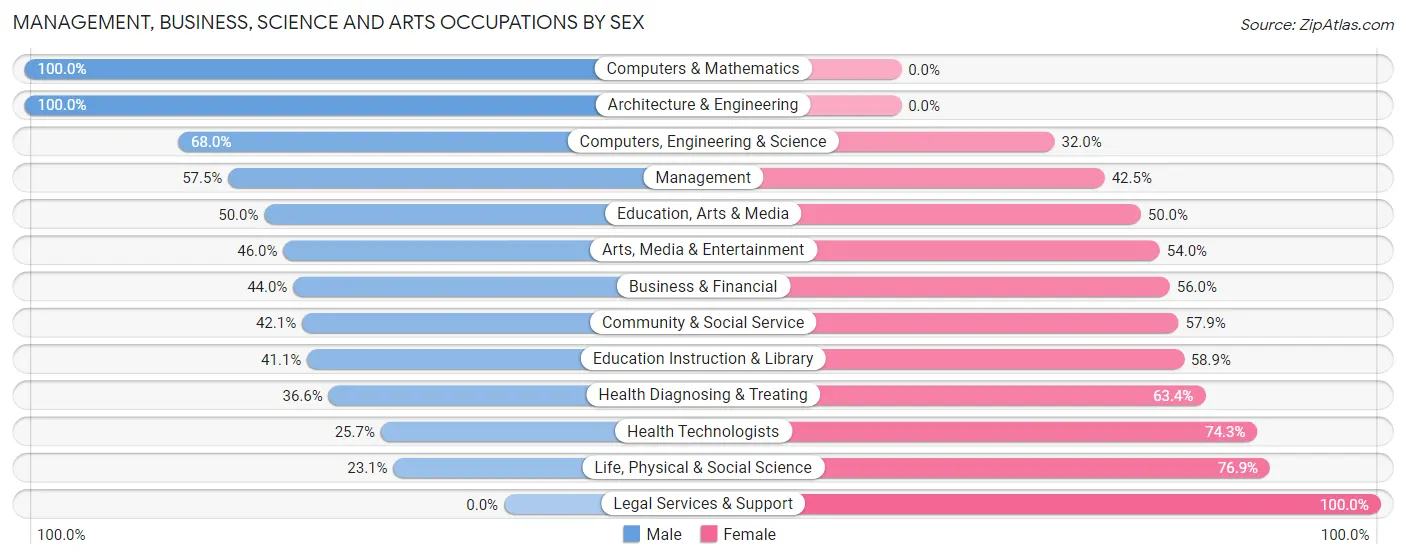
The most common Management, Business, Science and Arts occupations in Williamstown are Community & Social Service (280 | 19.5%), Management (186 | 13.0%), Education Instruction & Library (151 | 10.5%), Computers, Engineering & Science (125 | 8.7%), and Business & Financial (116 | 8.1%).
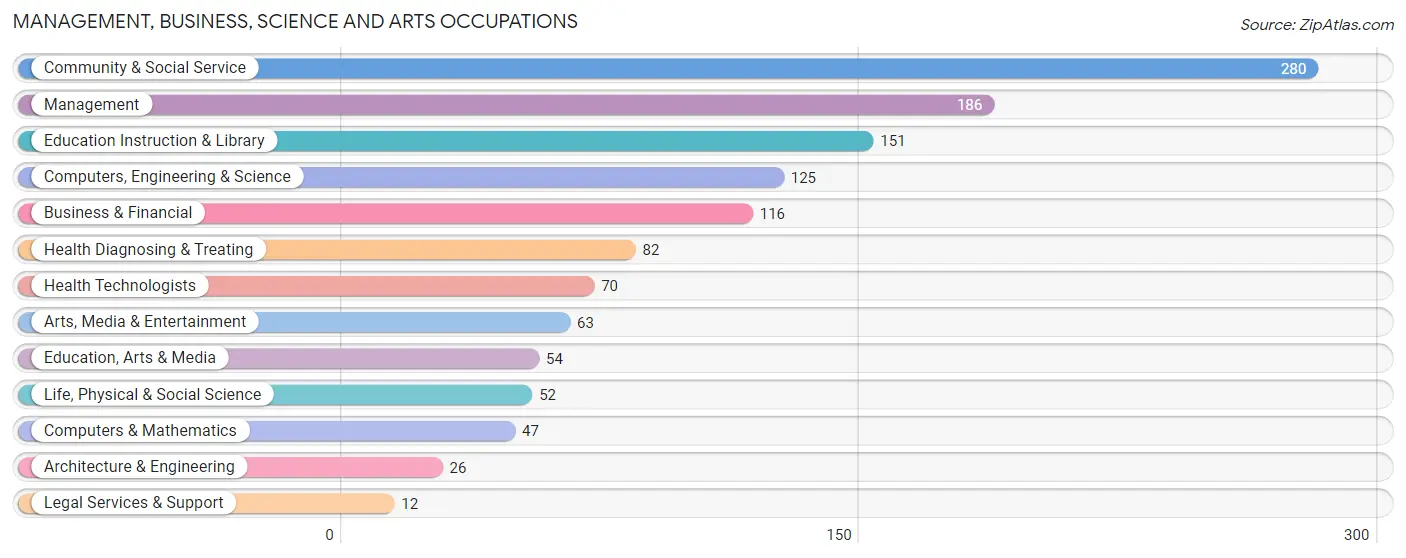
Management, Business, Science and Arts Occupations by Sex
Within the Management, Business, Science and Arts occupations in Williamstown, the most male-oriented occupations are Computers & Mathematics (100.0%), Architecture & Engineering (100.0%), and Computers, Engineering & Science (68.0%), while the most female-oriented occupations are Legal Services & Support (100.0%), Life, Physical & Social Science (76.9%), and Health Technologists (74.3%).
| Occupation | Male | Female |
| Management | 107 (57.5%) | 79 (42.5%) |
| Business & Financial | 51 (44.0%) | 65 (56.0%) |
| Computers, Engineering & Science | 85 (68.0%) | 40 (32.0%) |
| Computers & Mathematics | 47 (100.0%) | 0 (0.0%) |
| Architecture & Engineering | 26 (100.0%) | 0 (0.0%) |
| Life, Physical & Social Science | 12 (23.1%) | 40 (76.9%) |
| Community & Social Service | 118 (42.1%) | 162 (57.9%) |
| Education, Arts & Media | 27 (50.0%) | 27 (50.0%) |
| Legal Services & Support | 0 (0.0%) | 12 (100.0%) |
| Education Instruction & Library | 62 (41.1%) | 89 (58.9%) |
| Arts, Media & Entertainment | 29 (46.0%) | 34 (54.0%) |
| Health Diagnosing & Treating | 30 (36.6%) | 52 (63.4%) |
| Health Technologists | 18 (25.7%) | 52 (74.3%) |
| Total (Category) | 391 (49.6%) | 398 (50.4%) |
| Total (Overall) | 710 (49.5%) | 723 (50.4%) |
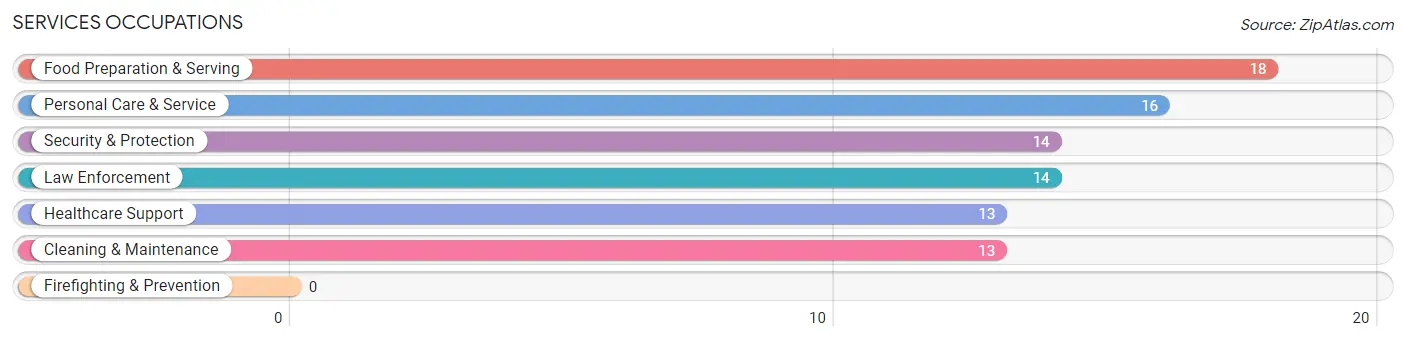
Services Occupations
The most common Services occupations in Williamstown are Food Preparation & Serving (18 | 1.3%), Personal Care & Service (16 | 1.1%), Security & Protection (14 | 1.0%), Law Enforcement (14 | 1.0%), and Healthcare Support (13 | 0.9%).
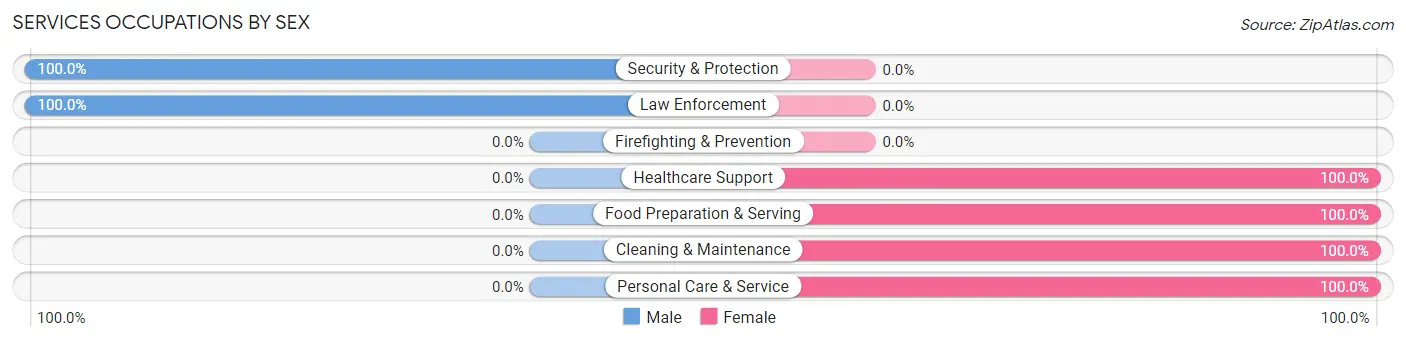
Services Occupations by Sex
Within the Services occupations in Williamstown, the most male-oriented occupations are Security & Protection (100.0%), and Law Enforcement (100.0%), while the most female-oriented occupations are Healthcare Support (100.0%), Food Preparation & Serving (100.0%), and Cleaning & Maintenance (100.0%).
| Occupation | Male | Female |
| Healthcare Support | 0 (0.0%) | 13 (100.0%) |
| Security & Protection | 14 (100.0%) | 0 (0.0%) |
| Firefighting & Prevention | 0 (0.0%) | 0 (0.0%) |
| Law Enforcement | 14 (100.0%) | 0 (0.0%) |
| Food Preparation & Serving | 0 (0.0%) | 18 (100.0%) |
| Cleaning & Maintenance | 0 (0.0%) | 13 (100.0%) |
| Personal Care & Service | 0 (0.0%) | 16 (100.0%) |
| Total (Category) | 14 (18.9%) | 60 (81.1%) |
| Total (Overall) | 710 (49.5%) | 723 (50.4%) |
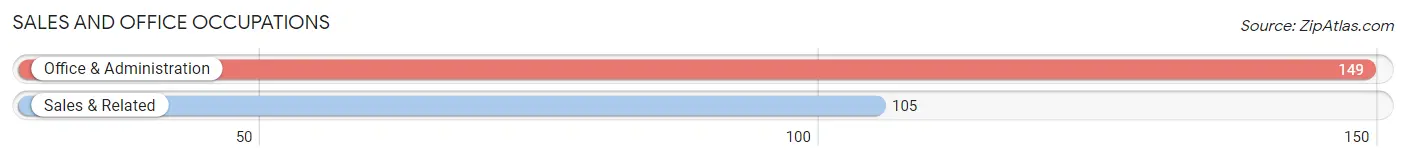
Sales and Office Occupations
The most common Sales and Office occupations in Williamstown are Office & Administration (149 | 10.4%), and Sales & Related (105 | 7.3%).
Sales and Office Occupations by Sex
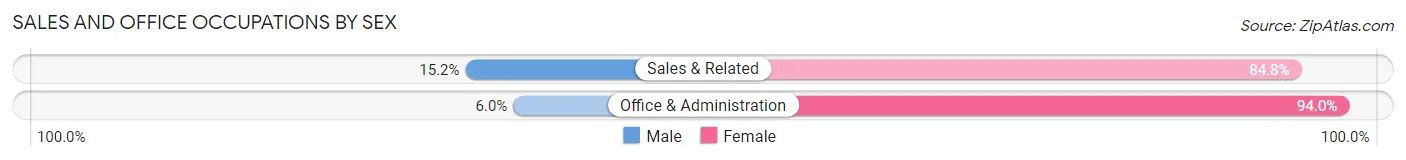
| Occupation | Male | Female |
| Sales & Related | 16 (15.2%) | 89 (84.8%) |
| Office & Administration | 9 (6.0%) | 140 (94.0%) |
| Total (Category) | 25 (9.8%) | 229 (90.2%) |
| Total (Overall) | 710 (49.5%) | 723 (50.4%) |
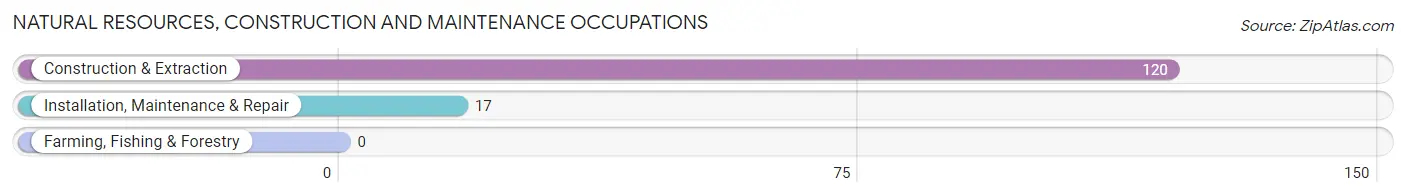
Natural Resources, Construction and Maintenance Occupations
The most common Natural Resources, Construction and Maintenance occupations in Williamstown are Construction & Extraction (120 | 8.4%), and Installation, Maintenance & Repair (17 | 1.2%).
Natural Resources, Construction and Maintenance Occupations by Sex
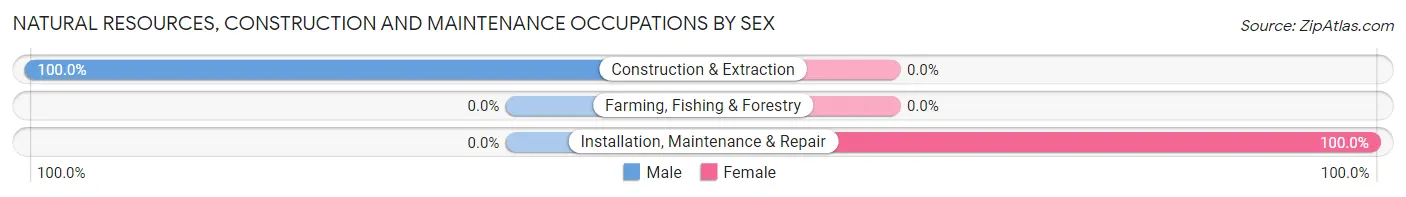
| Occupation | Male | Female |
| Farming, Fishing & Forestry | 0 (0.0%) | 0 (0.0%) |
| Construction & Extraction | 120 (100.0%) | 0 (0.0%) |
| Installation, Maintenance & Repair | 0 (0.0%) | 17 (100.0%) |
| Total (Category) | 120 (87.6%) | 17 (12.4%) |
| Total (Overall) | 710 (49.5%) | 723 (50.4%) |
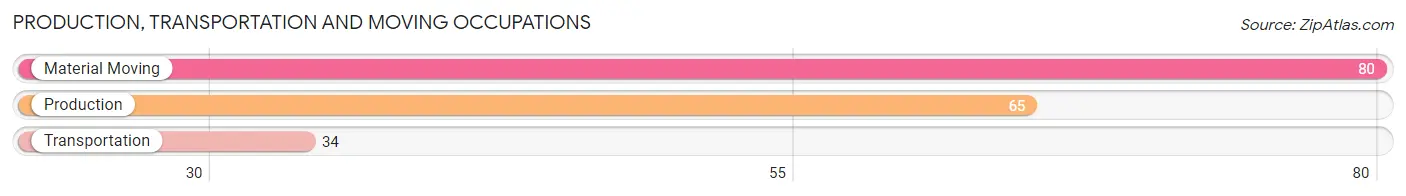
Production, Transportation and Moving Occupations
The most common Production, Transportation and Moving occupations in Williamstown are Material Moving (80 | 5.6%), Production (65 | 4.5%), and Transportation (34 | 2.4%).
Production, Transportation and Moving Occupations by Sex
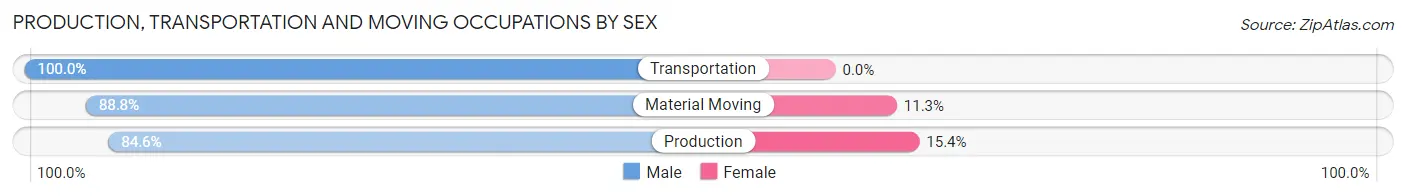
| Occupation | Male | Female |
| Production | 55 (84.6%) | 10 (15.4%) |
| Transportation | 34 (100.0%) | 0 (0.0%) |
| Material Moving | 71 (88.7%) | 9 (11.3%) |
| Total (Category) | 160 (89.4%) | 19 (10.6%) |
| Total (Overall) | 710 (49.5%) | 723 (50.4%) |
Employment Industries by Sex in Williamstown
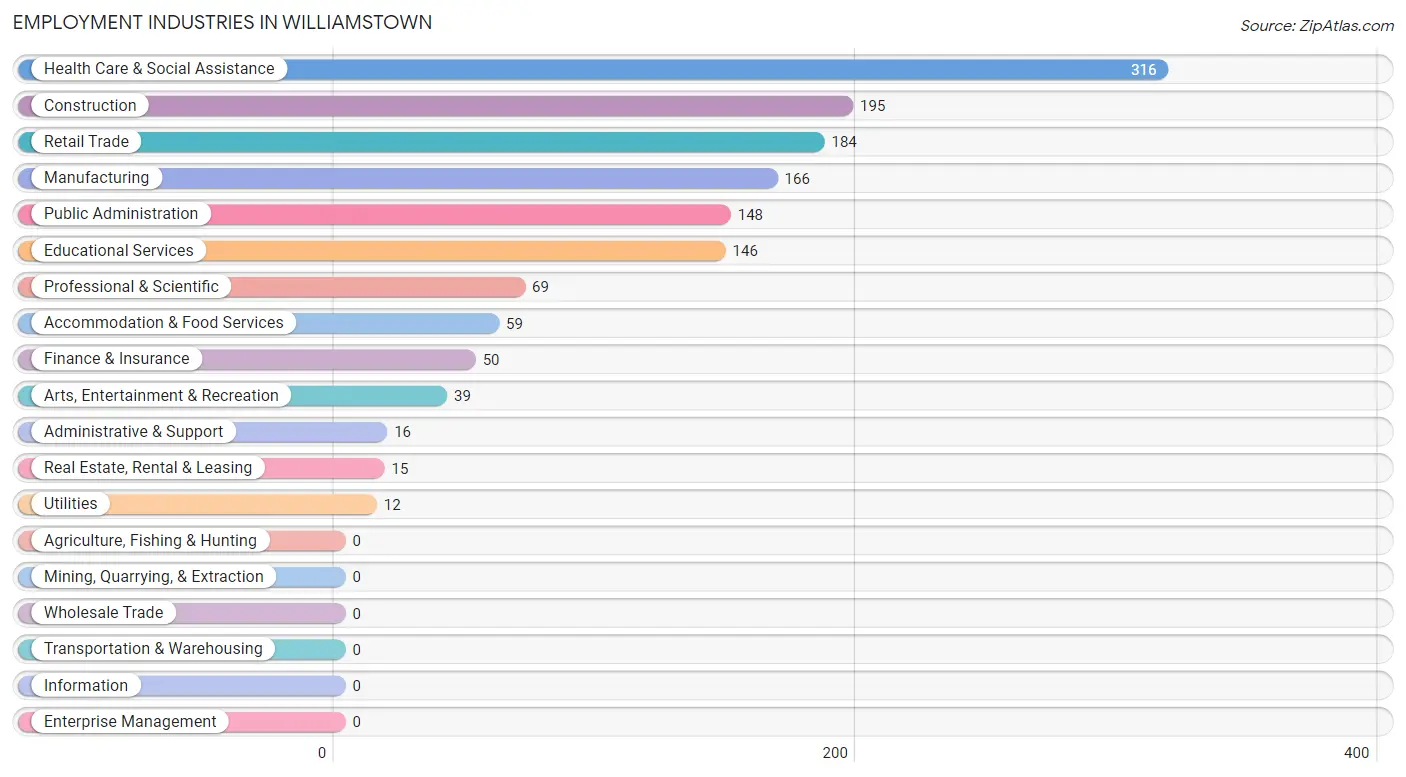
Employment Industries in Williamstown
The major employment industries in Williamstown include Health Care & Social Assistance (316 | 22.1%), Construction (195 | 13.6%), Retail Trade (184 | 12.8%), Manufacturing (166 | 11.6%), and Public Administration (148 | 10.3%).
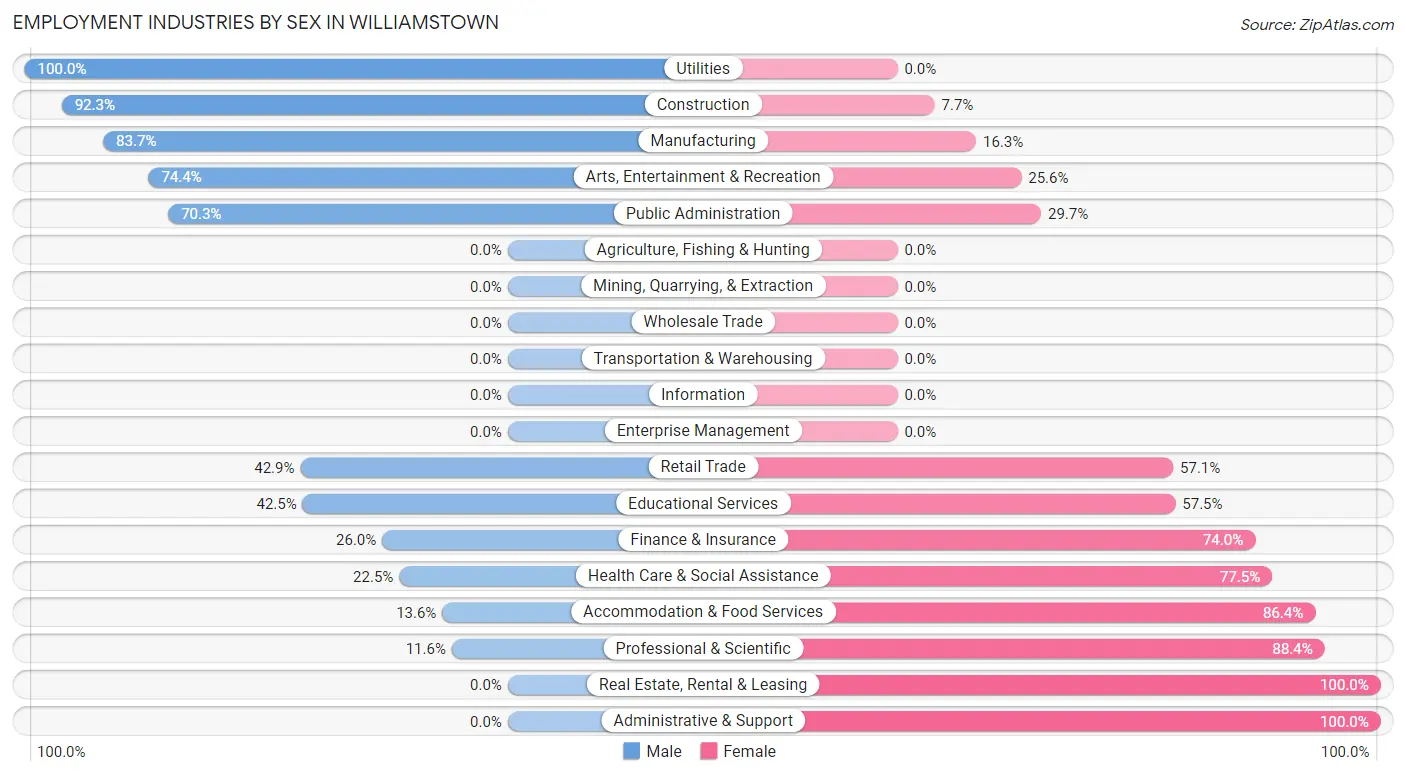
Employment Industries by Sex in Williamstown
The Williamstown industries that see more men than women are Utilities (100.0%), Construction (92.3%), and Manufacturing (83.7%), whereas the industries that tend to have a higher number of women are Real Estate, Rental & Leasing (100.0%), Administrative & Support (100.0%), and Professional & Scientific (88.4%).
| Industry | Male | Female |
| Agriculture, Fishing & Hunting | 0 (0.0%) | 0 (0.0%) |
| Mining, Quarrying, & Extraction | 0 (0.0%) | 0 (0.0%) |
| Construction | 180 (92.3%) | 15 (7.7%) |
| Manufacturing | 139 (83.7%) | 27 (16.3%) |
| Wholesale Trade | 0 (0.0%) | 0 (0.0%) |
| Retail Trade | 79 (42.9%) | 105 (57.1%) |
| Transportation & Warehousing | 0 (0.0%) | 0 (0.0%) |
| Utilities | 12 (100.0%) | 0 (0.0%) |
| Information | 0 (0.0%) | 0 (0.0%) |
| Finance & Insurance | 13 (26.0%) | 37 (74.0%) |
| Real Estate, Rental & Leasing | 0 (0.0%) | 15 (100.0%) |
| Professional & Scientific | 8 (11.6%) | 61 (88.4%) |
| Enterprise Management | 0 (0.0%) | 0 (0.0%) |
| Administrative & Support | 0 (0.0%) | 16 (100.0%) |
| Educational Services | 62 (42.5%) | 84 (57.5%) |
| Health Care & Social Assistance | 71 (22.5%) | 245 (77.5%) |
| Arts, Entertainment & Recreation | 29 (74.4%) | 10 (25.6%) |
| Accommodation & Food Services | 8 (13.6%) | 51 (86.4%) |
| Public Administration | 104 (70.3%) | 44 (29.7%) |
| Total | 710 (49.5%) | 723 (50.4%) |
Education in Williamstown
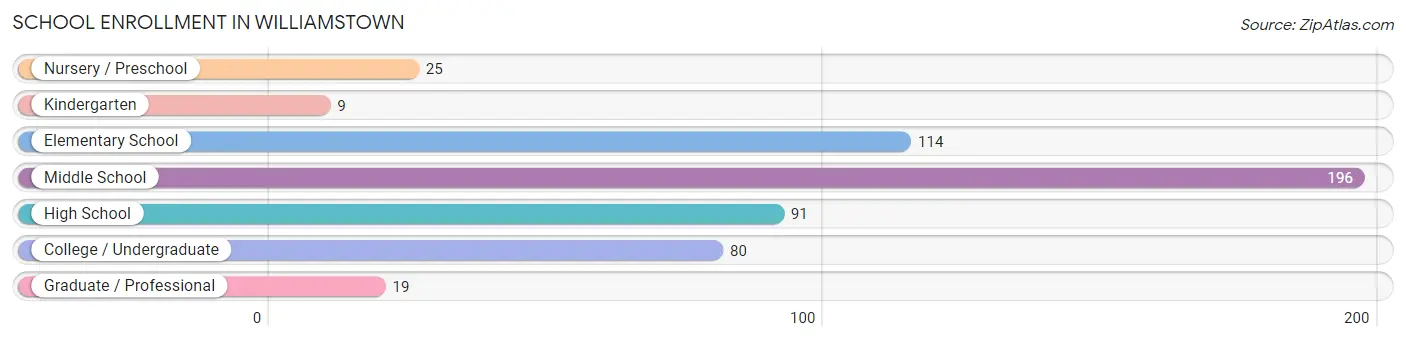
School Enrollment in Williamstown
The most common levels of schooling among the 534 students in Williamstown are middle school (196 | 36.7%), elementary school (114 | 21.3%), and high school (91 | 17.0%).
| School Level | # Students | % Students |
| Nursery / Preschool | 25 | 4.7% |
| Kindergarten | 9 | 1.7% |
| Elementary School | 114 | 21.3% |
| Middle School | 196 | 36.7% |
| High School | 91 | 17.0% |
| College / Undergraduate | 80 | 15.0% |
| Graduate / Professional | 19 | 3.6% |
| Total | 534 | 100.0% |
School Enrollment by Age by Funding Source in Williamstown
Out of a total of 534 students who are enrolled in schools in Williamstown, 20 (3.7%) attend a private institution, while the remaining 514 (96.3%) are enrolled in public schools. The age group of 20 to 24 year olds has the highest likelihood of being enrolled in private schools, with 9 (18.4% in the age bracket) enrolled. Conversely, the age group of 3 to 4 year olds has the lowest likelihood of being enrolled in a private school, with 25 (100.0% in the age bracket) attending a public institution.
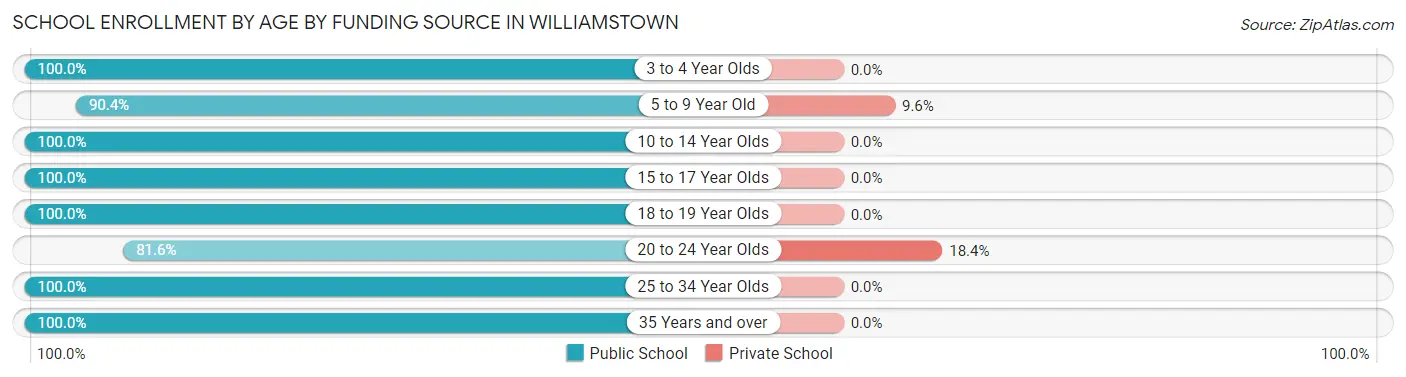
| Age Bracket | Public School | Private School |
| 3 to 4 Year Olds | 25 (100.0%) | 0 (0.0%) |
| 5 to 9 Year Old | 104 (90.4%) | 11 (9.6%) |
| 10 to 14 Year Olds | 226 (100.0%) | 0 (0.0%) |
| 15 to 17 Year Olds | 58 (100.0%) | 0 (0.0%) |
| 18 to 19 Year Olds | 11 (100.0%) | 0 (0.0%) |
| 20 to 24 Year Olds | 40 (81.6%) | 9 (18.4%) |
| 25 to 34 Year Olds | 13 (100.0%) | 0 (0.0%) |
| 35 Years and over | 37 (100.0%) | 0 (0.0%) |
| Total | 514 (96.3%) | 20 (3.7%) |
Educational Attainment by Field of Study in Williamstown
Education (268 | 23.9%), business (180 | 16.1%), arts & humanities (110 | 9.8%), liberal arts & history (98 | 8.7%), and physical & health sciences (76 | 6.8%) are the most common fields of study among 1,121 individuals in Williamstown who have obtained a bachelor's degree or higher.
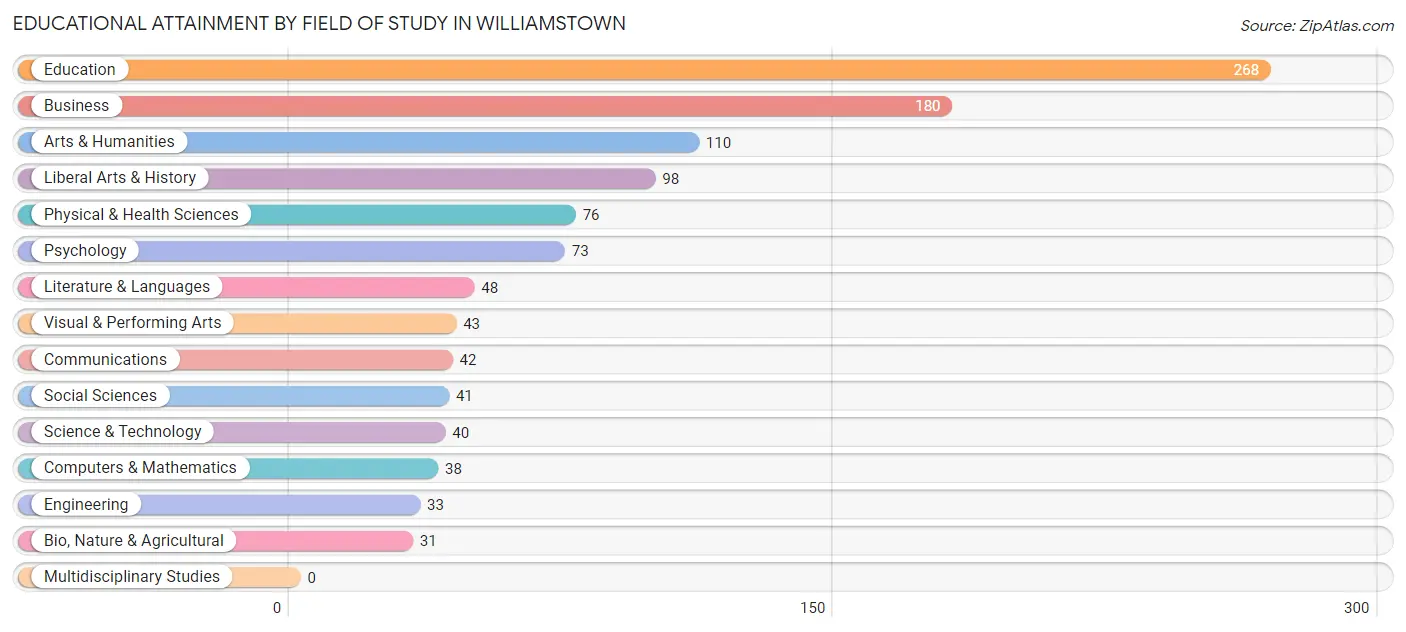
| Field of Study | # Graduates | % Graduates |
| Computers & Mathematics | 38 | 3.4% |
| Bio, Nature & Agricultural | 31 | 2.8% |
| Physical & Health Sciences | 76 | 6.8% |
| Psychology | 73 | 6.5% |
| Social Sciences | 41 | 3.7% |
| Engineering | 33 | 2.9% |
| Multidisciplinary Studies | 0 | 0.0% |
| Science & Technology | 40 | 3.6% |
| Business | 180 | 16.1% |
| Education | 268 | 23.9% |
| Literature & Languages | 48 | 4.3% |
| Liberal Arts & History | 98 | 8.7% |
| Visual & Performing Arts | 43 | 3.8% |
| Communications | 42 | 3.7% |
| Arts & Humanities | 110 | 9.8% |
| Total | 1,121 | 100.0% |
Transportation & Commute in Williamstown
Vehicle Availability by Sex in Williamstown
The most prevalent vehicle ownership categories in Williamstown are males with 2 vehicles (283, accounting for 42.2%) and females with 2 vehicles (400, making up 39.1%).
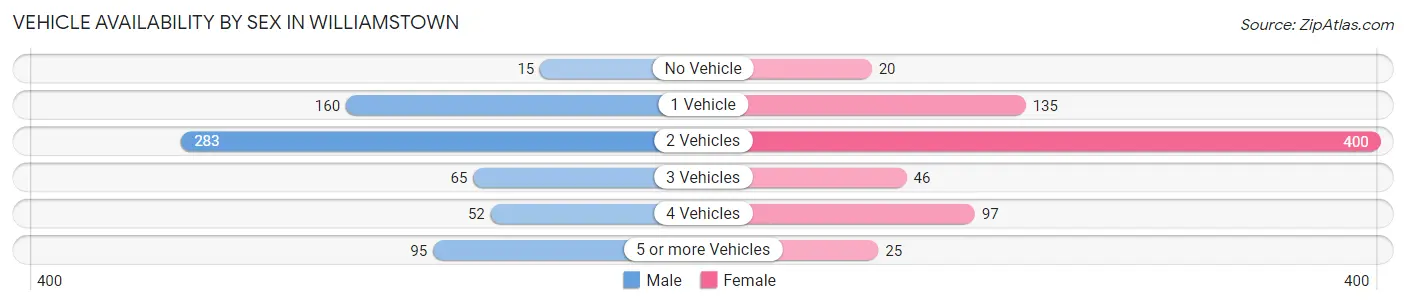
| Vehicles Available | Male | Female |
| No Vehicle | 15 (2.2%) | 20 (2.8%) |
| 1 Vehicle | 160 (23.9%) | 135 (18.7%) |
| 2 Vehicles | 283 (42.2%) | 400 (55.3%) |
| 3 Vehicles | 65 (9.7%) | 46 (6.4%) |
| 4 Vehicles | 52 (7.8%) | 97 (13.4%) |
| 5 or more Vehicles | 95 (14.2%) | 25 (3.5%) |
| Total | 670 (100.0%) | 723 (100.0%) |
Commute Time in Williamstown
The most frequently occuring commute durations in Williamstown are 5 to 9 minutes (199 commuters, 15.6%), 20 to 24 minutes (188 commuters, 14.7%), and 10 to 14 minutes (186 commuters, 14.5%).
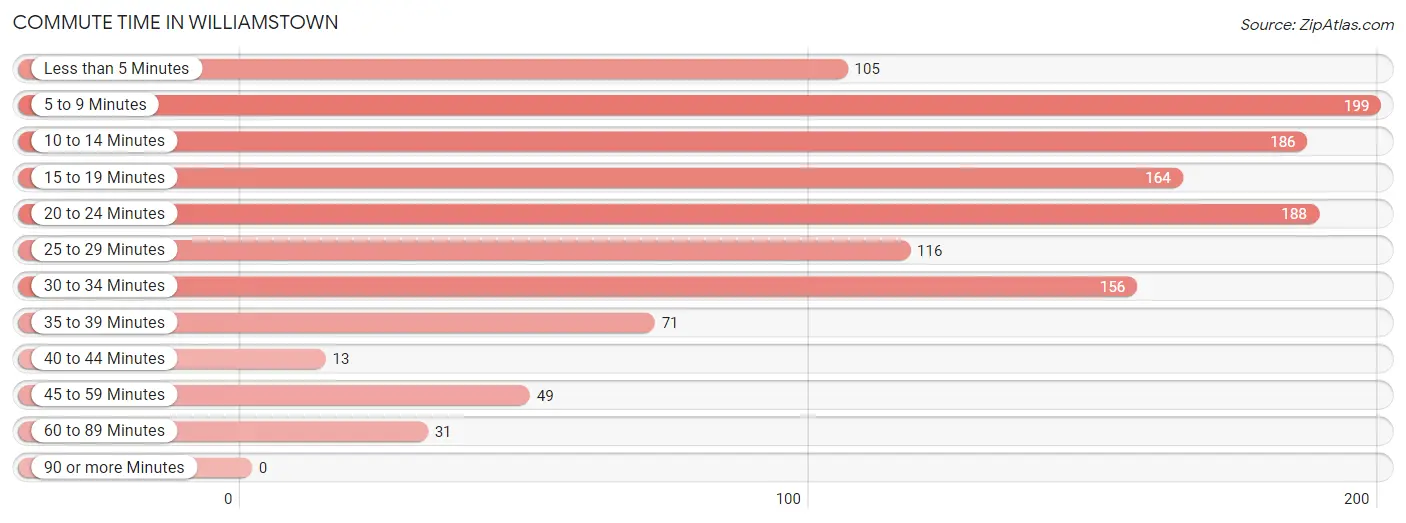
| Commute Time | # Commuters | % Commuters |
| Less than 5 Minutes | 105 | 8.2% |
| 5 to 9 Minutes | 199 | 15.6% |
| 10 to 14 Minutes | 186 | 14.5% |
| 15 to 19 Minutes | 164 | 12.8% |
| 20 to 24 Minutes | 188 | 14.7% |
| 25 to 29 Minutes | 116 | 9.1% |
| 30 to 34 Minutes | 156 | 12.2% |
| 35 to 39 Minutes | 71 | 5.6% |
| 40 to 44 Minutes | 13 | 1.0% |
| 45 to 59 Minutes | 49 | 3.8% |
| 60 to 89 Minutes | 31 | 2.4% |
| 90 or more Minutes | 0 | 0.0% |
Commute Time by Sex in Williamstown
The most common commute times in Williamstown are 10 to 14 minutes (127 commuters, 21.4%) for males and 5 to 9 minutes (139 commuters, 20.3%) for females.
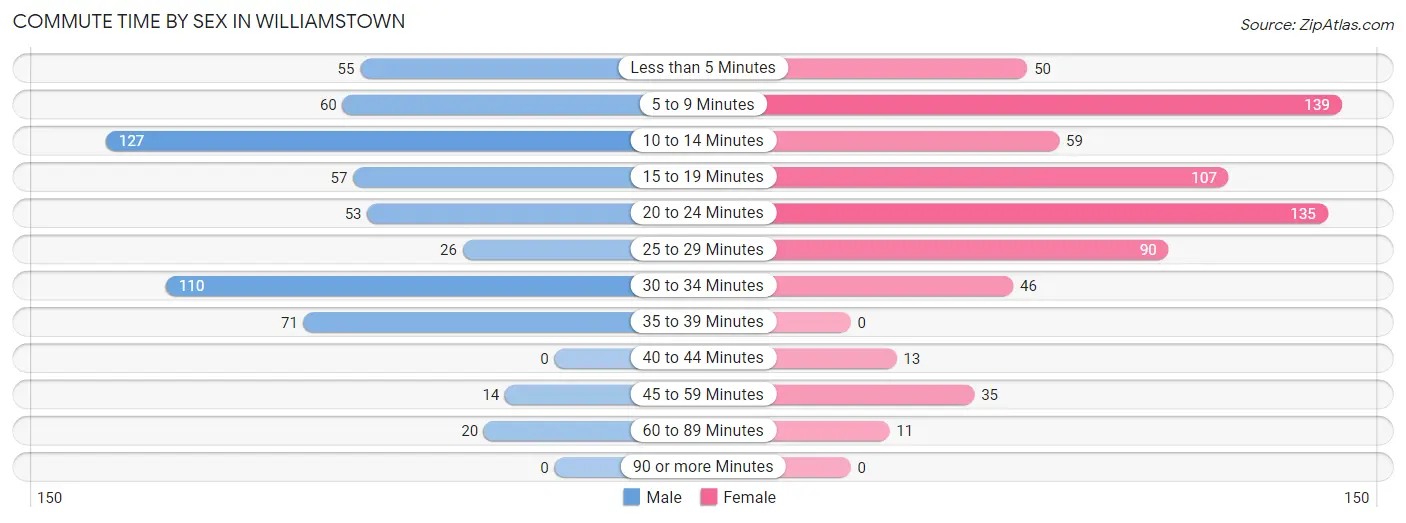
| Commute Time | Male | Female |
| Less than 5 Minutes | 55 (9.3%) | 50 (7.3%) |
| 5 to 9 Minutes | 60 (10.1%) | 139 (20.3%) |
| 10 to 14 Minutes | 127 (21.4%) | 59 (8.6%) |
| 15 to 19 Minutes | 57 (9.6%) | 107 (15.6%) |
| 20 to 24 Minutes | 53 (8.9%) | 135 (19.7%) |
| 25 to 29 Minutes | 26 (4.4%) | 90 (13.1%) |
| 30 to 34 Minutes | 110 (18.5%) | 46 (6.7%) |
| 35 to 39 Minutes | 71 (12.0%) | 0 (0.0%) |
| 40 to 44 Minutes | 0 (0.0%) | 13 (1.9%) |
| 45 to 59 Minutes | 14 (2.4%) | 35 (5.1%) |
| 60 to 89 Minutes | 20 (3.4%) | 11 (1.6%) |
| 90 or more Minutes | 0 (0.0%) | 0 (0.0%) |
Time of Departure to Work by Sex in Williamstown
The most frequent times of departure to work in Williamstown are 6:30 AM to 6:59 AM (143, 24.1%) for males and 7:30 AM to 7:59 AM (253, 36.9%) for females.
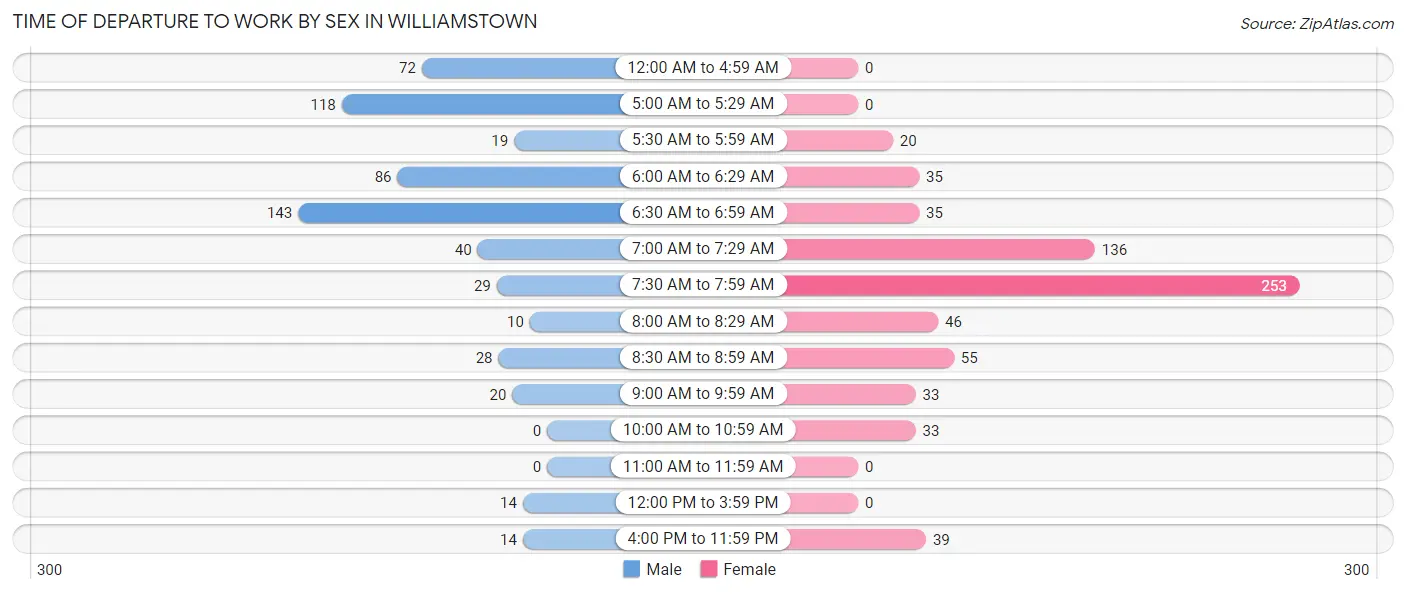
| Time of Departure | Male | Female |
| 12:00 AM to 4:59 AM | 72 (12.1%) | 0 (0.0%) |
| 5:00 AM to 5:29 AM | 118 (19.9%) | 0 (0.0%) |
| 5:30 AM to 5:59 AM | 19 (3.2%) | 20 (2.9%) |
| 6:00 AM to 6:29 AM | 86 (14.5%) | 35 (5.1%) |
| 6:30 AM to 6:59 AM | 143 (24.1%) | 35 (5.1%) |
| 7:00 AM to 7:29 AM | 40 (6.8%) | 136 (19.9%) |
| 7:30 AM to 7:59 AM | 29 (4.9%) | 253 (36.9%) |
| 8:00 AM to 8:29 AM | 10 (1.7%) | 46 (6.7%) |
| 8:30 AM to 8:59 AM | 28 (4.7%) | 55 (8.0%) |
| 9:00 AM to 9:59 AM | 20 (3.4%) | 33 (4.8%) |
| 10:00 AM to 10:59 AM | 0 (0.0%) | 33 (4.8%) |
| 11:00 AM to 11:59 AM | 0 (0.0%) | 0 (0.0%) |
| 12:00 PM to 3:59 PM | 14 (2.4%) | 0 (0.0%) |
| 4:00 PM to 11:59 PM | 14 (2.4%) | 39 (5.7%) |
| Total | 593 (100.0%) | 685 (100.0%) |
Housing Occupancy in Williamstown
Occupancy by Ownership in Williamstown
Of the total 1,429 dwellings in Williamstown, owner-occupied units account for 1,237 (86.6%), while renter-occupied units make up 192 (13.4%).
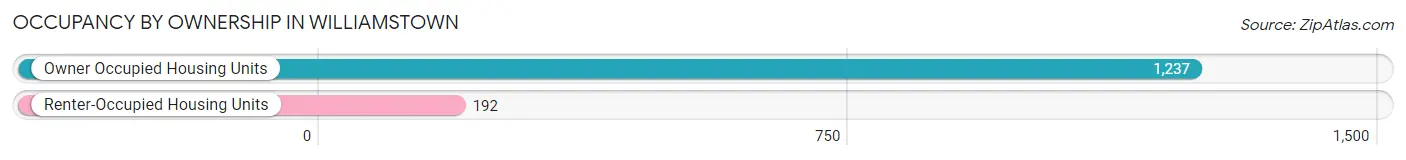
| Occupancy | # Housing Units | % Housing Units |
| Owner Occupied Housing Units | 1,237 | 86.6% |
| Renter-Occupied Housing Units | 192 | 13.4% |
| Total Occupied Housing Units | 1,429 | 100.0% |
Occupancy by Household Size in Williamstown
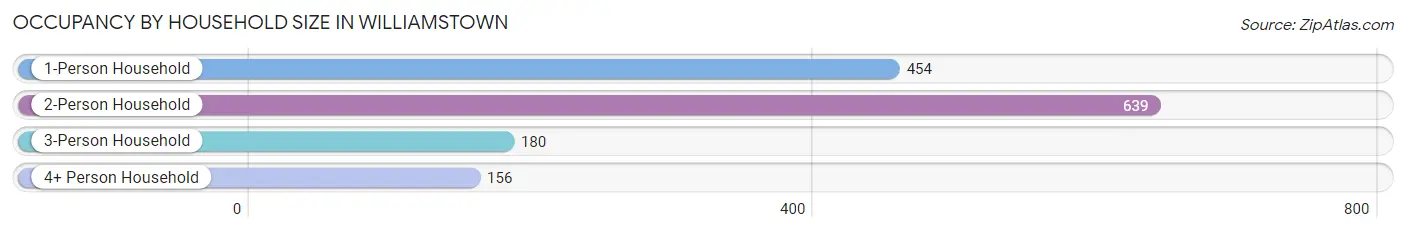
| Household Size | # Housing Units | % Housing Units |
| 1-Person Household | 454 | 31.8% |
| 2-Person Household | 639 | 44.7% |
| 3-Person Household | 180 | 12.6% |
| 4+ Person Household | 156 | 10.9% |
| Total Housing Units | 1,429 | 100.0% |
Occupancy by Ownership by Household Size in Williamstown
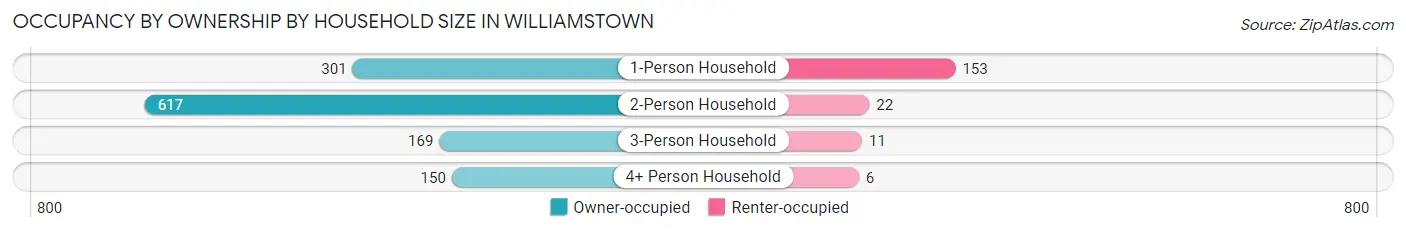
| Household Size | Owner-occupied | Renter-occupied |
| 1-Person Household | 301 (66.3%) | 153 (33.7%) |
| 2-Person Household | 617 (96.6%) | 22 (3.4%) |
| 3-Person Household | 169 (93.9%) | 11 (6.1%) |
| 4+ Person Household | 150 (96.2%) | 6 (3.8%) |
| Total Housing Units | 1,237 (86.6%) | 192 (13.4%) |
Occupancy by Educational Attainment in Williamstown
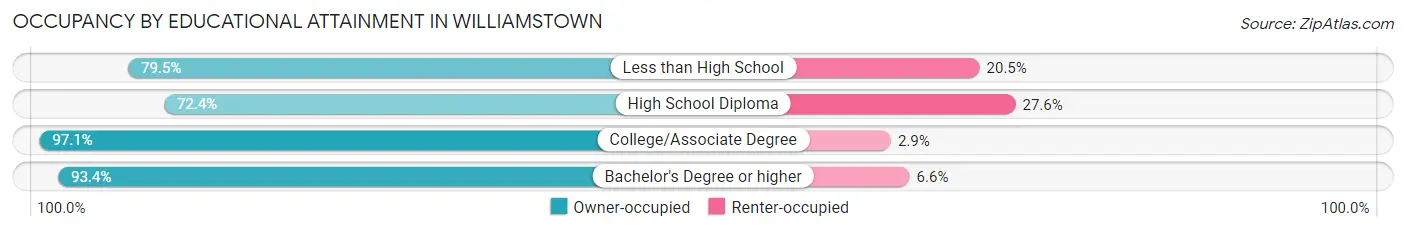
| Household Size | Owner-occupied | Renter-occupied |
| Less than High School | 31 (79.5%) | 8 (20.5%) |
| High School Diploma | 351 (72.4%) | 134 (27.6%) |
| College/Associate Degree | 264 (97.1%) | 8 (2.9%) |
| Bachelor's Degree or higher | 591 (93.4%) | 42 (6.6%) |
Occupancy by Age of Householder in Williamstown
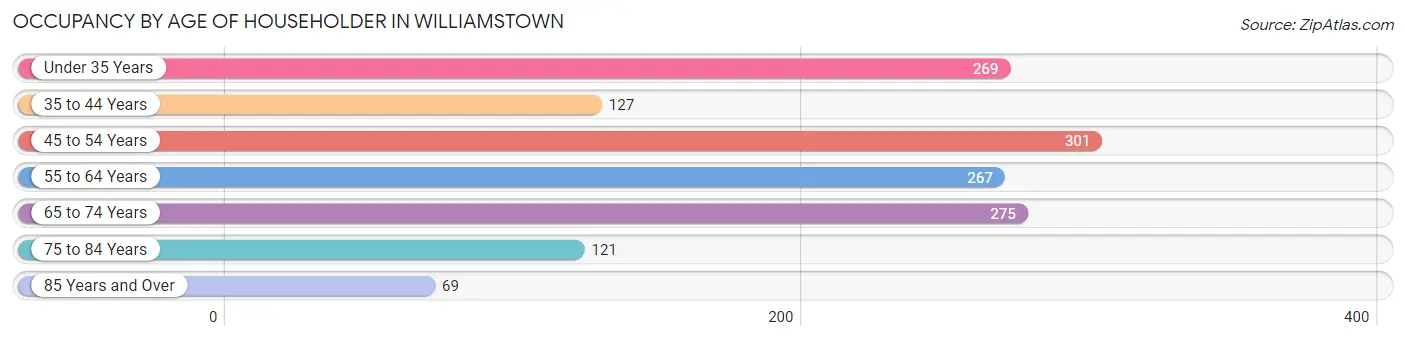
| Age Bracket | # Households | % Households |
| Under 35 Years | 269 | 18.8% |
| 35 to 44 Years | 127 | 8.9% |
| 45 to 54 Years | 301 | 21.1% |
| 55 to 64 Years | 267 | 18.7% |
| 65 to 74 Years | 275 | 19.2% |
| 75 to 84 Years | 121 | 8.5% |
| 85 Years and Over | 69 | 4.8% |
| Total | 1,429 | 100.0% |
Housing Finances in Williamstown
Median Income by Occupancy in Williamstown
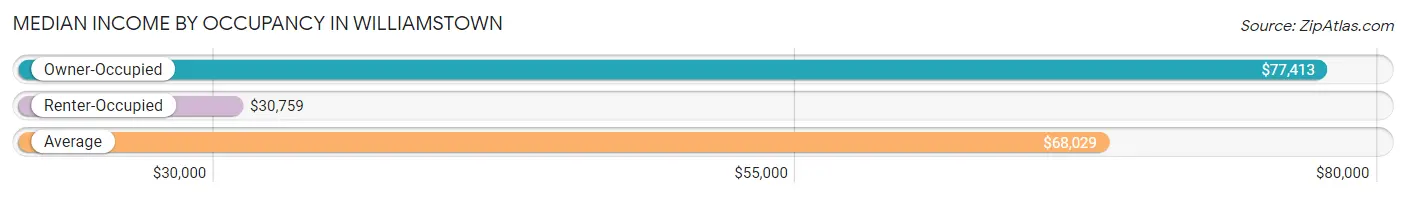
| Occupancy Type | # Households | Median Income |
| Owner-Occupied | 1,237 (86.6%) | $77,413 |
| Renter-Occupied | 192 (13.4%) | $30,759 |
| Average | 1,429 (100.0%) | $68,029 |
Occupancy by Householder Income Bracket in Williamstown
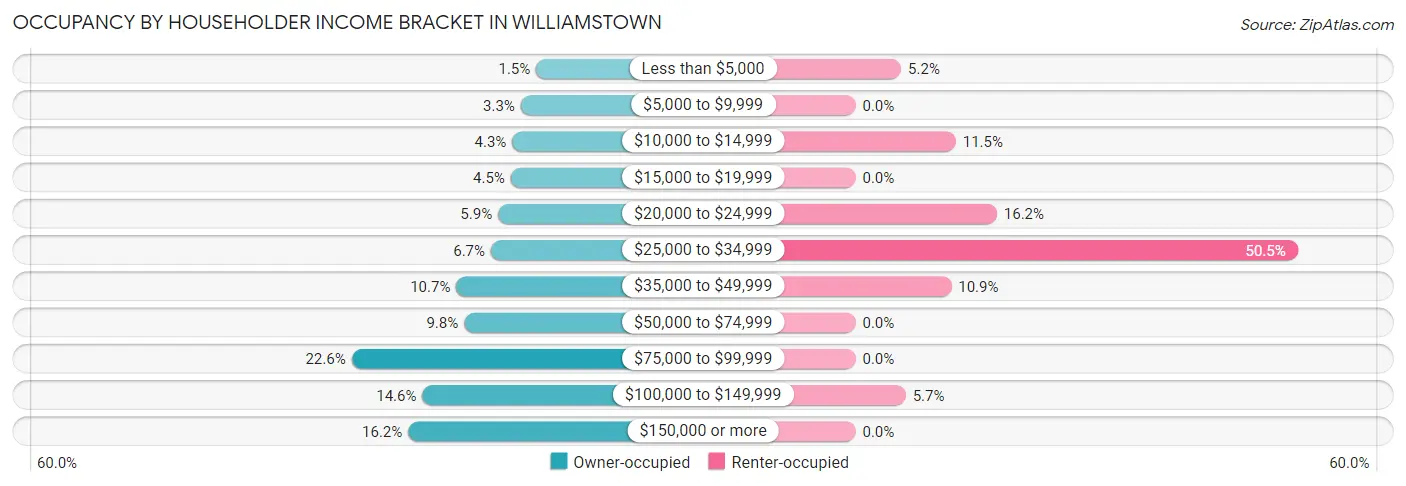
| Income Bracket | Owner-occupied | Renter-occupied |
| Less than $5,000 | 19 (1.5%) | 10 (5.2%) |
| $5,000 to $9,999 | 41 (3.3%) | 0 (0.0%) |
| $10,000 to $14,999 | 53 (4.3%) | 22 (11.5%) |
| $15,000 to $19,999 | 55 (4.4%) | 0 (0.0%) |
| $20,000 to $24,999 | 73 (5.9%) | 31 (16.2%) |
| $25,000 to $34,999 | 83 (6.7%) | 97 (50.5%) |
| $35,000 to $49,999 | 132 (10.7%) | 21 (10.9%) |
| $50,000 to $74,999 | 121 (9.8%) | 0 (0.0%) |
| $75,000 to $99,999 | 280 (22.6%) | 0 (0.0%) |
| $100,000 to $149,999 | 180 (14.5%) | 11 (5.7%) |
| $150,000 or more | 200 (16.2%) | 0 (0.0%) |
| Total | 1,237 (100.0%) | 192 (100.0%) |
Monthly Housing Cost Tiers in Williamstown
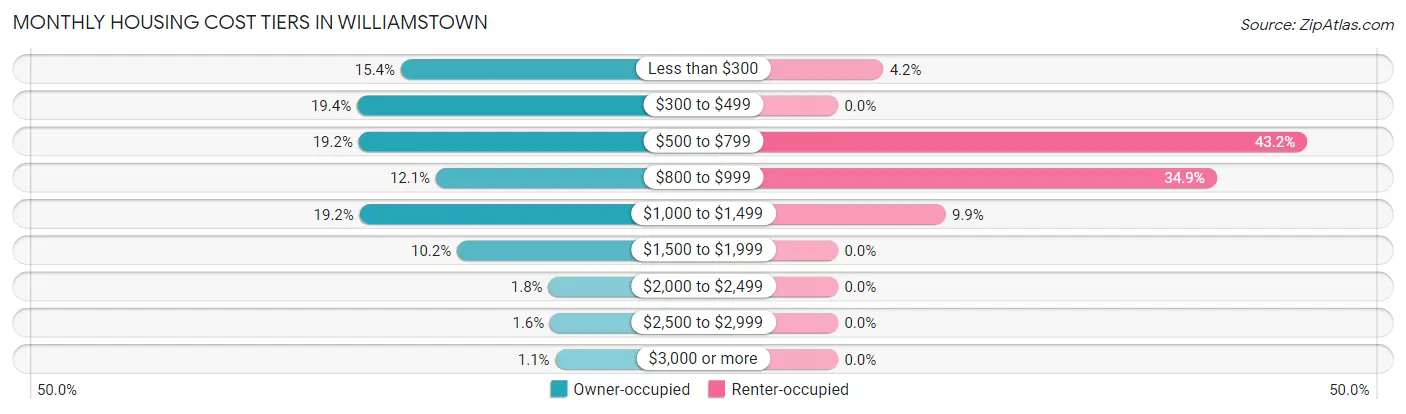
| Monthly Cost | Owner-occupied | Renter-occupied |
| Less than $300 | 190 (15.4%) | 8 (4.2%) |
| $300 to $499 | 240 (19.4%) | 0 (0.0%) |
| $500 to $799 | 238 (19.2%) | 83 (43.2%) |
| $800 to $999 | 150 (12.1%) | 67 (34.9%) |
| $1,000 to $1,499 | 237 (19.2%) | 19 (9.9%) |
| $1,500 to $1,999 | 126 (10.2%) | 0 (0.0%) |
| $2,000 to $2,499 | 22 (1.8%) | 0 (0.0%) |
| $2,500 to $2,999 | 20 (1.6%) | 0 (0.0%) |
| $3,000 or more | 14 (1.1%) | 0 (0.0%) |
| Total | 1,237 (100.0%) | 192 (100.0%) |
Physical Housing Characteristics in Williamstown
Housing Structures in Williamstown
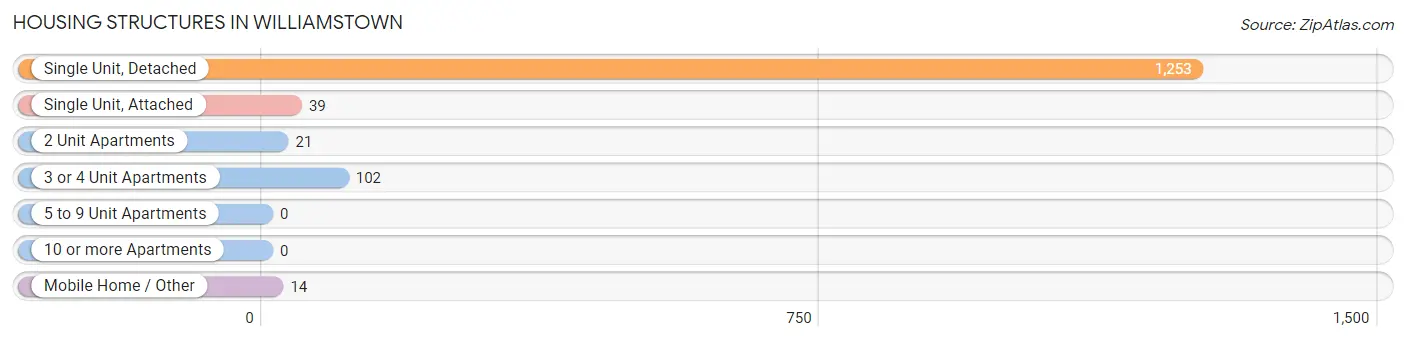
| Structure Type | # Housing Units | % Housing Units |
| Single Unit, Detached | 1,253 | 87.7% |
| Single Unit, Attached | 39 | 2.7% |
| 2 Unit Apartments | 21 | 1.5% |
| 3 or 4 Unit Apartments | 102 | 7.1% |
| 5 to 9 Unit Apartments | 0 | 0.0% |
| 10 or more Apartments | 0 | 0.0% |
| Mobile Home / Other | 14 | 1.0% |
| Total | 1,429 | 100.0% |
Housing Structures by Occupancy in Williamstown
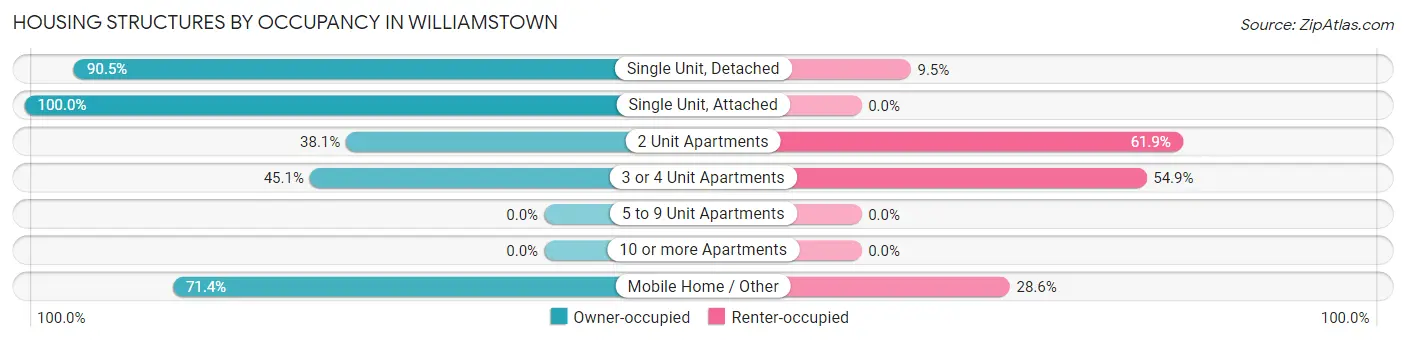
| Structure Type | Owner-occupied | Renter-occupied |
| Single Unit, Detached | 1,134 (90.5%) | 119 (9.5%) |
| Single Unit, Attached | 39 (100.0%) | 0 (0.0%) |
| 2 Unit Apartments | 8 (38.1%) | 13 (61.9%) |
| 3 or 4 Unit Apartments | 46 (45.1%) | 56 (54.9%) |
| 5 to 9 Unit Apartments | 0 (0.0%) | 0 (0.0%) |
| 10 or more Apartments | 0 (0.0%) | 0 (0.0%) |
| Mobile Home / Other | 10 (71.4%) | 4 (28.6%) |
| Total | 1,237 (86.6%) | 192 (13.4%) |
Housing Structures by Number of Rooms in Williamstown
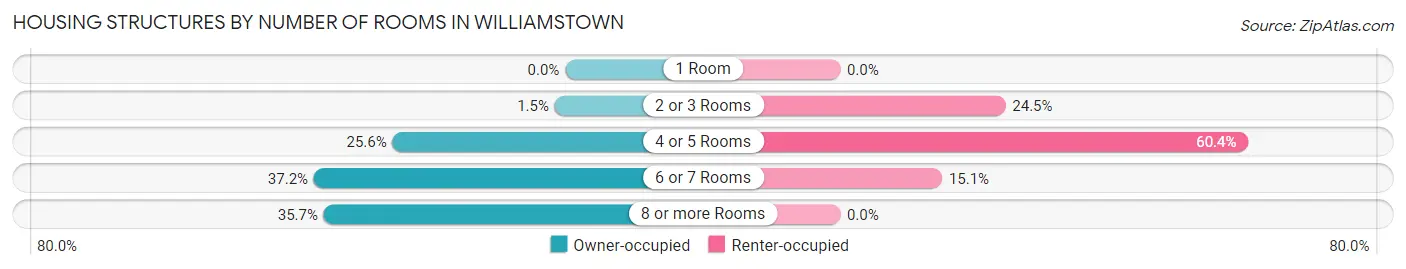
| Number of Rooms | Owner-occupied | Renter-occupied |
| 1 Room | 0 (0.0%) | 0 (0.0%) |
| 2 or 3 Rooms | 19 (1.5%) | 47 (24.5%) |
| 4 or 5 Rooms | 316 (25.6%) | 116 (60.4%) |
| 6 or 7 Rooms | 460 (37.2%) | 29 (15.1%) |
| 8 or more Rooms | 442 (35.7%) | 0 (0.0%) |
| Total | 1,237 (100.0%) | 192 (100.0%) |
Housing Structure by Heating Type in Williamstown
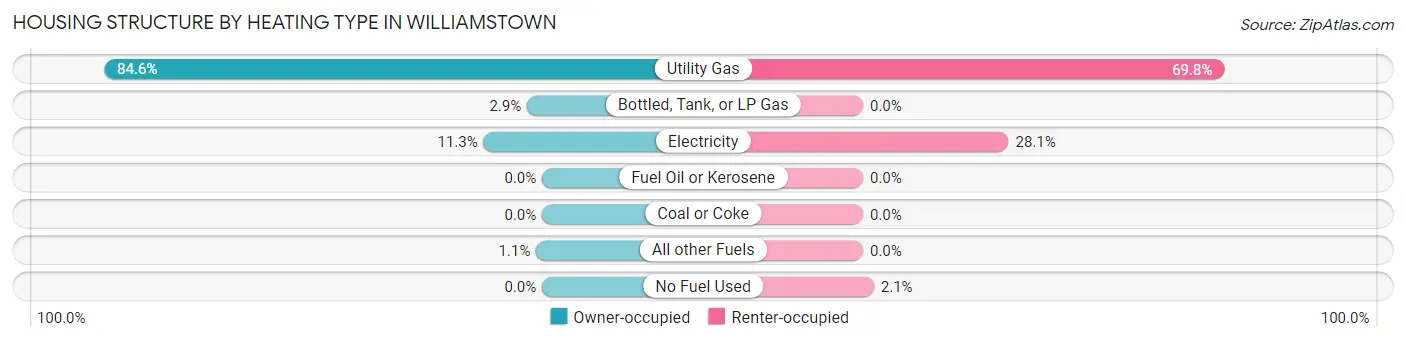
| Heating Type | Owner-occupied | Renter-occupied |
| Utility Gas | 1,047 (84.6%) | 134 (69.8%) |
| Bottled, Tank, or LP Gas | 36 (2.9%) | 0 (0.0%) |
| Electricity | 140 (11.3%) | 54 (28.1%) |
| Fuel Oil or Kerosene | 0 (0.0%) | 0 (0.0%) |
| Coal or Coke | 0 (0.0%) | 0 (0.0%) |
| All other Fuels | 14 (1.1%) | 0 (0.0%) |
| No Fuel Used | 0 (0.0%) | 4 (2.1%) |
| Total | 1,237 (100.0%) | 192 (100.0%) |
Household Vehicle Usage in Williamstown
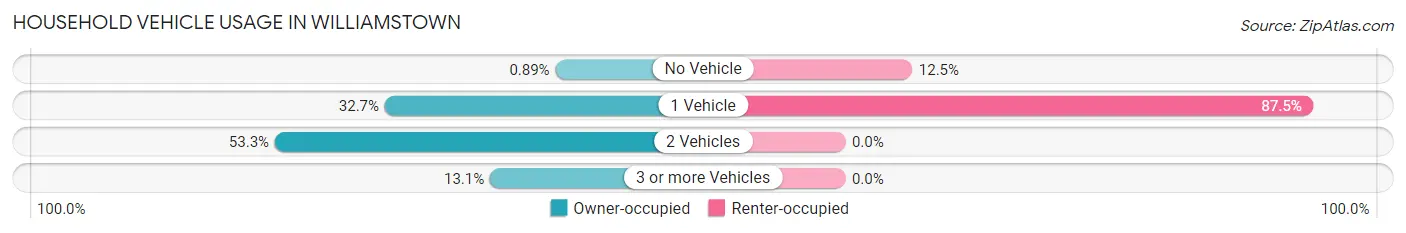
| Vehicles per Household | Owner-occupied | Renter-occupied |
| No Vehicle | 11 (0.9%) | 24 (12.5%) |
| 1 Vehicle | 405 (32.7%) | 168 (87.5%) |
| 2 Vehicles | 659 (53.3%) | 0 (0.0%) |
| 3 or more Vehicles | 162 (13.1%) | 0 (0.0%) |
| Total | 1,237 (100.0%) | 192 (100.0%) |
Real Estate & Mortgages in Williamstown
Real Estate and Mortgage Overview in Williamstown
| Characteristic | Without Mortgage | With Mortgage |
| Housing Units | 576 | 661 |
| Median Property Value | $123,400 | $187,500 |
| Median Household Income | $67,679 | $160 |
| Monthly Housing Costs | $376 | $14 |
| Real Estate Taxes | $1,178 | $11 |
Property Value by Mortgage Status in Williamstown
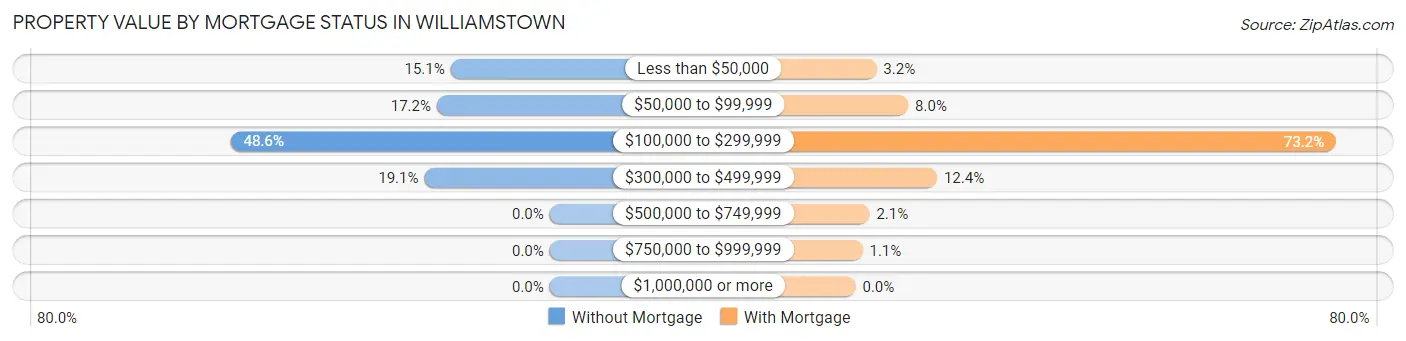
| Property Value | Without Mortgage | With Mortgage |
| Less than $50,000 | 87 (15.1%) | 21 (3.2%) |
| $50,000 to $99,999 | 99 (17.2%) | 53 (8.0%) |
| $100,000 to $299,999 | 280 (48.6%) | 484 (73.2%) |
| $300,000 to $499,999 | 110 (19.1%) | 82 (12.4%) |
| $500,000 to $749,999 | 0 (0.0%) | 14 (2.1%) |
| $750,000 to $999,999 | 0 (0.0%) | 7 (1.1%) |
| $1,000,000 or more | 0 (0.0%) | 0 (0.0%) |
| Total | 576 (100.0%) | 661 (100.0%) |
Household Income by Mortgage Status in Williamstown
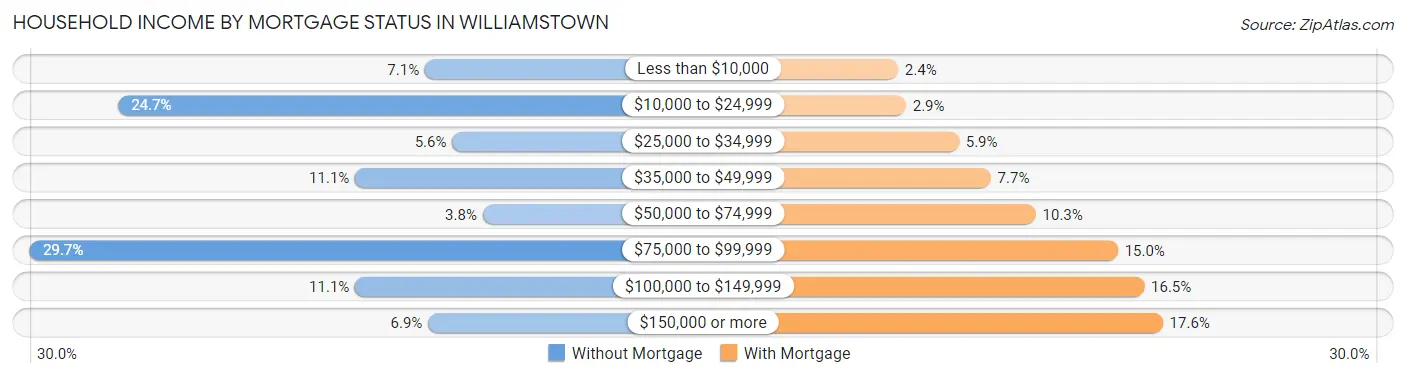
| Household Income | Without Mortgage | With Mortgage |
| Less than $10,000 | 41 (7.1%) | 16 (2.4%) |
| $10,000 to $24,999 | 142 (24.6%) | 19 (2.9%) |
| $25,000 to $34,999 | 32 (5.6%) | 39 (5.9%) |
| $35,000 to $49,999 | 64 (11.1%) | 51 (7.7%) |
| $50,000 to $74,999 | 22 (3.8%) | 68 (10.3%) |
| $75,000 to $99,999 | 171 (29.7%) | 99 (15.0%) |
| $100,000 to $149,999 | 64 (11.1%) | 109 (16.5%) |
| $150,000 or more | 40 (6.9%) | 116 (17.5%) |
| Total | 576 (100.0%) | 661 (100.0%) |
Property Value to Household Income Ratio in Williamstown
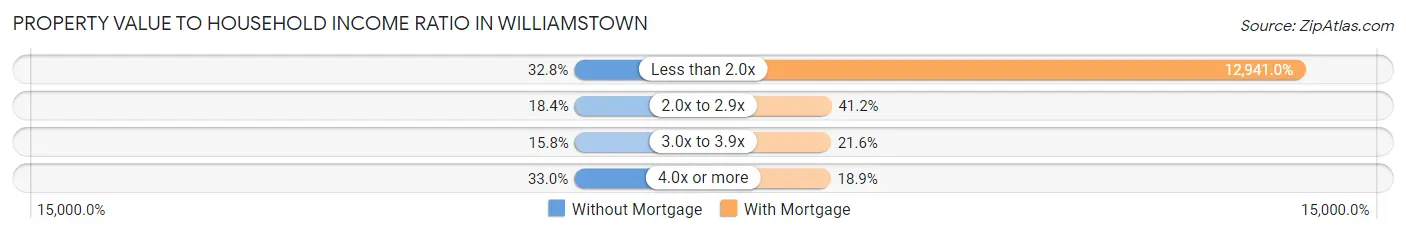
| Value-to-Income Ratio | Without Mortgage | With Mortgage |
| Less than 2.0x | 189 (32.8%) | 85,540 (12,941.0%) |
| 2.0x to 2.9x | 106 (18.4%) | 272 (41.1%) |
| 3.0x to 3.9x | 91 (15.8%) | 143 (21.6%) |
| 4.0x or more | 190 (33.0%) | 125 (18.9%) |
| Total | 576 (100.0%) | 661 (100.0%) |
Real Estate Taxes by Mortgage Status in Williamstown
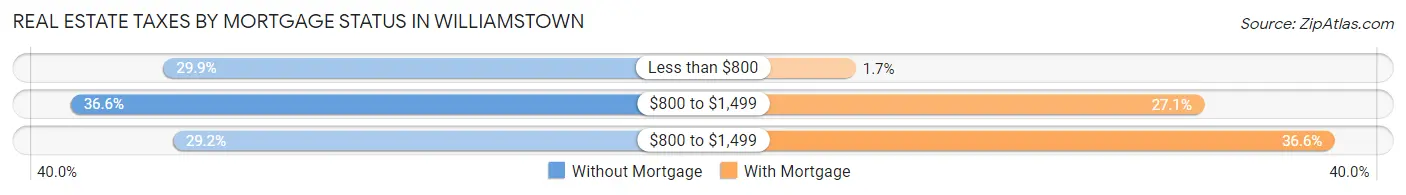
| Property Taxes | Without Mortgage | With Mortgage |
| Less than $800 | 172 (29.9%) | 11 (1.7%) |
| $800 to $1,499 | 211 (36.6%) | 179 (27.1%) |
| $800 to $1,499 | 168 (29.2%) | 242 (36.6%) |
| Total | 576 (100.0%) | 661 (100.0%) |
Health & Disability in Williamstown
Health Insurance Coverage by Age in Williamstown
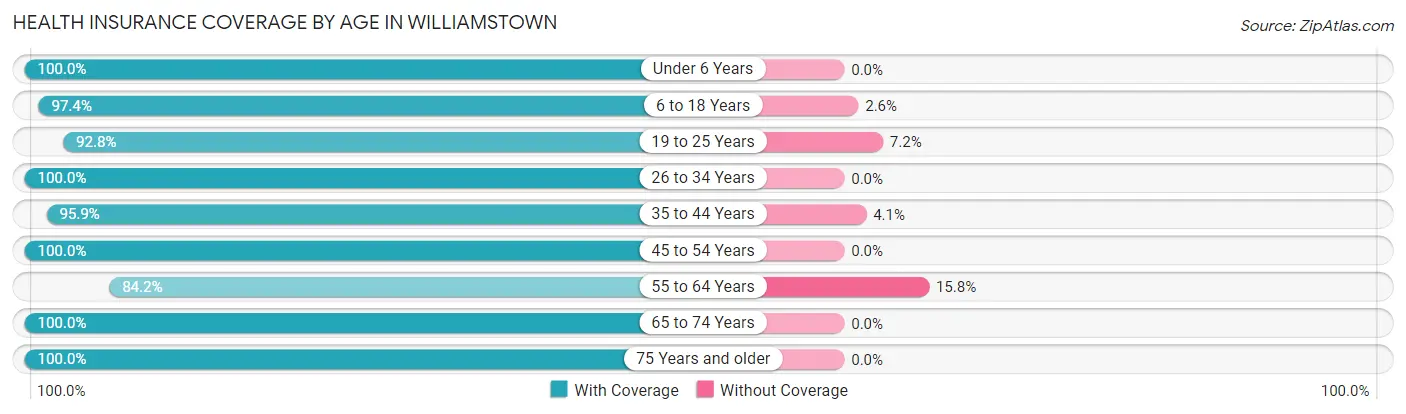
| Age Bracket | With Coverage | Without Coverage |
| Under 6 Years | 132 (100.0%) | 0 (0.0%) |
| 6 to 18 Years | 410 (97.4%) | 11 (2.6%) |
| 19 to 25 Years | 116 (92.8%) | 9 (7.2%) |
| 26 to 34 Years | 395 (100.0%) | 0 (0.0%) |
| 35 to 44 Years | 235 (95.9%) | 10 (4.1%) |
| 45 to 54 Years | 491 (100.0%) | 0 (0.0%) |
| 55 to 64 Years | 336 (84.2%) | 63 (15.8%) |
| 65 to 74 Years | 466 (100.0%) | 0 (0.0%) |
| 75 Years and older | 306 (100.0%) | 0 (0.0%) |
| Total | 2,887 (96.9%) | 93 (3.1%) |
Health Insurance Coverage by Citizenship Status in Williamstown
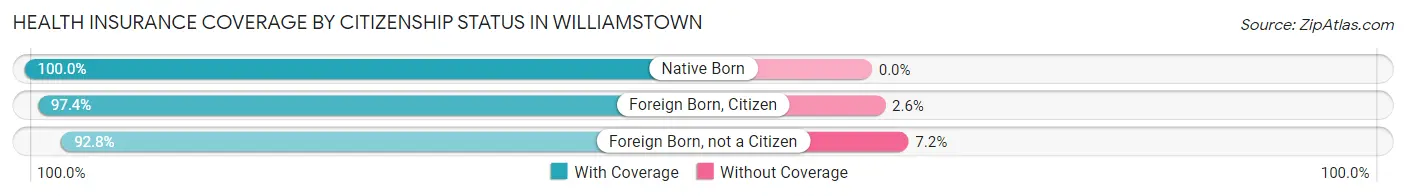
| Citizenship Status | With Coverage | Without Coverage |
| Native Born | 132 (100.0%) | 0 (0.0%) |
| Foreign Born, Citizen | 410 (97.4%) | 11 (2.6%) |
| Foreign Born, not a Citizen | 116 (92.8%) | 9 (7.2%) |
Health Insurance Coverage by Household Income in Williamstown
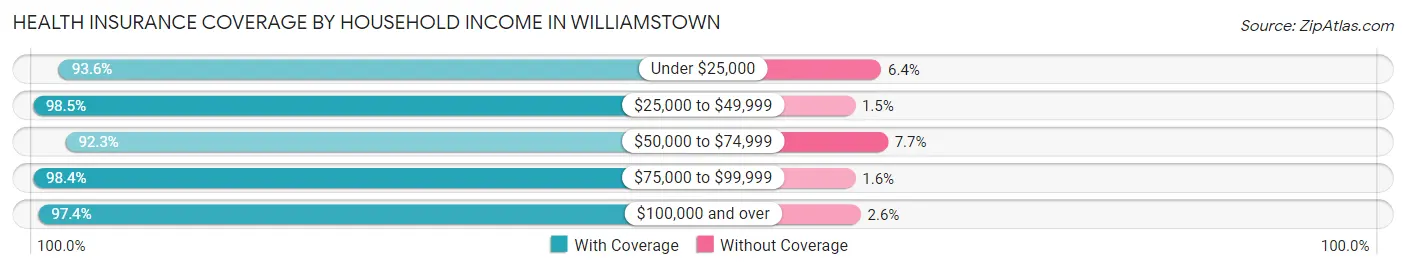
| Household Income | With Coverage | Without Coverage |
| Under $25,000 | 349 (93.6%) | 24 (6.4%) |
| $25,000 to $49,999 | 579 (98.5%) | 9 (1.5%) |
| $50,000 to $74,999 | 253 (92.3%) | 21 (7.7%) |
| $75,000 to $99,999 | 612 (98.4%) | 10 (1.6%) |
| $100,000 and over | 1,094 (97.4%) | 29 (2.6%) |
Public vs Private Health Insurance Coverage by Age in Williamstown
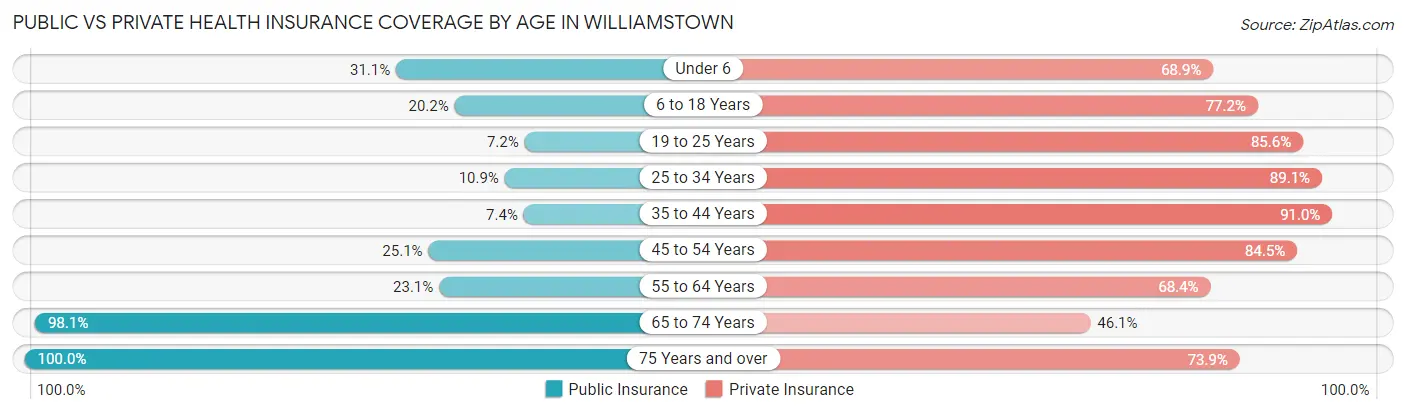
| Age Bracket | Public Insurance | Private Insurance |
| Under 6 | 41 (31.1%) | 91 (68.9%) |
| 6 to 18 Years | 85 (20.2%) | 325 (77.2%) |
| 19 to 25 Years | 9 (7.2%) | 107 (85.6%) |
| 25 to 34 Years | 43 (10.9%) | 352 (89.1%) |
| 35 to 44 Years | 18 (7.3%) | 223 (91.0%) |
| 45 to 54 Years | 123 (25.1%) | 415 (84.5%) |
| 55 to 64 Years | 92 (23.1%) | 273 (68.4%) |
| 65 to 74 Years | 457 (98.1%) | 215 (46.1%) |
| 75 Years and over | 306 (100.0%) | 226 (73.9%) |
| Total | 1,174 (39.4%) | 2,227 (74.7%) |
Disability Status by Sex by Age in Williamstown
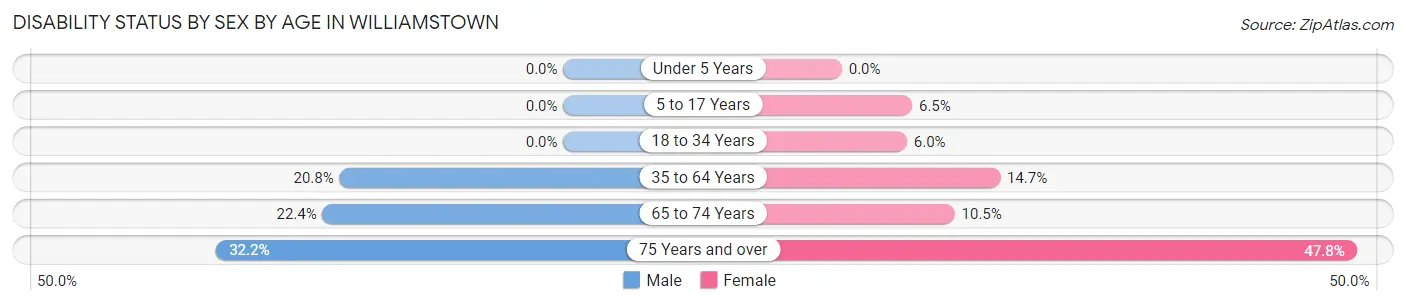
| Age Bracket | Male | Female |
| Under 5 Years | 0 (0.0%) | 0 (0.0%) |
| 5 to 17 Years | 0 (0.0%) | 15 (6.5%) |
| 18 to 34 Years | 0 (0.0%) | 16 (6.0%) |
| 35 to 64 Years | 114 (20.8%) | 86 (14.7%) |
| 65 to 74 Years | 38 (22.4%) | 31 (10.5%) |
| 75 Years and over | 48 (32.2%) | 75 (47.8%) |
Disability Class by Sex by Age in Williamstown
Disability Class: Hearing Difficulty
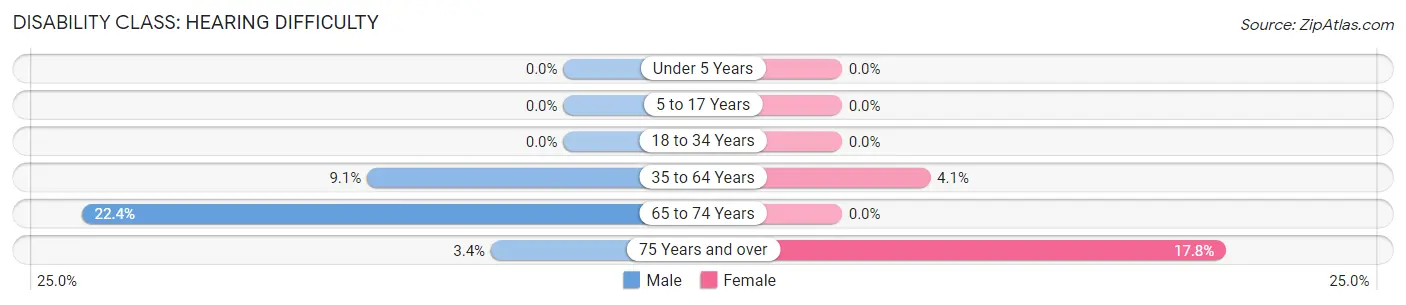
| Age Bracket | Male | Female |
| Under 5 Years | 0 (0.0%) | 0 (0.0%) |
| 5 to 17 Years | 0 (0.0%) | 0 (0.0%) |
| 18 to 34 Years | 0 (0.0%) | 0 (0.0%) |
| 35 to 64 Years | 50 (9.1%) | 24 (4.1%) |
| 65 to 74 Years | 38 (22.4%) | 0 (0.0%) |
| 75 Years and over | 5 (3.4%) | 28 (17.8%) |
Disability Class: Vision Difficulty
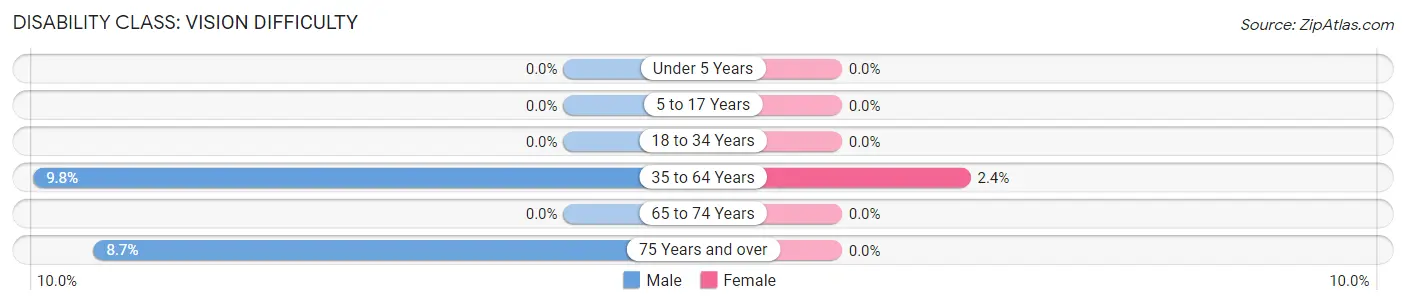
| Age Bracket | Male | Female |
| Under 5 Years | 0 (0.0%) | 0 (0.0%) |
| 5 to 17 Years | 0 (0.0%) | 0 (0.0%) |
| 18 to 34 Years | 0 (0.0%) | 0 (0.0%) |
| 35 to 64 Years | 54 (9.8%) | 14 (2.4%) |
| 65 to 74 Years | 0 (0.0%) | 0 (0.0%) |
| 75 Years and over | 13 (8.7%) | 0 (0.0%) |
Disability Class: Cognitive Difficulty
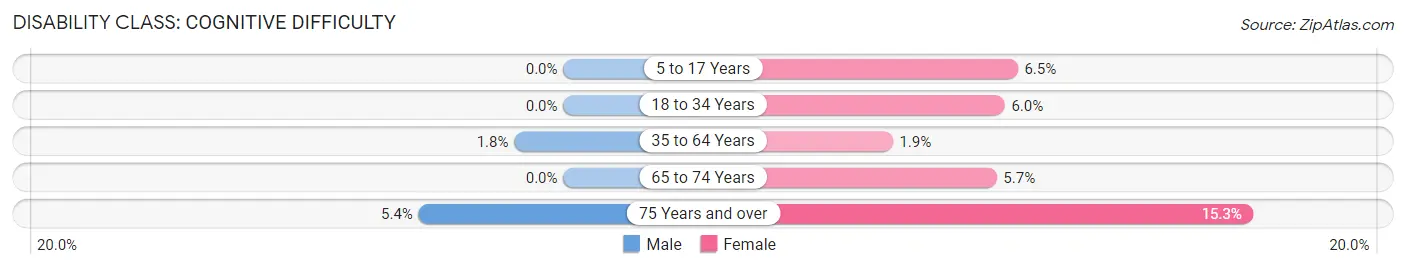
| Age Bracket | Male | Female |
| 5 to 17 Years | 0 (0.0%) | 15 (6.5%) |
| 18 to 34 Years | 0 (0.0%) | 16 (6.0%) |
| 35 to 64 Years | 10 (1.8%) | 11 (1.9%) |
| 65 to 74 Years | 0 (0.0%) | 17 (5.7%) |
| 75 Years and over | 8 (5.4%) | 24 (15.3%) |
Disability Class: Ambulatory Difficulty
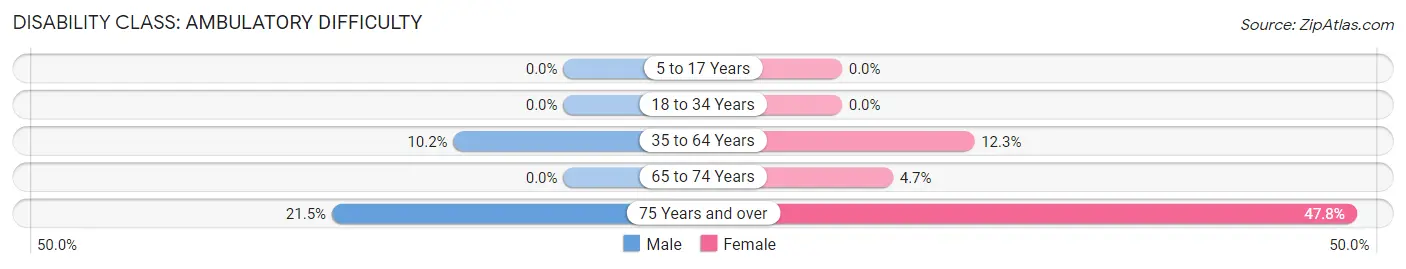
| Age Bracket | Male | Female |
| 5 to 17 Years | 0 (0.0%) | 0 (0.0%) |
| 18 to 34 Years | 0 (0.0%) | 0 (0.0%) |
| 35 to 64 Years | 56 (10.2%) | 72 (12.3%) |
| 65 to 74 Years | 0 (0.0%) | 14 (4.7%) |
| 75 Years and over | 32 (21.5%) | 75 (47.8%) |
Disability Class: Self-Care Difficulty
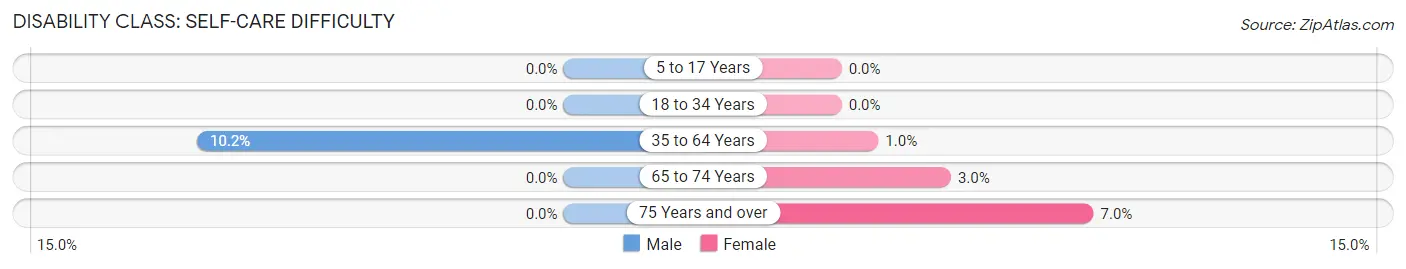
| Age Bracket | Male | Female |
| 5 to 17 Years | 0 (0.0%) | 0 (0.0%) |
| 18 to 34 Years | 0 (0.0%) | 0 (0.0%) |
| 35 to 64 Years | 56 (10.2%) | 6 (1.0%) |
| 65 to 74 Years | 0 (0.0%) | 9 (3.0%) |
| 75 Years and over | 0 (0.0%) | 11 (7.0%) |
Technology Access in Williamstown
Computing Device Access in Williamstown
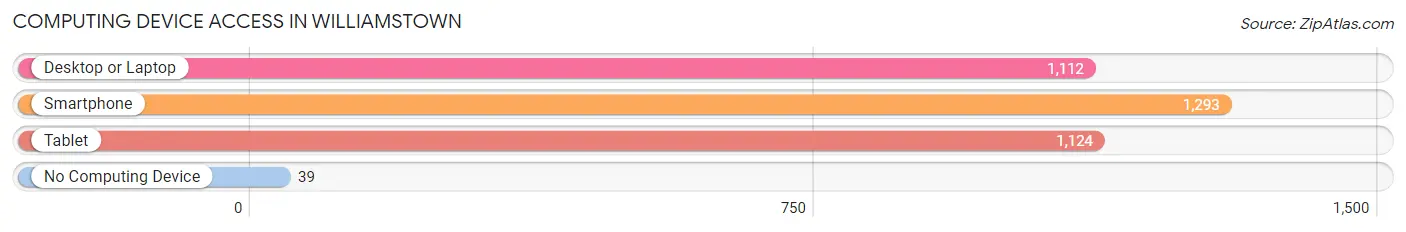
| Device Type | # Households | % Households |
| Desktop or Laptop | 1,112 | 77.8% |
| Smartphone | 1,293 | 90.5% |
| Tablet | 1,124 | 78.7% |
| No Computing Device | 39 | 2.7% |
| Total | 1,429 | 100.0% |
Internet Access in Williamstown
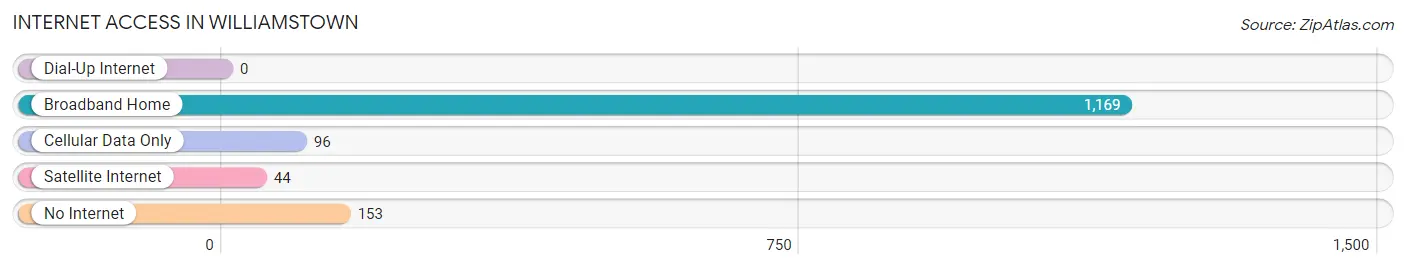
| Internet Type | # Households | % Households |
| Dial-Up Internet | 0 | 0.0% |
| Broadband Home | 1,169 | 81.8% |
| Cellular Data Only | 96 | 6.7% |
| Satellite Internet | 44 | 3.1% |
| No Internet | 153 | 10.7% |
| Total | 1,429 | 100.0% |
Williamstown Summary
Williamstown is a small town located in Wood County, West Virginia. It is situated along the Ohio River, just south of Parkersburg. The town was founded in 1810 and has a population of approximately 3,000 people.
Geography
Williamstown is located in the northern part of Wood County, West Virginia. It is situated along the Ohio River, just south of Parkersburg. The town is located in the Appalachian Plateau region of the state, and is surrounded by rolling hills and forests. The climate is humid and temperate, with hot summers and cold winters.
Economy
Williamstown’s economy is largely based on agriculture and manufacturing. The town is home to several large factories, including a paper mill, a plastics plant, and a steel mill. The town also has a number of small businesses, including restaurants, shops, and service providers.
Demographics
As of the 2010 census, Williamstown had a population of 3,068 people. The racial makeup of the town was 95.3% White, 1.2% African American, 0.3% Native American, 0.3% Asian, 0.1% Pacific Islander, 0.7% from other races, and 2.3% from two or more races. Hispanic or Latino of any race were 1.7% of the population.
The median income for a household in the town was $37,917, and the median income for a family was $45,938. Males had a median income of $35,938 versus $25,000 for females. The per capita income for the town was $17,917. About 8.2% of families and 10.2% of the population were below the poverty line, including 14.2% of those under age 18 and 8.3% of those age 65 or over.
History
Williamstown was founded in 1810 by William Lowther, a settler from Pennsylvania. The town was originally known as Lowther’s Station, but was later renamed Williamstown in honor of its founder. The town was incorporated in 1856.
Williamstown was an important stop on the Underground Railroad, and was home to several prominent abolitionists. The town was also the site of a major Civil War battle in 1862, when Union forces defeated Confederate troops.
In the late 19th century, Williamstown was a major center of the oil and gas industry. The town was home to several large oil refineries, and was the site of the first oil well in West Virginia.
Williamstown has remained a small, rural town throughout its history. The town has seen some growth in recent years, as it has become a popular destination for outdoor recreation. The town is home to several parks and trails, and is a popular spot for fishing, boating, and camping.
Common Questions
What is Per Capita Income in Williamstown?
Per Capita income in Williamstown is $42,496.
What is the Median Family Income in Williamstown?
Median Family Income in Williamstown is $86,735.
What is the Median Household income in Williamstown?
Median Household Income in Williamstown is $68,029.
What is Income or Wage Gap in Williamstown?
Income or Wage Gap in Williamstown is 33.1%.
Women in Williamstown earn 66.9 cents for every dollar earned by a man.
What is Inequality or Gini Index in Williamstown?
Inequality or Gini Index in Williamstown is 0.50.
What is the Total Population of Williamstown?
Total Population of Williamstown is 2,980.
What is the Total Male Population of Williamstown?
Total Male Population of Williamstown is 1,388.
What is the Total Female Population of Williamstown?
Total Female Population of Williamstown is 1,592.
What is the Ratio of Males per 100 Females in Williamstown?
There are 87.19 Males per 100 Females in Williamstown.
What is the Ratio of Females per 100 Males in Williamstown?
There are 114.70 Females per 100 Males in Williamstown.
What is the Median Population Age in Williamstown?
Median Population Age in Williamstown is 49.1 Years.
What is the Average Family Size in Williamstown
Average Family Size in Williamstown is 2.6 People.
What is the Average Household Size in Williamstown
Average Household Size in Williamstown is 2.1 People.
How Large is the Labor Force in Williamstown?
There are 1,471 People in the Labor Forcein in Williamstown.
What is the Percentage of People in the Labor Force in Williamstown?
59.2% of People are in the Labor Force in Williamstown.
What is the Unemployment Rate in Williamstown?
Unemployment Rate in Williamstown is 2.6%.