Glen Dale, WV Map & Demographics
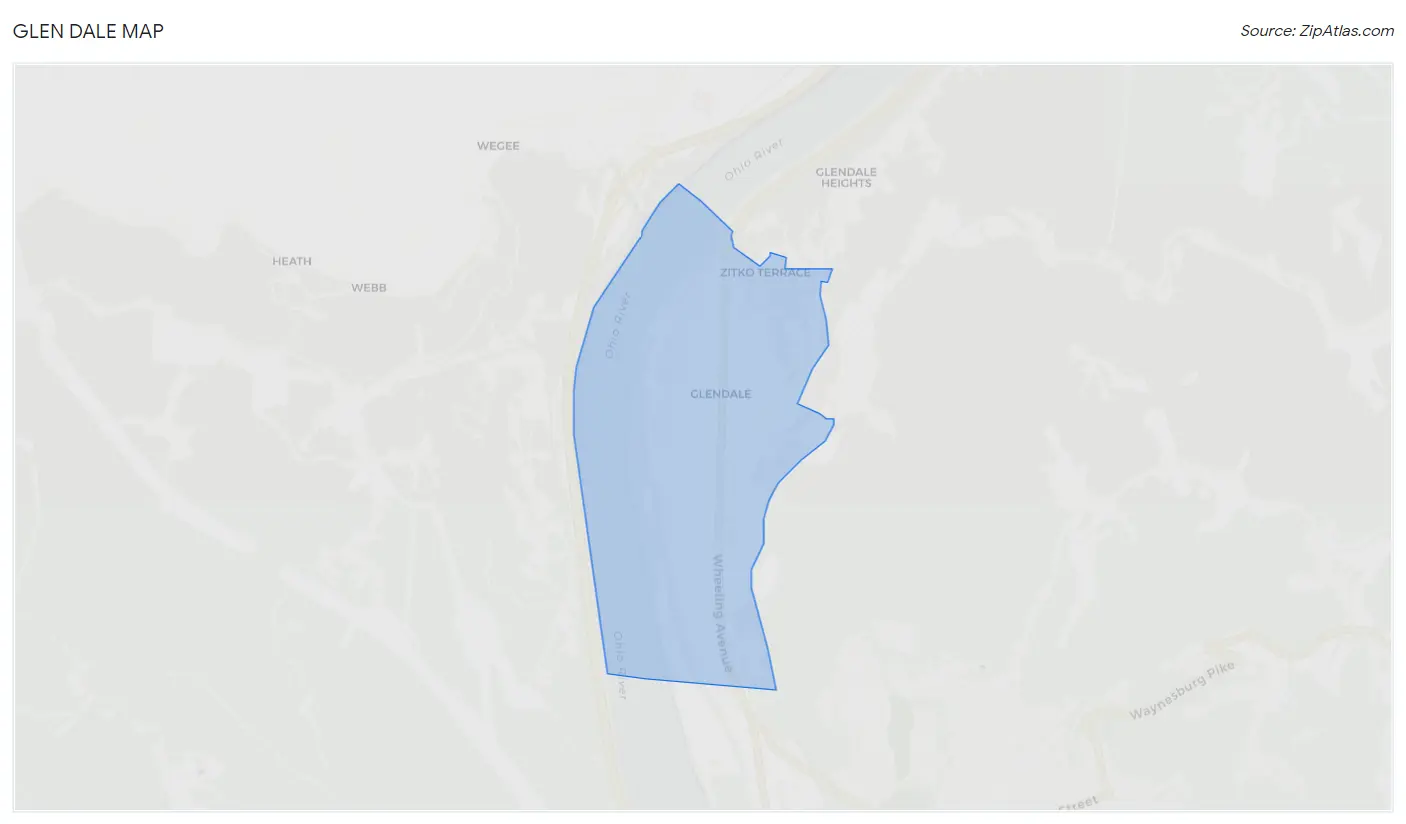
Glen Dale Map
Glen Dale Overview
$47,430
PER CAPITA INCOME
$118,750
AVG FAMILY INCOME
$80,917
AVG HOUSEHOLD INCOME
46.4%
WAGE / INCOME GAP [ % ]
53.6¢/ $1
WAGE / INCOME GAP [ $ ]
$11,018
FAMILY INCOME DEFICIT
0.47
INEQUALITY / GINI INDEX
1,614
TOTAL POPULATION
902
MALE POPULATION
712
FEMALE POPULATION
126.69
MALES / 100 FEMALES
78.94
FEMALES / 100 MALES
47.9
MEDIAN AGE
3.0
AVG FAMILY SIZE
2.4
AVG HOUSEHOLD SIZE
748
LABOR FORCE [ PEOPLE ]
56.4%
PERCENT IN LABOR FORCE
6.1%
UNEMPLOYMENT RATE
Glen Dale Zip Codes
Glen Dale Area Codes
Income in Glen Dale
Income Overview in Glen Dale
Per Capita Income in Glen Dale is $47,430, while median incomes of families and households are $118,750 and $80,917 respectively.
| Characteristic | Number | Measure |
| Per Capita Income | 1,614 | $47,430 |
| Median Family Income | 415 | $118,750 |
| Mean Family Income | 415 | $129,174 |
| Median Household Income | 685 | $80,917 |
| Mean Household Income | 685 | $102,020 |
| Income Deficit | 415 | $11,018 |
| Wage / Income Gap (%) | 1,614 | 46.41% |
| Wage / Income Gap ($) | 1,614 | 53.59¢ per $1 |
| Gini / Inequality Index | 1,614 | 0.47 |
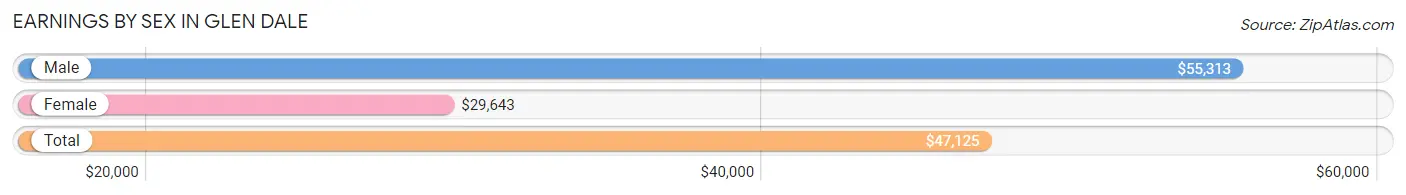
Earnings by Sex in Glen Dale
Average Earnings in Glen Dale are $47,125, $55,313 for men and $29,643 for women, a difference of 46.4%.
| Sex | Number | Average Earnings |
| Male | 519 (63.8%) | $55,313 |
| Female | 294 (36.2%) | $29,643 |
| Total | 813 (100.0%) | $47,125 |
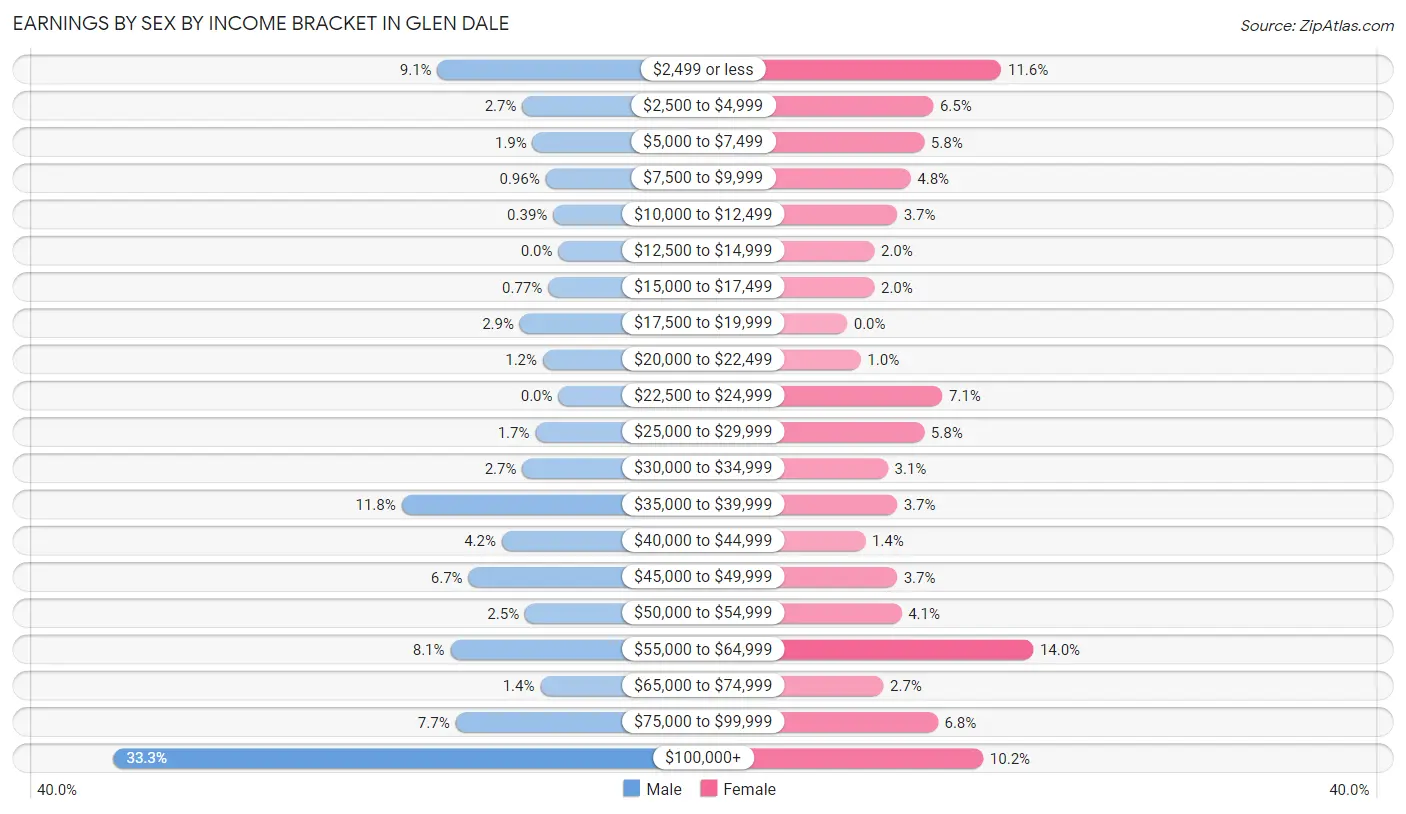
Earnings by Sex by Income Bracket in Glen Dale
The most common earnings brackets in Glen Dale are $100,000+ for men (173 | 33.3%) and $55,000 to $64,999 for women (41 | 14.0%).
| Income | Male | Female |
| $2,499 or less | 47 (9.1%) | 34 (11.6%) |
| $2,500 to $4,999 | 14 (2.7%) | 19 (6.5%) |
| $5,000 to $7,499 | 10 (1.9%) | 17 (5.8%) |
| $7,500 to $9,999 | 5 (1.0%) | 14 (4.8%) |
| $10,000 to $12,499 | 2 (0.4%) | 11 (3.7%) |
| $12,500 to $14,999 | 0 (0.0%) | 6 (2.0%) |
| $15,000 to $17,499 | 4 (0.8%) | 6 (2.0%) |
| $17,500 to $19,999 | 15 (2.9%) | 0 (0.0%) |
| $20,000 to $22,499 | 6 (1.2%) | 3 (1.0%) |
| $22,500 to $24,999 | 0 (0.0%) | 21 (7.1%) |
| $25,000 to $29,999 | 9 (1.7%) | 17 (5.8%) |
| $30,000 to $34,999 | 14 (2.7%) | 9 (3.1%) |
| $35,000 to $39,999 | 61 (11.7%) | 11 (3.7%) |
| $40,000 to $44,999 | 22 (4.2%) | 4 (1.4%) |
| $45,000 to $49,999 | 35 (6.7%) | 11 (3.7%) |
| $50,000 to $54,999 | 13 (2.5%) | 12 (4.1%) |
| $55,000 to $64,999 | 42 (8.1%) | 41 (14.0%) |
| $65,000 to $74,999 | 7 (1.3%) | 8 (2.7%) |
| $75,000 to $99,999 | 40 (7.7%) | 20 (6.8%) |
| $100,000+ | 173 (33.3%) | 30 (10.2%) |
| Total | 519 (100.0%) | 294 (100.0%) |
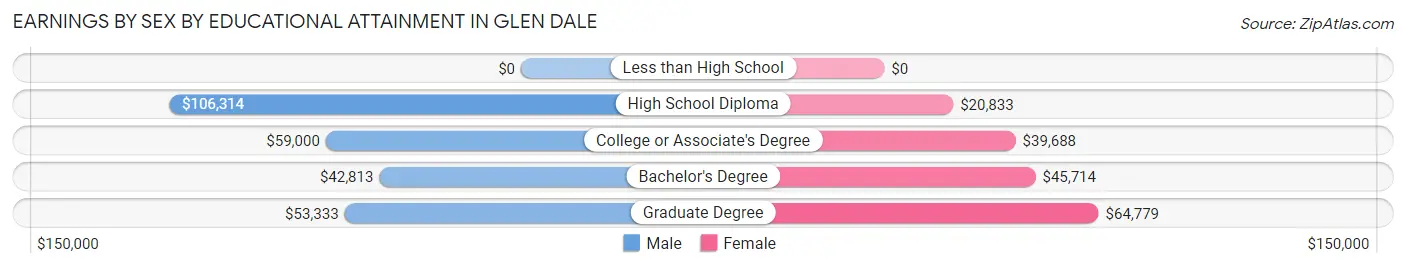
Earnings by Sex by Educational Attainment in Glen Dale
Average earnings in Glen Dale are $58,947 for men and $45,357 for women, a difference of 23.1%. Men with an educational attainment of high school diploma enjoy the highest average annual earnings of $106,314, while those with bachelor's degree education earn the least with $42,813. Women with an educational attainment of graduate degree earn the most with the average annual earnings of $64,779, while those with high school diploma education have the smallest earnings of $20,833.
| Educational Attainment | Male Income | Female Income |
| Less than High School | - | - |
| High School Diploma | $106,314 | $20,833 |
| College or Associate's Degree | $59,000 | $39,688 |
| Bachelor's Degree | $42,813 | $45,714 |
| Graduate Degree | $53,333 | $64,779 |
| Total | $58,947 | $45,357 |
Family Income in Glen Dale
Family Income Brackets in Glen Dale
According to the Glen Dale family income data, there are 102 families falling into the $150,000 to $199,999 income range, which is the most common income bracket and makes up 24.6% of all families.
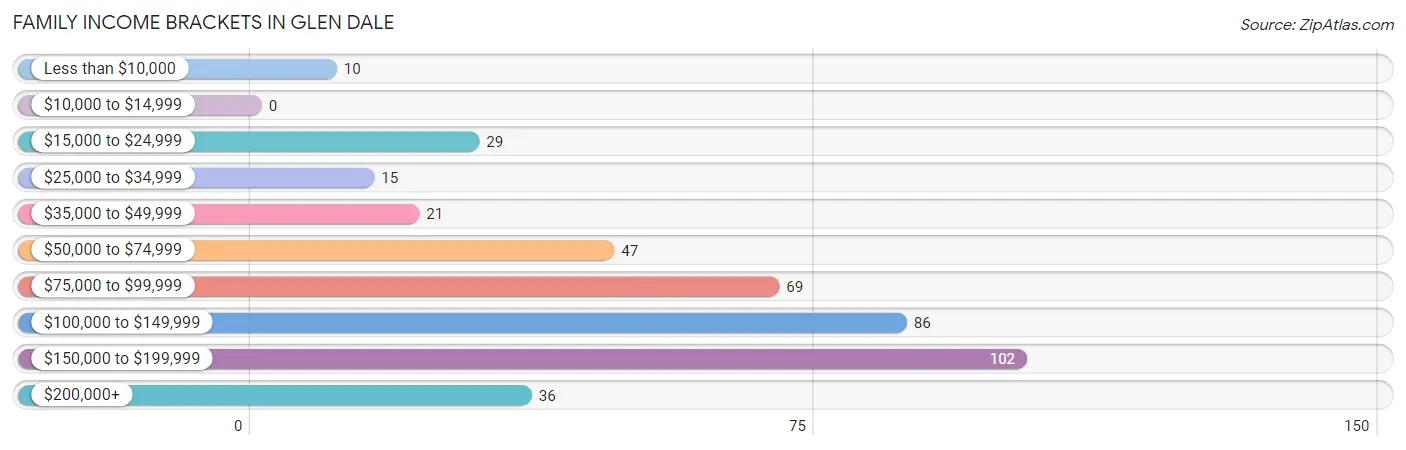
| Income Bracket | # Families | % Families |
| Less than $10,000 | 10 | 2.4% |
| $10,000 to $14,999 | 0 | 0.0% |
| $15,000 to $24,999 | 29 | 7.0% |
| $25,000 to $34,999 | 15 | 3.6% |
| $35,000 to $49,999 | 21 | 5.1% |
| $50,000 to $74,999 | 47 | 11.3% |
| $75,000 to $99,999 | 69 | 16.6% |
| $100,000 to $149,999 | 86 | 20.7% |
| $150,000 to $199,999 | 102 | 24.6% |
| $200,000+ | 36 | 8.7% |
Family Income by Famaliy Size in Glen Dale
5-person families (44 | 10.6%) account for the highest median family income in Glen Dale with $180,625 per family, while 3-person families (117 | 28.2%) have the highest median income of $50,921 per family member.
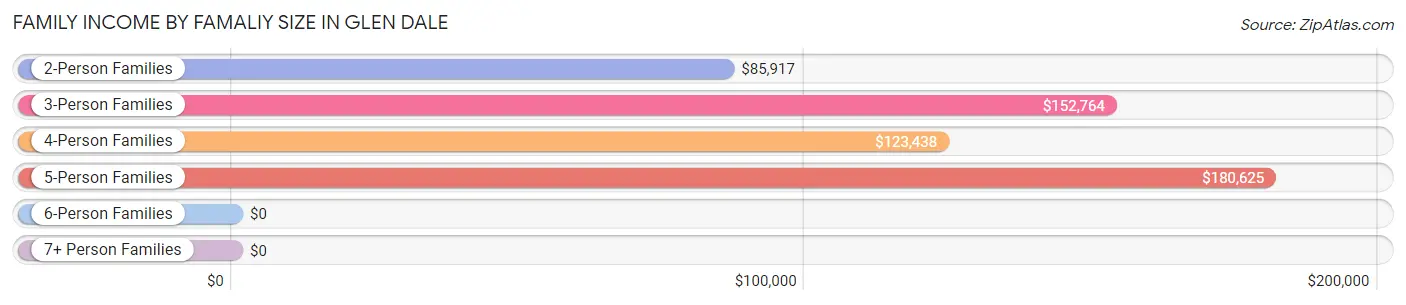
| Income Bracket | # Families | Median Income |
| 2-Person Families | 215 (51.8%) | $85,917 |
| 3-Person Families | 117 (28.2%) | $152,764 |
| 4-Person Families | 36 (8.7%) | $123,438 |
| 5-Person Families | 44 (10.6%) | $180,625 |
| 6-Person Families | 3 (0.7%) | $0 |
| 7+ Person Families | 0 (0.0%) | $0 |
| Total | 415 (100.0%) | $118,750 |
Family Income by Number of Earners in Glen Dale
The median family income in Glen Dale is $118,750, with families comprising 3+ earners (42) having the highest median family income of $181,563, while families with no earners (89) have the lowest median family income of $82,788, accounting for 10.1% and 21.4% of families, respectively.
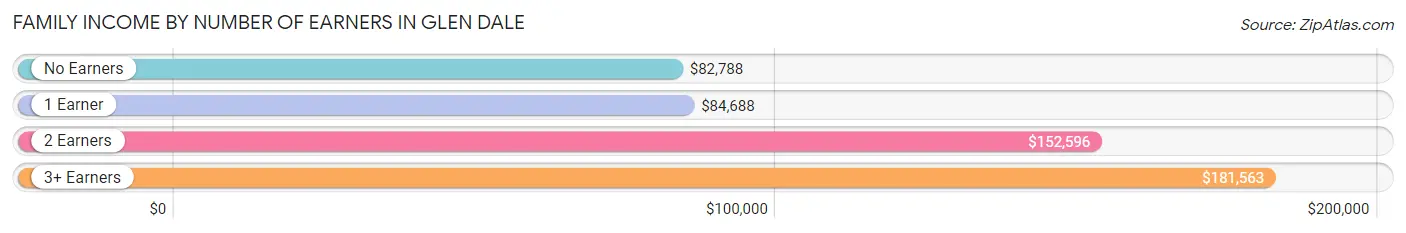
| Number of Earners | # Families | Median Income |
| No Earners | 89 (21.4%) | $82,788 |
| 1 Earner | 126 (30.4%) | $84,688 |
| 2 Earners | 158 (38.1%) | $152,596 |
| 3+ Earners | 42 (10.1%) | $181,563 |
| Total | 415 (100.0%) | $118,750 |
Household Income in Glen Dale
Household Income Brackets in Glen Dale
With 110 households falling in the category, the $150,000 to $199,999 income range is the most frequent in Glen Dale, accounting for 16.1% of all households. In contrast, only 11 households (1.6%) fall into the $10,000 to $14,999 income bracket, making it the least populous group.
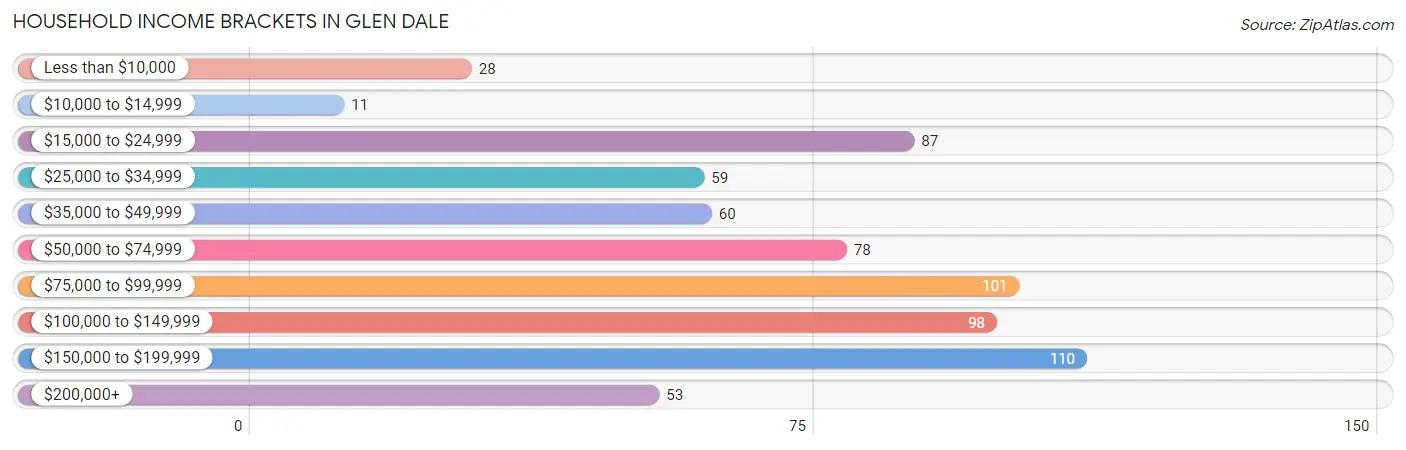
| Income Bracket | # Households | % Households |
| Less than $10,000 | 28 | 4.1% |
| $10,000 to $14,999 | 11 | 1.6% |
| $15,000 to $24,999 | 87 | 12.7% |
| $25,000 to $34,999 | 59 | 8.6% |
| $35,000 to $49,999 | 60 | 8.8% |
| $50,000 to $74,999 | 78 | 11.4% |
| $75,000 to $99,999 | 101 | 14.7% |
| $100,000 to $149,999 | 98 | 14.3% |
| $150,000 to $199,999 | 110 | 16.1% |
| $200,000+ | 53 | 7.7% |
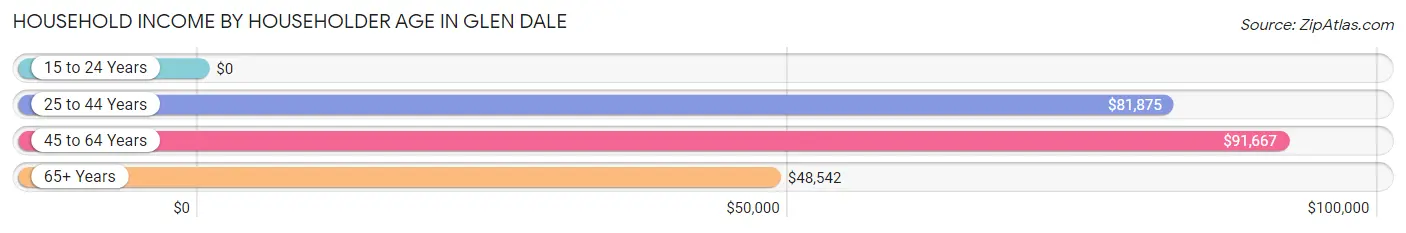
Household Income by Householder Age in Glen Dale
The median household income in Glen Dale is $80,917, with the highest median household income of $91,667 found in the 45 to 64 years age bracket for the primary householder. A total of 326 households (47.6%) fall into this category.
| Income Bracket | # Households | Median Income |
| 15 to 24 Years | 0 (0.0%) | $0 |
| 25 to 44 Years | 120 (17.5%) | $81,875 |
| 45 to 64 Years | 326 (47.6%) | $91,667 |
| 65+ Years | 239 (34.9%) | $48,542 |
| Total | 685 (100.0%) | $80,917 |
Poverty in Glen Dale
Income Below Poverty by Sex and Age in Glen Dale
With 13.3% poverty level for males and 8.0% for females among the residents of Glen Dale, 15 year old males and 15 year old females are the most vulnerable to poverty, with 11 males (73.3%) and 5 females (50.0%) in their respective age groups living below the poverty level.
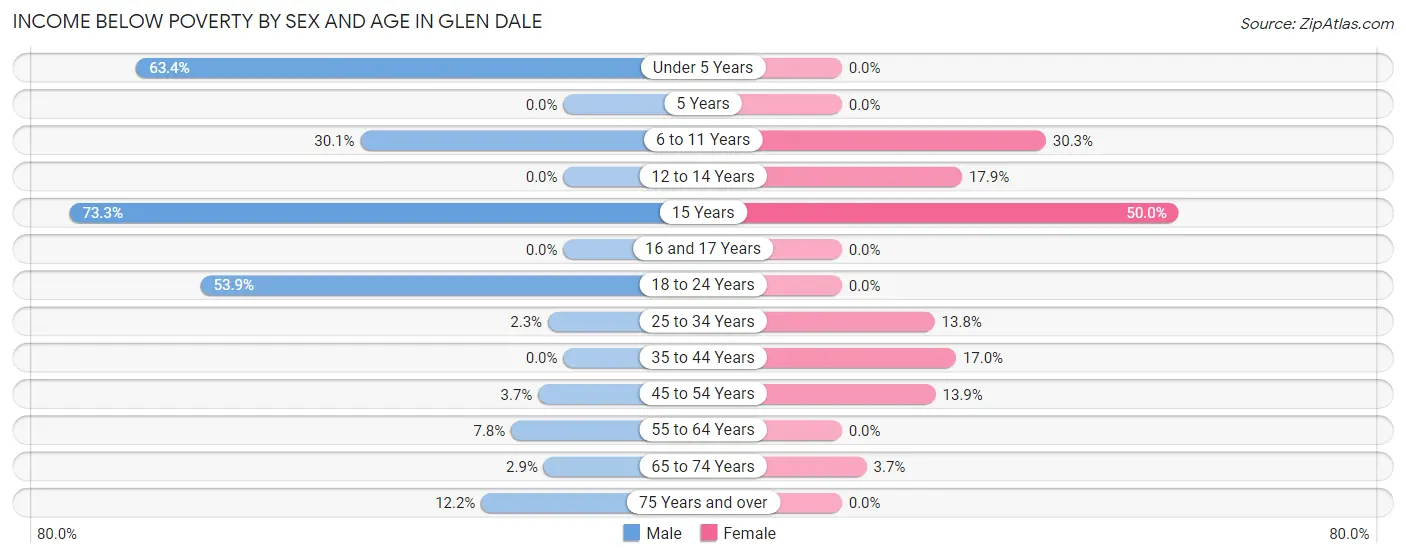
| Age Bracket | Male | Female |
| Under 5 Years | 26 (63.4%) | 0 (0.0%) |
| 5 Years | 0 (0.0%) | 0 (0.0%) |
| 6 to 11 Years | 22 (30.1%) | 10 (30.3%) |
| 12 to 14 Years | 0 (0.0%) | 5 (17.9%) |
| 15 Years | 11 (73.3%) | 5 (50.0%) |
| 16 and 17 Years | 0 (0.0%) | 0 (0.0%) |
| 18 to 24 Years | 28 (53.8%) | 0 (0.0%) |
| 25 to 34 Years | 4 (2.3%) | 8 (13.8%) |
| 35 to 44 Years | 0 (0.0%) | 10 (17.0%) |
| 45 to 54 Years | 4 (3.7%) | 11 (13.9%) |
| 55 to 64 Years | 17 (7.8%) | 0 (0.0%) |
| 65 to 74 Years | 3 (2.9%) | 6 (3.7%) |
| 75 Years and over | 5 (12.2%) | 0 (0.0%) |
| Total | 120 (13.3%) | 55 (8.0%) |
Income Above Poverty by Sex and Age in Glen Dale
According to the poverty statistics in Glen Dale, males aged 5 years and females aged under 5 years are the age groups that are most secure financially, with 100.0% of males and 100.0% of females in these age groups living above the poverty line.
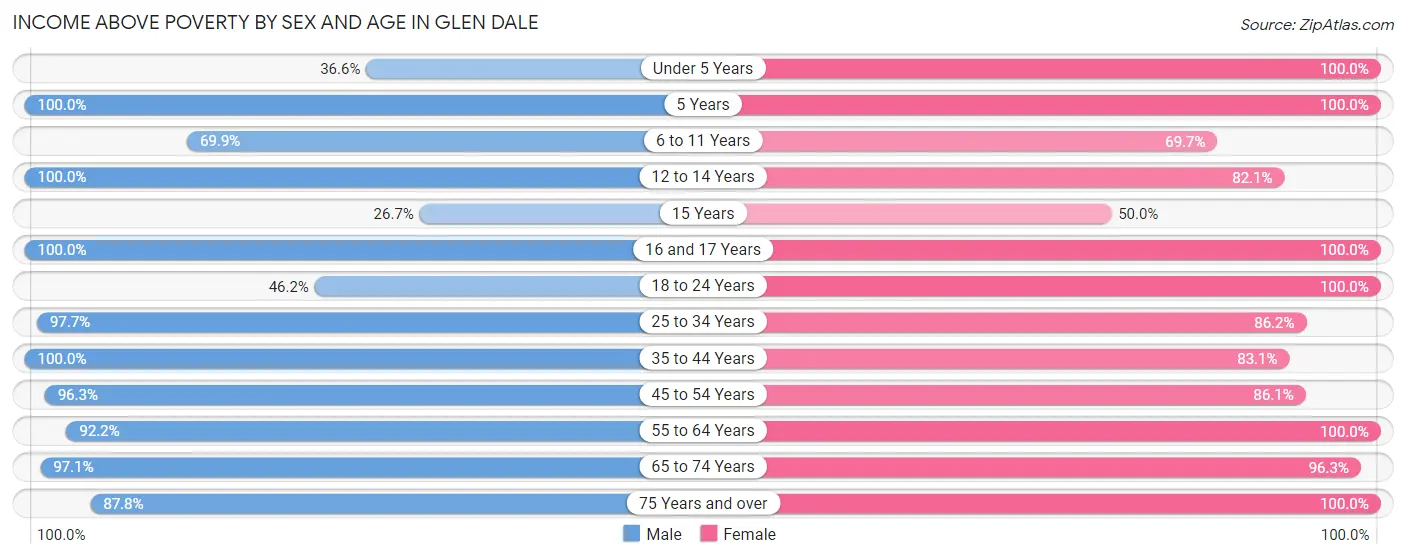
| Age Bracket | Male | Female |
| Under 5 Years | 15 (36.6%) | 22 (100.0%) |
| 5 Years | 5 (100.0%) | 3 (100.0%) |
| 6 to 11 Years | 51 (69.9%) | 23 (69.7%) |
| 12 to 14 Years | 30 (100.0%) | 23 (82.1%) |
| 15 Years | 4 (26.7%) | 5 (50.0%) |
| 16 and 17 Years | 8 (100.0%) | 13 (100.0%) |
| 18 to 24 Years | 24 (46.2%) | 40 (100.0%) |
| 25 to 34 Years | 171 (97.7%) | 50 (86.2%) |
| 35 to 44 Years | 33 (100.0%) | 49 (83.1%) |
| 45 to 54 Years | 103 (96.3%) | 68 (86.1%) |
| 55 to 64 Years | 202 (92.2%) | 90 (100.0%) |
| 65 to 74 Years | 100 (97.1%) | 157 (96.3%) |
| 75 Years and over | 36 (87.8%) | 87 (100.0%) |
| Total | 782 (86.7%) | 630 (92.0%) |
Income Below Poverty Among Married-Couple Families in Glen Dale
The poverty statistics for married-couple families in Glen Dale show that 3.3% or 11 of the total 329 families live below the poverty line. Families with 3 or 4 children have the highest poverty rate of 10.8%, comprising of 4 families. On the other hand, families with 1 or 2 children have the lowest poverty rate of 0.0%, which includes 0 families.
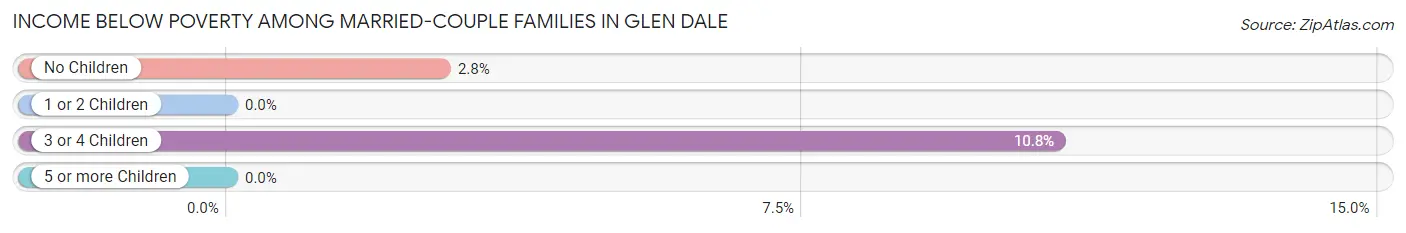
| Children | Above Poverty | Below Poverty |
| No Children | 245 (97.2%) | 7 (2.8%) |
| 1 or 2 Children | 40 (100.0%) | 0 (0.0%) |
| 3 or 4 Children | 33 (89.2%) | 4 (10.8%) |
| 5 or more Children | 0 (0.0%) | 0 (0.0%) |
| Total | 318 (96.7%) | 11 (3.3%) |
Income Below Poverty Among Single-Parent Households in Glen Dale
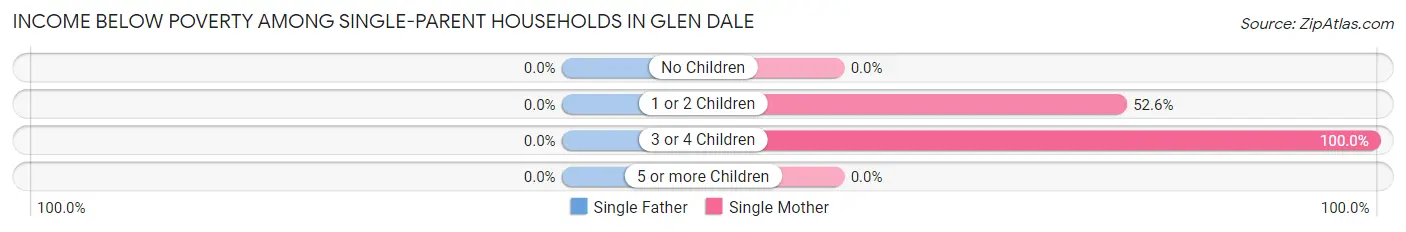
| Children | Single Father | Single Mother |
| No Children | 0 (0.0%) | 0 (0.0%) |
| 1 or 2 Children | 0 (0.0%) | 10 (52.6%) |
| 3 or 4 Children | 0 (0.0%) | 7 (100.0%) |
| 5 or more Children | 0 (0.0%) | 0 (0.0%) |
| Total | 0 (0.0%) | 17 (37.0%) |
Income Below Poverty Among Married-Couple vs Single-Parent Households in Glen Dale
The poverty data for Glen Dale shows that 11 of the married-couple family households (3.3%) and 17 of the single-parent households (19.8%) are living below the poverty level. Within the married-couple family households, those with 3 or 4 children have the highest poverty rate, with 4 households (10.8%) falling below the poverty line. Among the single-parent households, those with 3 or 4 children have the highest poverty rate, with 7 household (100.0%) living below poverty.
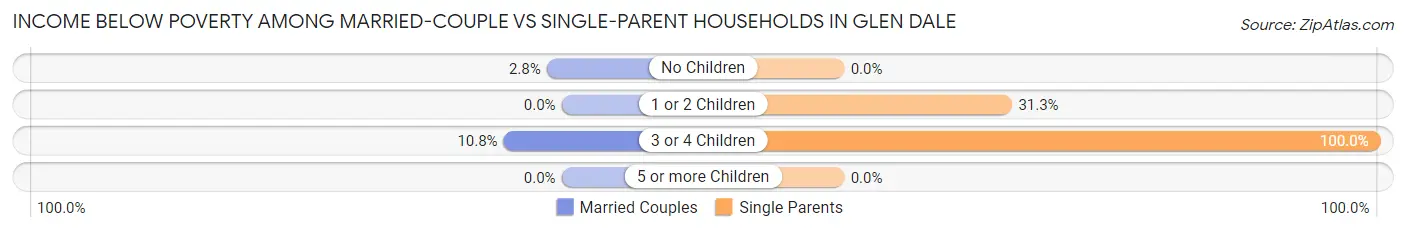
| Children | Married-Couple Families | Single-Parent Households |
| No Children | 7 (2.8%) | 0 (0.0%) |
| 1 or 2 Children | 0 (0.0%) | 10 (31.2%) |
| 3 or 4 Children | 4 (10.8%) | 7 (100.0%) |
| 5 or more Children | 0 (0.0%) | 0 (0.0%) |
| Total | 11 (3.3%) | 17 (19.8%) |
Race in Glen Dale
The most populous races in Glen Dale are White / Caucasian (1,486 | 92.1%), Two or more Races (89 | 5.5%), and Black / African American (36 | 2.2%).
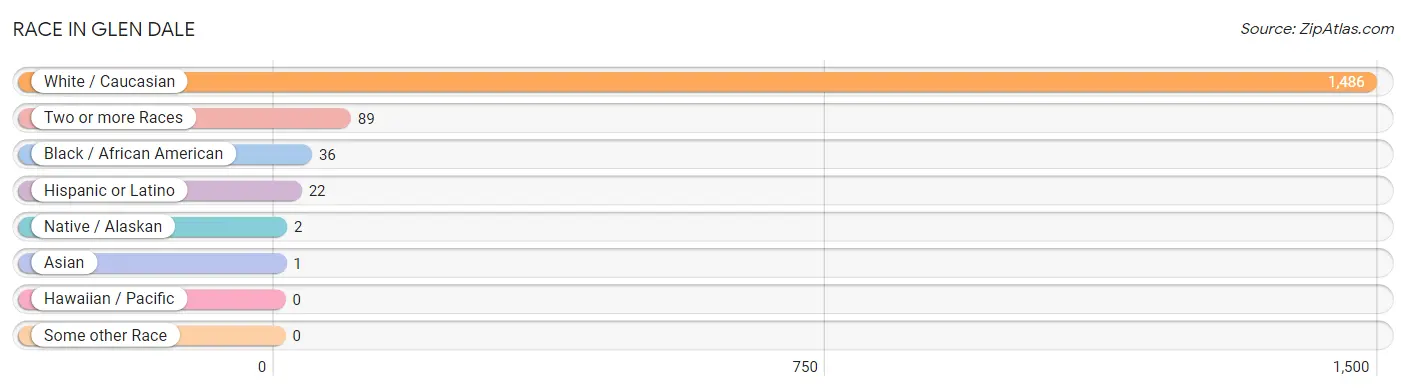
| Race | # Population | % Population |
| Asian | 1 | 0.1% |
| Black / African American | 36 | 2.2% |
| Hawaiian / Pacific | 0 | 0.0% |
| Hispanic or Latino | 22 | 1.4% |
| Native / Alaskan | 2 | 0.1% |
| White / Caucasian | 1,486 | 92.1% |
| Two or more Races | 89 | 5.5% |
| Some other Race | 0 | 0.0% |
| Total | 1,614 | 100.0% |
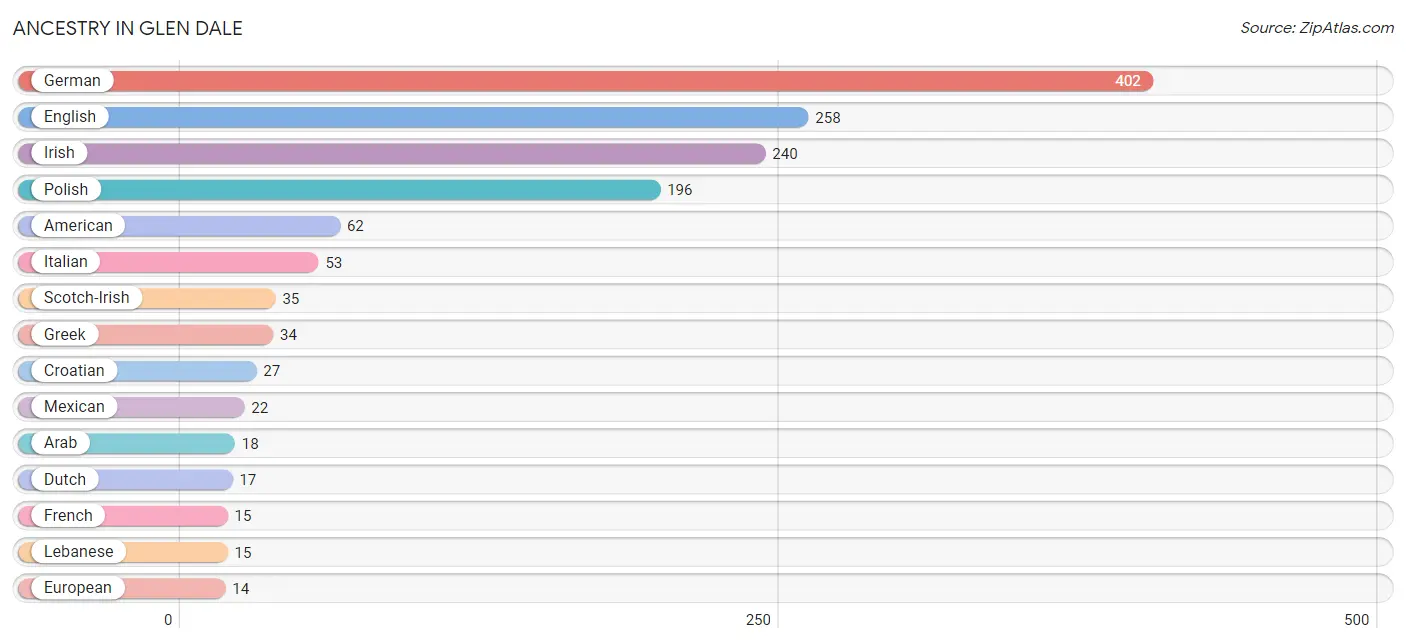
Ancestry in Glen Dale
The most populous ancestries reported in Glen Dale are German (402 | 24.9%), English (258 | 16.0%), Irish (240 | 14.9%), Polish (196 | 12.1%), and American (62 | 3.8%), together accounting for 71.7% of all Glen Dale residents.
| Ancestry | # Population | % Population |
| American | 62 | 3.8% |
| Arab | 18 | 1.1% |
| Austrian | 1 | 0.1% |
| Bhutanese | 2 | 0.1% |
| British | 13 | 0.8% |
| Cherokee | 6 | 0.4% |
| Croatian | 27 | 1.7% |
| Czech | 4 | 0.3% |
| Dutch | 17 | 1.1% |
| Eastern European | 6 | 0.4% |
| English | 258 | 16.0% |
| European | 14 | 0.9% |
| French | 15 | 0.9% |
| German | 402 | 24.9% |
| Greek | 34 | 2.1% |
| Hungarian | 7 | 0.4% |
| Irish | 240 | 14.9% |
| Italian | 53 | 3.3% |
| Lebanese | 15 | 0.9% |
| Lithuanian | 3 | 0.2% |
| Mexican | 22 | 1.4% |
| Northern European | 6 | 0.4% |
| Pennsylvania German | 2 | 0.1% |
| Polish | 196 | 12.1% |
| Romanian | 8 | 0.5% |
| Russian | 9 | 0.6% |
| Scotch-Irish | 35 | 2.2% |
| Scottish | 14 | 0.9% |
| Slovak | 5 | 0.3% |
| Swedish | 5 | 0.3% |
| Syrian | 3 | 0.2% |
| Ukrainian | 6 | 0.4% |
| Welsh | 5 | 0.3% | View All 33 Rows |
Immigrants in Glen Dale
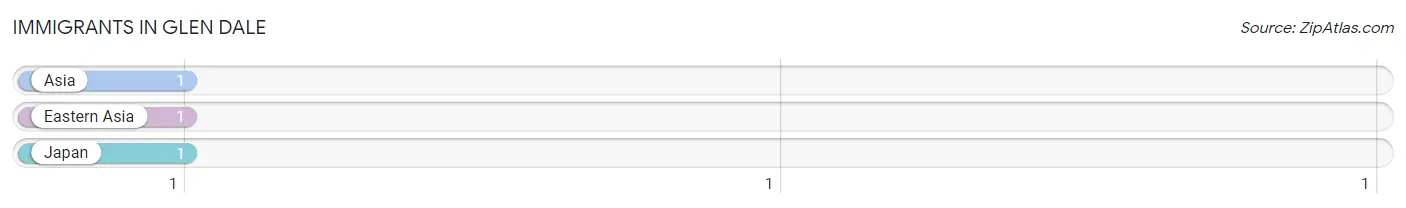
The most numerous immigrant groups reported in Glen Dale came from Asia (1 | 0.1%), Eastern Asia (1 | 0.1%), and Japan (1 | 0.1%), together accounting for 0.2% of all Glen Dale residents.
| Immigration Origin | # Population | % Population |
| Asia | 1 | 0.1% |
| Eastern Asia | 1 | 0.1% |
| Japan | 1 | 0.1% | View All 3 Rows |
Sex and Age in Glen Dale
Sex and Age in Glen Dale
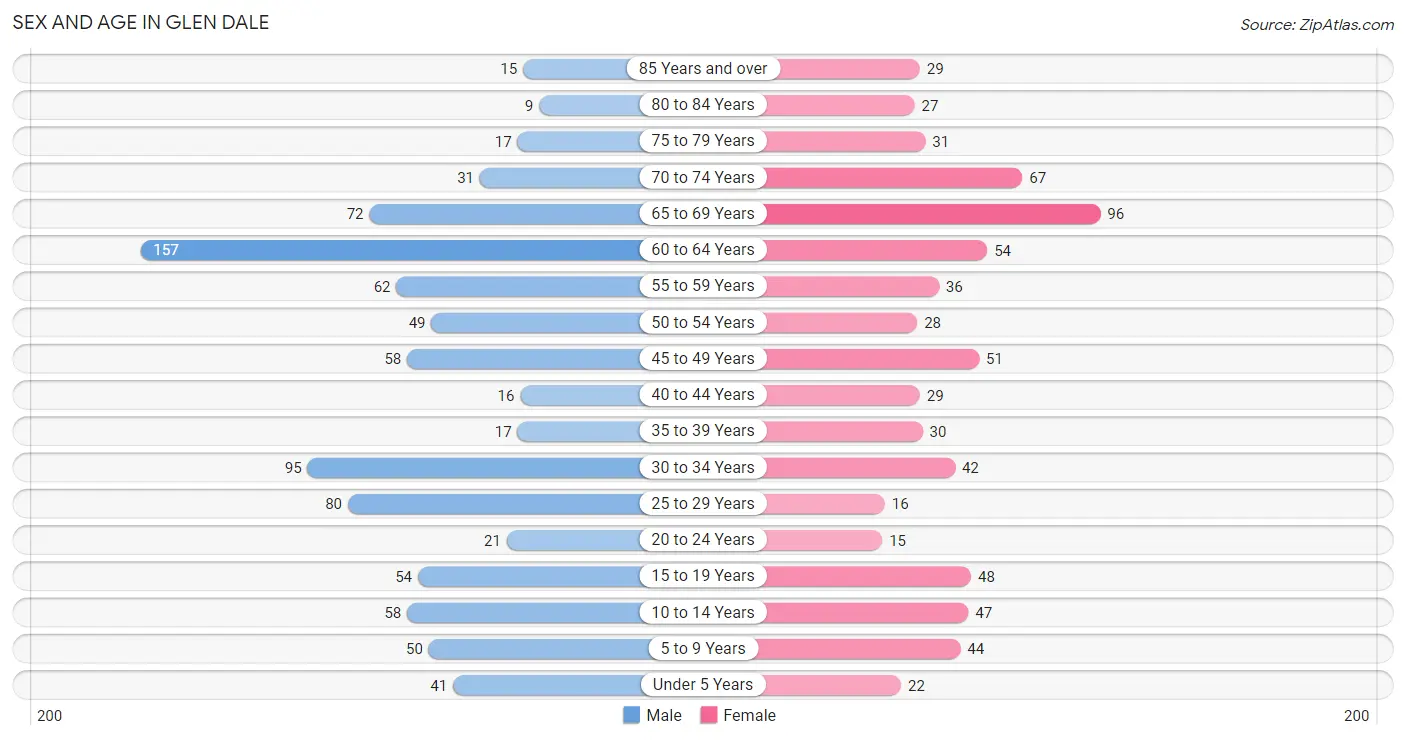
The most populous age groups in Glen Dale are 60 to 64 Years (157 | 17.4%) for men and 65 to 69 Years (96 | 13.5%) for women.
| Age Bracket | Male | Female |
| Under 5 Years | 41 (4.5%) | 22 (3.1%) |
| 5 to 9 Years | 50 (5.5%) | 44 (6.2%) |
| 10 to 14 Years | 58 (6.4%) | 47 (6.6%) |
| 15 to 19 Years | 54 (6.0%) | 48 (6.7%) |
| 20 to 24 Years | 21 (2.3%) | 15 (2.1%) |
| 25 to 29 Years | 80 (8.9%) | 16 (2.2%) |
| 30 to 34 Years | 95 (10.5%) | 42 (5.9%) |
| 35 to 39 Years | 17 (1.9%) | 30 (4.2%) |
| 40 to 44 Years | 16 (1.8%) | 29 (4.1%) |
| 45 to 49 Years | 58 (6.4%) | 51 (7.2%) |
| 50 to 54 Years | 49 (5.4%) | 28 (3.9%) |
| 55 to 59 Years | 62 (6.9%) | 36 (5.1%) |
| 60 to 64 Years | 157 (17.4%) | 54 (7.6%) |
| 65 to 69 Years | 72 (8.0%) | 96 (13.5%) |
| 70 to 74 Years | 31 (3.4%) | 67 (9.4%) |
| 75 to 79 Years | 17 (1.9%) | 31 (4.3%) |
| 80 to 84 Years | 9 (1.0%) | 27 (3.8%) |
| 85 Years and over | 15 (1.7%) | 29 (4.1%) |
| Total | 902 (100.0%) | 712 (100.0%) |
Families and Households in Glen Dale
Median Family Size in Glen Dale
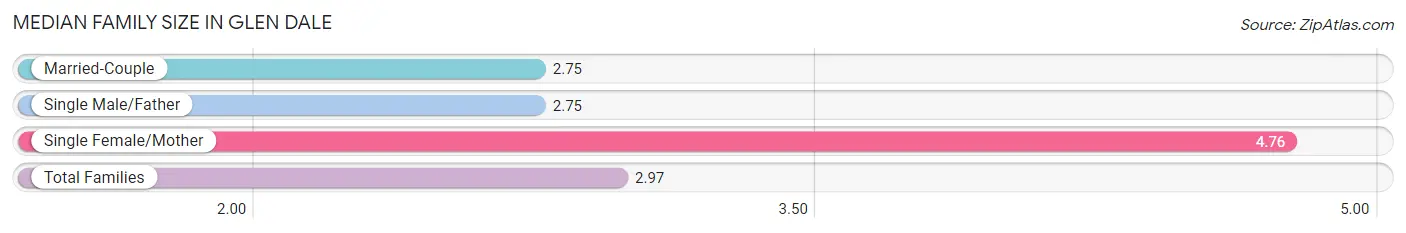
The median family size in Glen Dale is 2.97 persons per family, with single female/mother families (46 | 11.1%) accounting for the largest median family size of 4.76 persons per family. On the other hand, married-couple families (329 | 79.3%) represent the smallest median family size with 2.75 persons per family.
| Family Type | # Families | Family Size |
| Married-Couple | 329 (79.3%) | 2.75 |
| Single Male/Father | 40 (9.6%) | 2.75 |
| Single Female/Mother | 46 (11.1%) | 4.76 |
| Total Families | 415 (100.0%) | 2.97 |
Median Household Size in Glen Dale
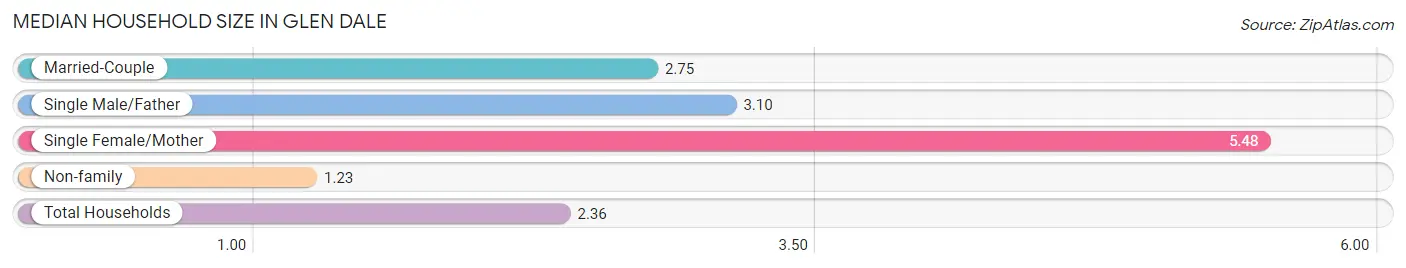
The median household size in Glen Dale is 2.36 persons per household, with single female/mother households (46 | 6.7%) accounting for the largest median household size of 5.48 persons per household. non-family households (270 | 39.4%) represent the smallest median household size with 1.23 persons per household.
| Household Type | # Households | Household Size |
| Married-Couple | 329 (48.0%) | 2.75 |
| Single Male/Father | 40 (5.8%) | 3.10 |
| Single Female/Mother | 46 (6.7%) | 5.48 |
| Non-family | 270 (39.4%) | 1.23 |
| Total Households | 685 (100.0%) | 2.36 |
Household Size by Marriage Status in Glen Dale
Out of a total of 685 households in Glen Dale, 415 (60.6%) are family households, while 270 (39.4%) are nonfamily households. The most numerous type of family households are 2-person households, comprising 209, and the most common type of nonfamily households are 1-person households, comprising 244.
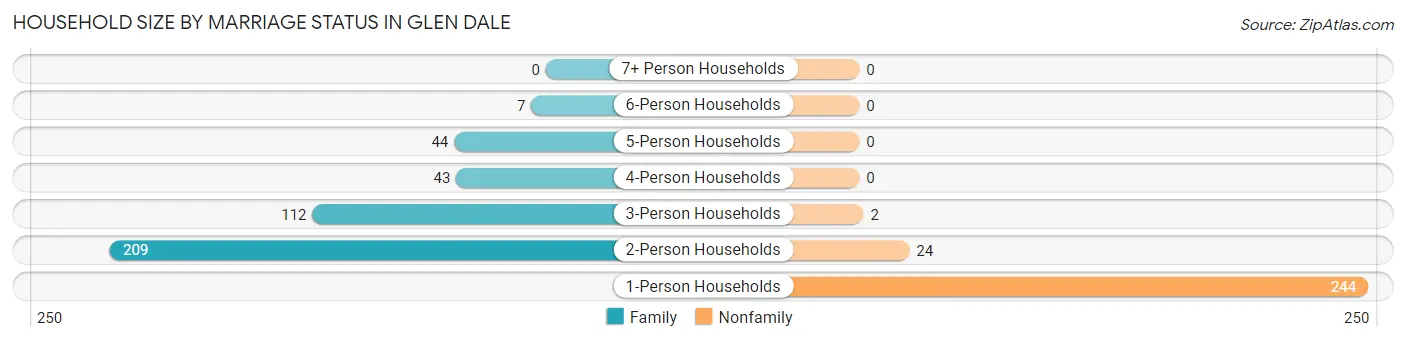
| Household Size | Family Households | Nonfamily Households |
| 1-Person Households | - | 244 (35.6%) |
| 2-Person Households | 209 (30.5%) | 24 (3.5%) |
| 3-Person Households | 112 (16.4%) | 2 (0.3%) |
| 4-Person Households | 43 (6.3%) | 0 (0.0%) |
| 5-Person Households | 44 (6.4%) | 0 (0.0%) |
| 6-Person Households | 7 (1.0%) | 0 (0.0%) |
| 7+ Person Households | 0 (0.0%) | 0 (0.0%) |
| Total | 415 (60.6%) | 270 (39.4%) |
Female Fertility in Glen Dale
Fertility by Age in Glen Dale
Average fertility rate in Glen Dale is 43.0 births per 1,000 women. Women in the age bracket of 20 to 34 years have the highest fertility rate with 82.0 births per 1,000 women. Women in the age bracket of 20 to 34 years acount for 60.0% of all women with births.
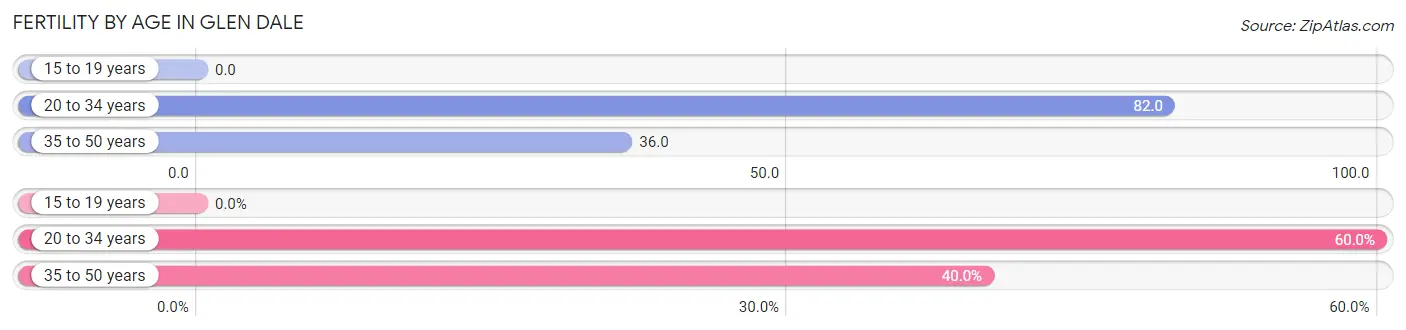
| Age Bracket | Women with Births | Births / 1,000 Women |
| 15 to 19 years | 0 (0.0%) | 0.0 |
| 20 to 34 years | 6 (60.0%) | 82.0 |
| 35 to 50 years | 4 (40.0%) | 36.0 |
| Total | 10 (100.0%) | 43.0 |
Fertility by Age by Marriage Status in Glen Dale
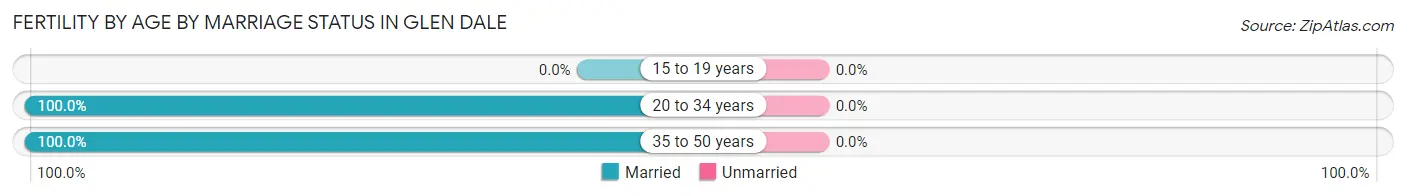
| Age Bracket | Married | Unmarried |
| 15 to 19 years | 0 (0.0%) | 0 (0.0%) |
| 20 to 34 years | 6 (100.0%) | 0 (0.0%) |
| 35 to 50 years | 4 (100.0%) | 0 (0.0%) |
| Total | 10 (100.0%) | 0 (0.0%) |
Fertility by Education in Glen Dale
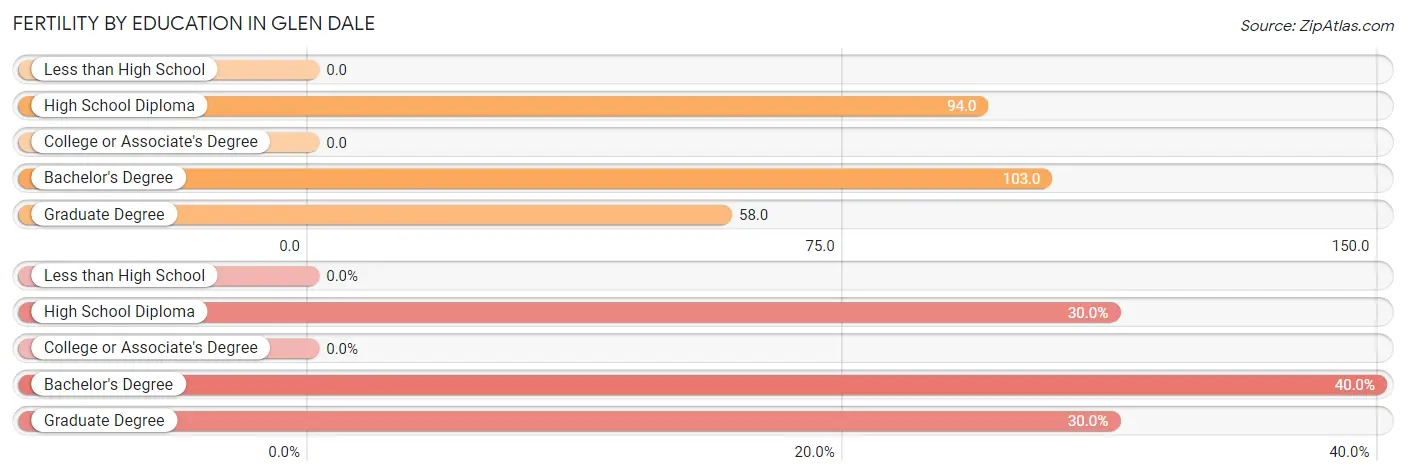
| Educational Attainment | Women with Births | Births / 1,000 Women |
| Less than High School | 0 (0.0%) | 0.0 |
| High School Diploma | 3 (30.0%) | 94.0 |
| College or Associate's Degree | 0 (0.0%) | 0.0 |
| Bachelor's Degree | 4 (40.0%) | 103.0 |
| Graduate Degree | 3 (30.0%) | 58.0 |
| Total | 10 (100.0%) | 43.0 |
Fertility by Education by Marriage Status in Glen Dale
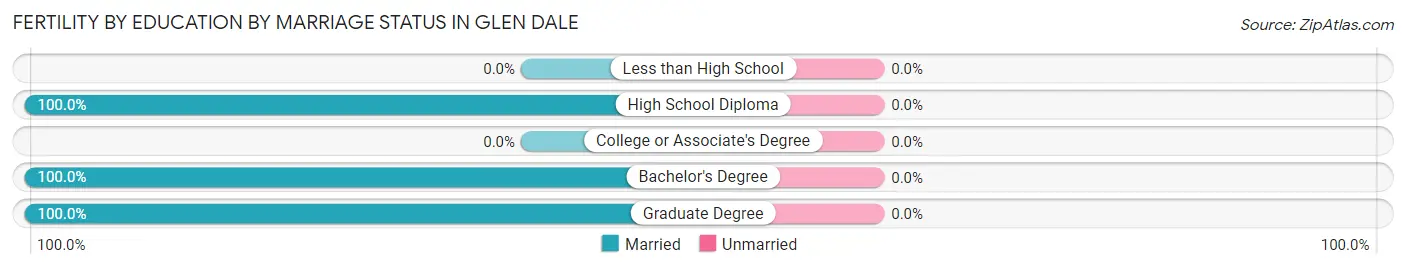
| Educational Attainment | Married | Unmarried |
| Less than High School | 0 (0.0%) | 0 (0.0%) |
| High School Diploma | 3 (100.0%) | 0 (0.0%) |
| College or Associate's Degree | 0 (0.0%) | 0 (0.0%) |
| Bachelor's Degree | 4 (100.0%) | 0 (0.0%) |
| Graduate Degree | 3 (100.0%) | 0 (0.0%) |
| Total | 10 (100.0%) | 0 (0.0%) |
Employment Characteristics in Glen Dale
Employment by Class of Employer in Glen Dale
Among the 644 employed individuals in Glen Dale, private company employees (438 | 68.0%), not-for-profit organizations (68 | 10.6%), and local government employees (61 | 9.5%) make up the most common classes of employment.
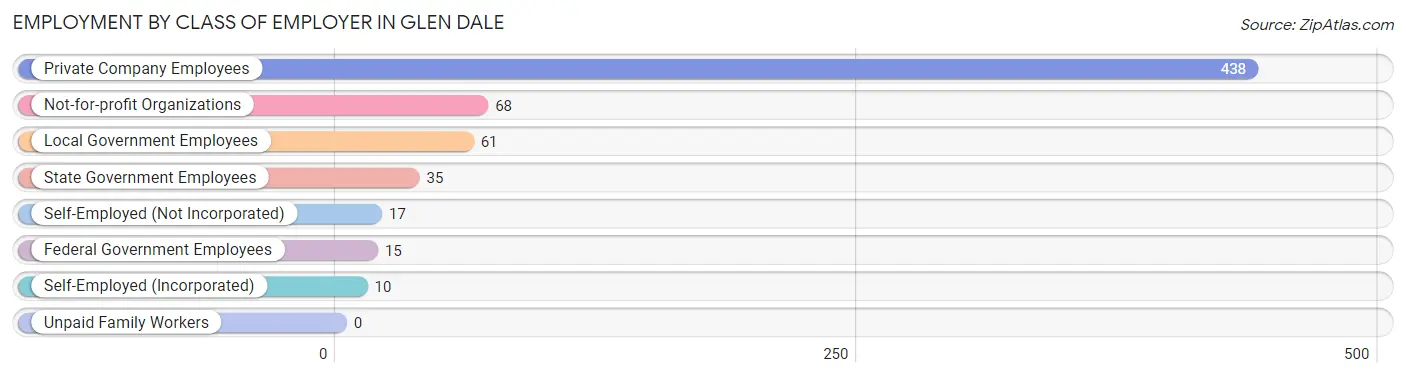
| Employer Class | # Employees | % Employees |
| Private Company Employees | 438 | 68.0% |
| Self-Employed (Incorporated) | 10 | 1.5% |
| Self-Employed (Not Incorporated) | 17 | 2.6% |
| Not-for-profit Organizations | 68 | 10.6% |
| Local Government Employees | 61 | 9.5% |
| State Government Employees | 35 | 5.4% |
| Federal Government Employees | 15 | 2.3% |
| Unpaid Family Workers | 0 | 0.0% |
| Total | 644 | 100.0% |
Employment Status by Age in Glen Dale
According to the labor force statistics for Glen Dale, out of the total population over 16 years of age (1,327), 56.4% or 748 individuals are in the labor force, with 6.1% or 46 of them unemployed. The age group with the highest labor force participation rate is 35 to 44 years, with 92.4% or 85 individuals in the labor force. Within the labor force, the 16 to 19 years age range has the highest percentage of unemployed individuals, with 55.6% or 25 of them being unemployed.
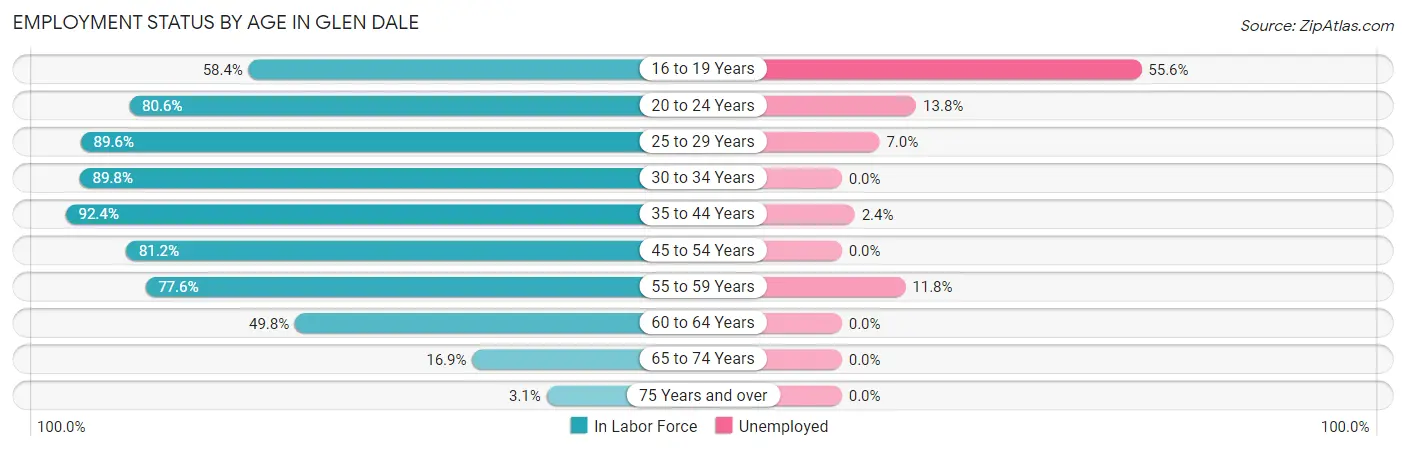
| Age Bracket | In Labor Force | Unemployed |
| 16 to 19 Years | 45 (58.4%) | 25 (55.6%) |
| 20 to 24 Years | 29 (80.6%) | 4 (13.8%) |
| 25 to 29 Years | 86 (89.6%) | 6 (7.0%) |
| 30 to 34 Years | 123 (89.8%) | 0 (0.0%) |
| 35 to 44 Years | 85 (92.4%) | 2 (2.4%) |
| 45 to 54 Years | 151 (81.2%) | 0 (0.0%) |
| 55 to 59 Years | 76 (77.6%) | 9 (11.8%) |
| 60 to 64 Years | 105 (49.8%) | 0 (0.0%) |
| 65 to 74 Years | 45 (16.9%) | 0 (0.0%) |
| 75 Years and over | 4 (3.1%) | 0 (0.0%) |
| Total | 748 (56.4%) | 46 (6.1%) |
Employment Status by Educational Attainment in Glen Dale
According to labor force statistics for Glen Dale, 76.3% of individuals (626) out of the total population between 25 and 64 years of age (820) are in the labor force, with 2.7% or 17 of them being unemployed. The group with the highest labor force participation rate are those with the educational attainment of bachelor's degree or higher, with 85.8% or 259 individuals in the labor force. Within the labor force, individuals with high school diploma education have the highest percentage of unemployment, with 5.2% or 11 of them being unemployed.
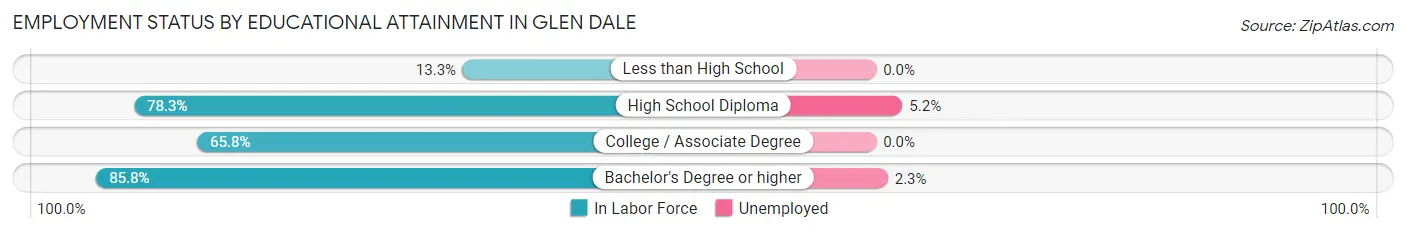
| Educational Attainment | In Labor Force | Unemployed |
| Less than High School | 2 (13.3%) | 0 (0.0%) |
| High School Diploma | 213 (78.3%) | 14 (5.2%) |
| College / Associate Degree | 152 (65.8%) | 0 (0.0%) |
| Bachelor's Degree or higher | 259 (85.8%) | 7 (2.3%) |
| Total | 626 (76.3%) | 22 (2.7%) |
Employment Occupations by Sex in Glen Dale
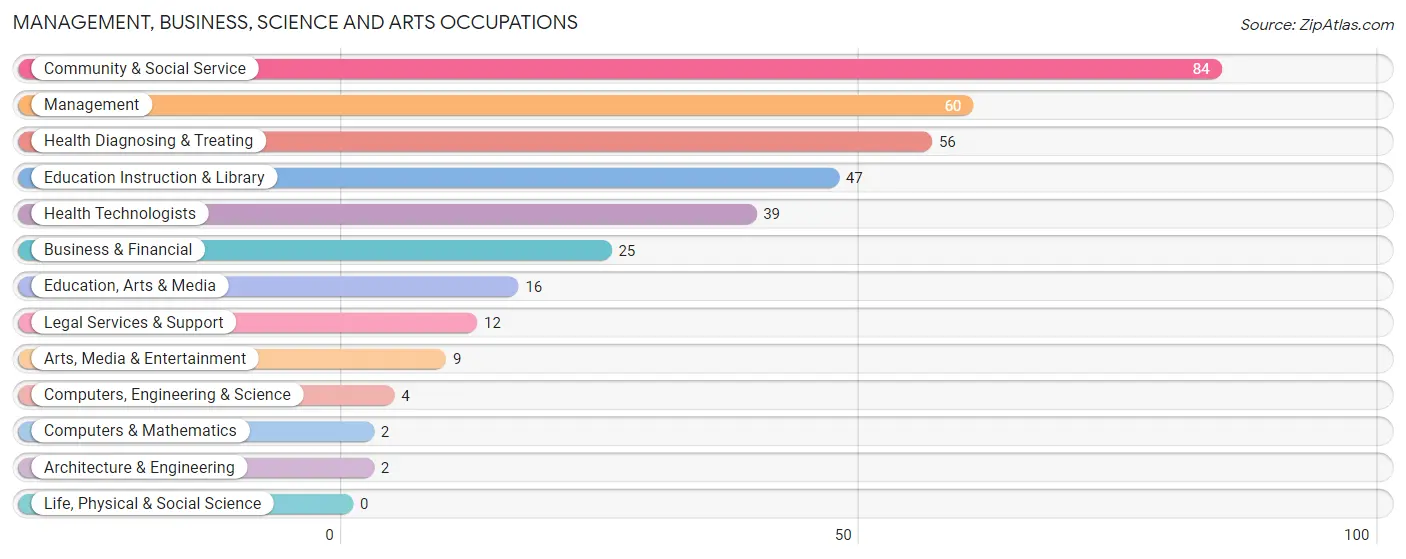
Management, Business, Science and Arts Occupations
The most common Management, Business, Science and Arts occupations in Glen Dale are Community & Social Service (84 | 11.9%), Management (60 | 8.5%), Health Diagnosing & Treating (56 | 8.0%), Education Instruction & Library (47 | 6.7%), and Health Technologists (39 | 5.6%).
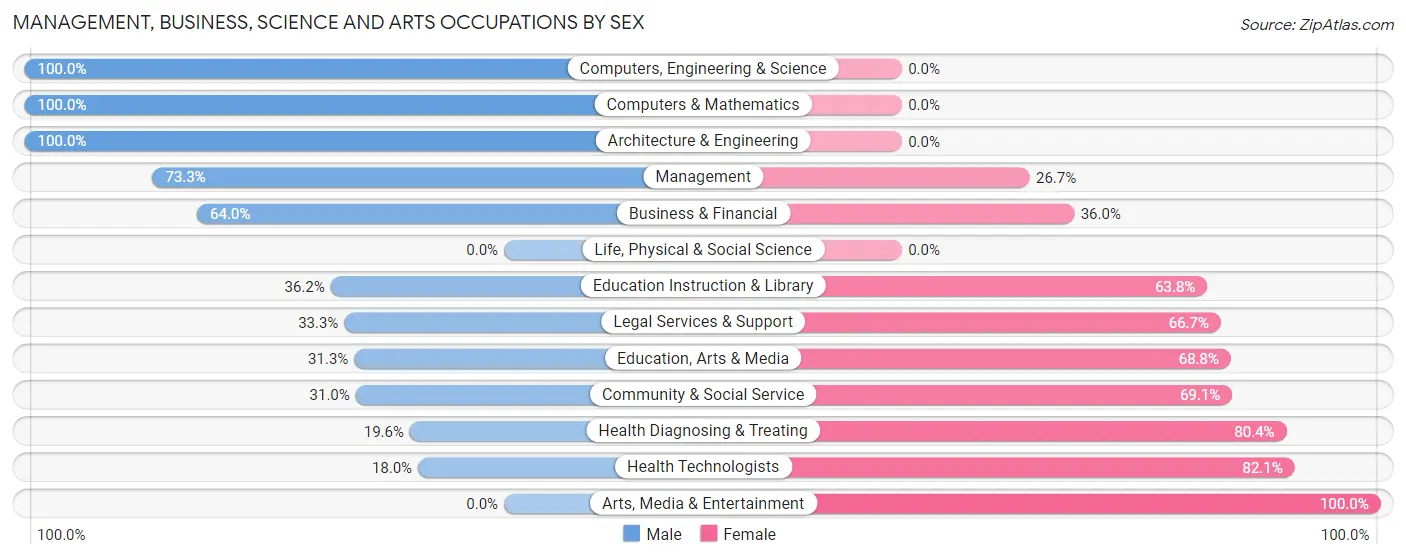
Management, Business, Science and Arts Occupations by Sex
Within the Management, Business, Science and Arts occupations in Glen Dale, the most male-oriented occupations are Computers, Engineering & Science (100.0%), Computers & Mathematics (100.0%), and Architecture & Engineering (100.0%), while the most female-oriented occupations are Arts, Media & Entertainment (100.0%), Health Technologists (82.1%), and Health Diagnosing & Treating (80.4%).
| Occupation | Male | Female |
| Management | 44 (73.3%) | 16 (26.7%) |
| Business & Financial | 16 (64.0%) | 9 (36.0%) |
| Computers, Engineering & Science | 4 (100.0%) | 0 (0.0%) |
| Computers & Mathematics | 2 (100.0%) | 0 (0.0%) |
| Architecture & Engineering | 2 (100.0%) | 0 (0.0%) |
| Life, Physical & Social Science | 0 (0.0%) | 0 (0.0%) |
| Community & Social Service | 26 (30.9%) | 58 (69.1%) |
| Education, Arts & Media | 5 (31.2%) | 11 (68.8%) |
| Legal Services & Support | 4 (33.3%) | 8 (66.7%) |
| Education Instruction & Library | 17 (36.2%) | 30 (63.8%) |
| Arts, Media & Entertainment | 0 (0.0%) | 9 (100.0%) |
| Health Diagnosing & Treating | 11 (19.6%) | 45 (80.4%) |
| Health Technologists | 7 (17.9%) | 32 (82.1%) |
| Total (Category) | 101 (44.1%) | 128 (55.9%) |
| Total (Overall) | 446 (63.4%) | 257 (36.6%) |
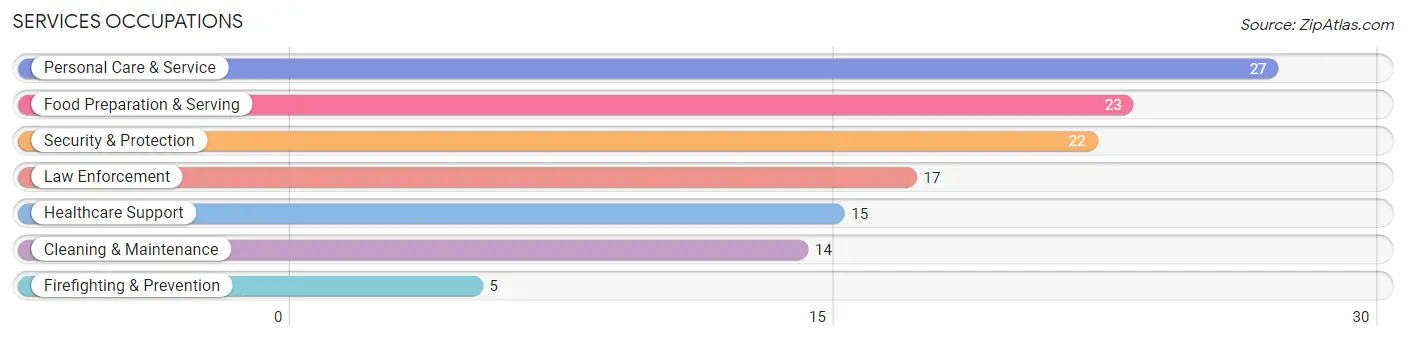
Services Occupations
The most common Services occupations in Glen Dale are Personal Care & Service (27 | 3.8%), Food Preparation & Serving (23 | 3.3%), Security & Protection (22 | 3.1%), Law Enforcement (17 | 2.4%), and Healthcare Support (15 | 2.1%).
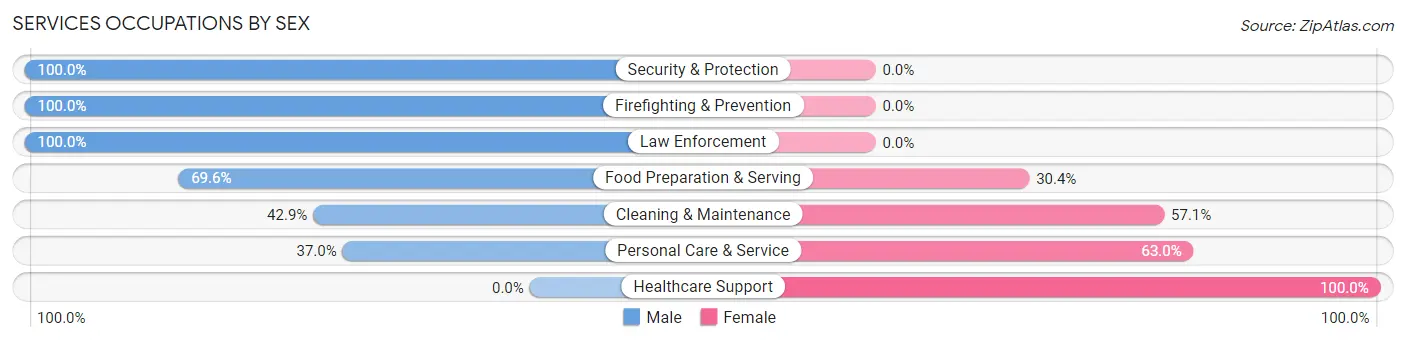
Services Occupations by Sex
Within the Services occupations in Glen Dale, the most male-oriented occupations are Security & Protection (100.0%), Firefighting & Prevention (100.0%), and Law Enforcement (100.0%), while the most female-oriented occupations are Healthcare Support (100.0%), Personal Care & Service (63.0%), and Cleaning & Maintenance (57.1%).
| Occupation | Male | Female |
| Healthcare Support | 0 (0.0%) | 15 (100.0%) |
| Security & Protection | 22 (100.0%) | 0 (0.0%) |
| Firefighting & Prevention | 5 (100.0%) | 0 (0.0%) |
| Law Enforcement | 17 (100.0%) | 0 (0.0%) |
| Food Preparation & Serving | 16 (69.6%) | 7 (30.4%) |
| Cleaning & Maintenance | 6 (42.9%) | 8 (57.1%) |
| Personal Care & Service | 10 (37.0%) | 17 (63.0%) |
| Total (Category) | 54 (53.5%) | 47 (46.5%) |
| Total (Overall) | 446 (63.4%) | 257 (36.6%) |
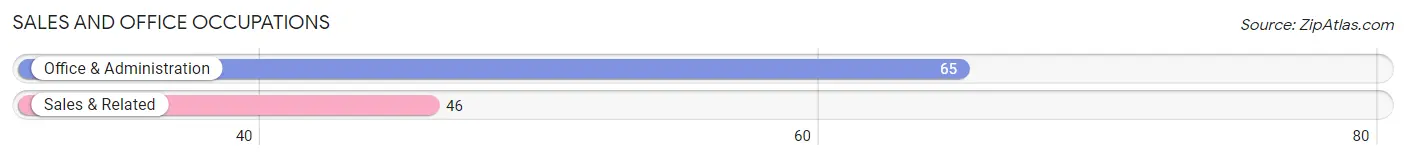
Sales and Office Occupations
The most common Sales and Office occupations in Glen Dale are Office & Administration (65 | 9.2%), and Sales & Related (46 | 6.5%).
Sales and Office Occupations by Sex
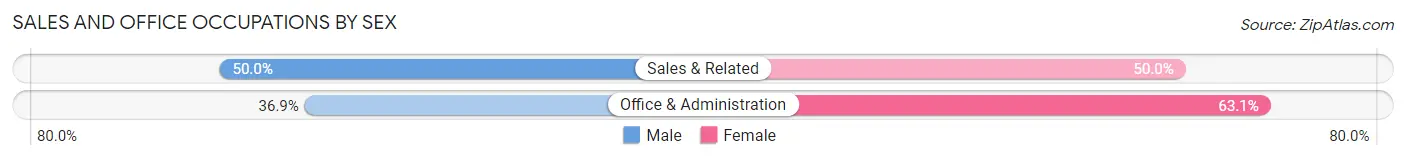
| Occupation | Male | Female |
| Sales & Related | 23 (50.0%) | 23 (50.0%) |
| Office & Administration | 24 (36.9%) | 41 (63.1%) |
| Total (Category) | 47 (42.3%) | 64 (57.7%) |
| Total (Overall) | 446 (63.4%) | 257 (36.6%) |
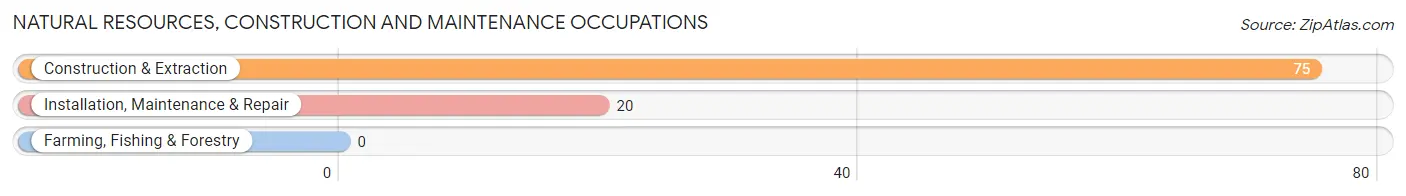
Natural Resources, Construction and Maintenance Occupations
The most common Natural Resources, Construction and Maintenance occupations in Glen Dale are Construction & Extraction (75 | 10.7%), and Installation, Maintenance & Repair (20 | 2.8%).
Natural Resources, Construction and Maintenance Occupations by Sex
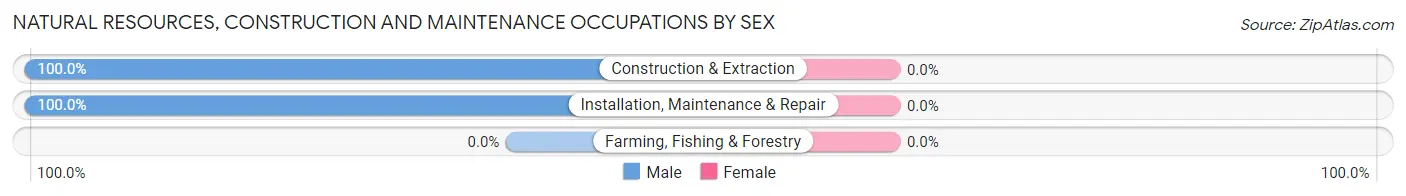
| Occupation | Male | Female |
| Farming, Fishing & Forestry | 0 (0.0%) | 0 (0.0%) |
| Construction & Extraction | 75 (100.0%) | 0 (0.0%) |
| Installation, Maintenance & Repair | 20 (100.0%) | 0 (0.0%) |
| Total (Category) | 95 (100.0%) | 0 (0.0%) |
| Total (Overall) | 446 (63.4%) | 257 (36.6%) |
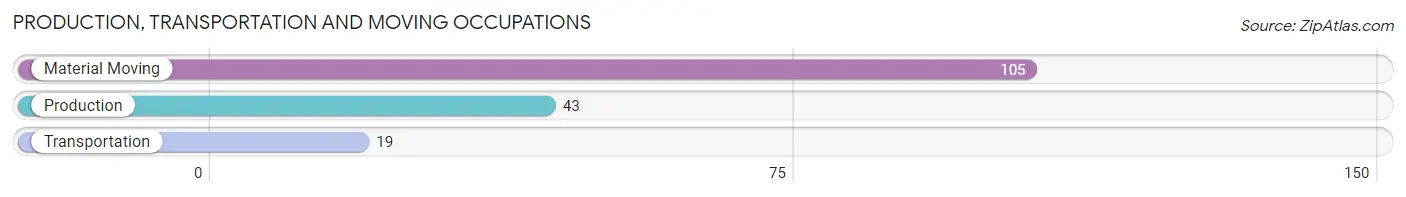
Production, Transportation and Moving Occupations
The most common Production, Transportation and Moving occupations in Glen Dale are Material Moving (105 | 14.9%), Production (43 | 6.1%), and Transportation (19 | 2.7%).
Production, Transportation and Moving Occupations by Sex
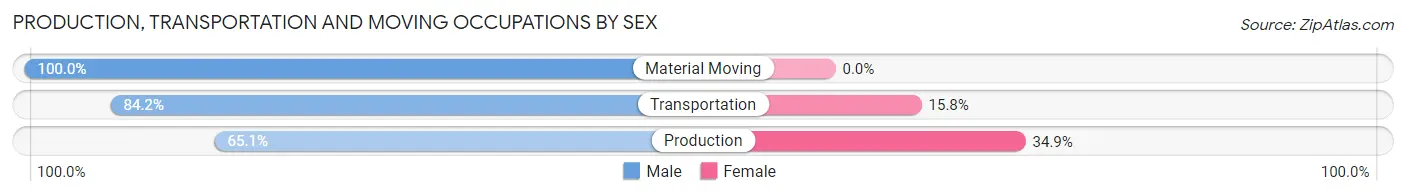
| Occupation | Male | Female |
| Production | 28 (65.1%) | 15 (34.9%) |
| Transportation | 16 (84.2%) | 3 (15.8%) |
| Material Moving | 105 (100.0%) | 0 (0.0%) |
| Total (Category) | 149 (89.2%) | 18 (10.8%) |
| Total (Overall) | 446 (63.4%) | 257 (36.6%) |
Employment Industries by Sex in Glen Dale
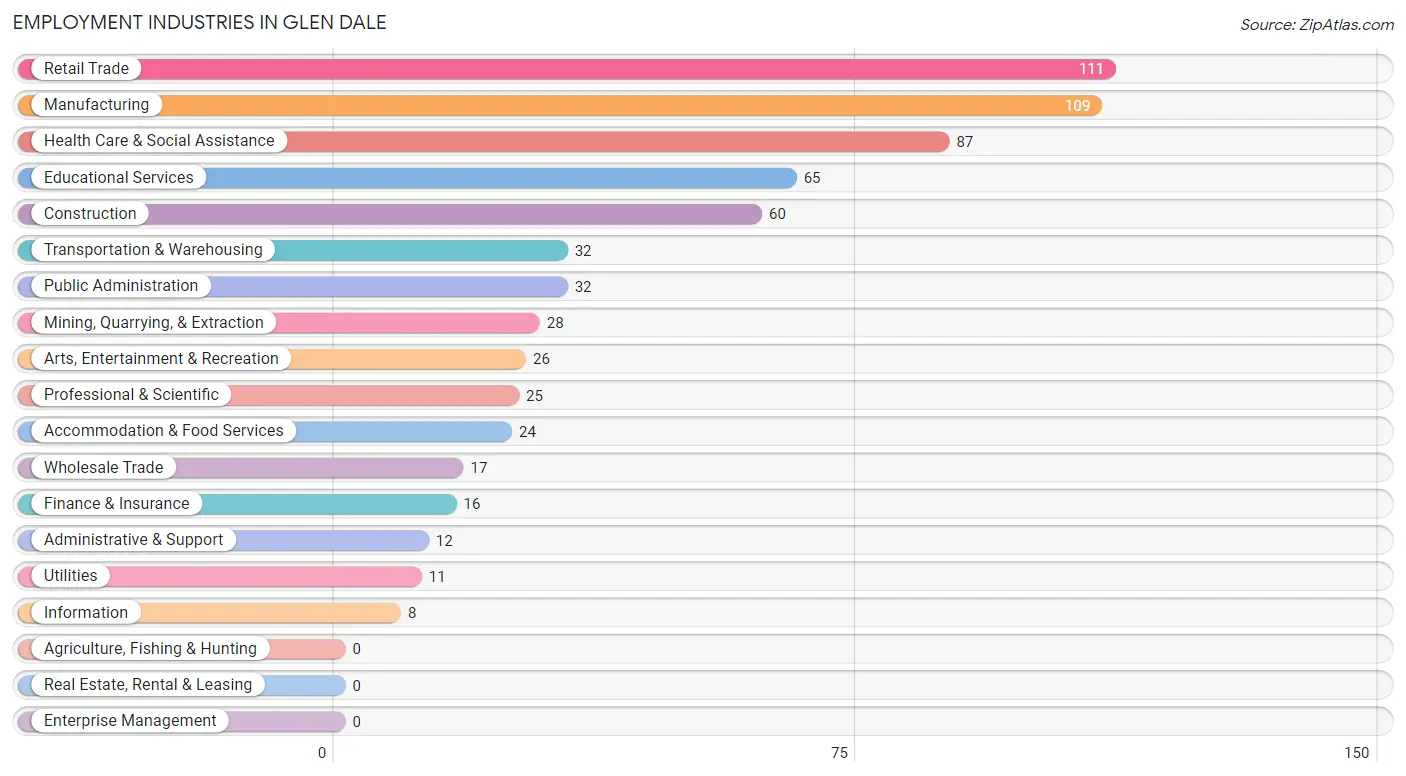
Employment Industries in Glen Dale
The major employment industries in Glen Dale include Retail Trade (111 | 15.8%), Manufacturing (109 | 15.5%), Health Care & Social Assistance (87 | 12.4%), Educational Services (65 | 9.2%), and Construction (60 | 8.5%).
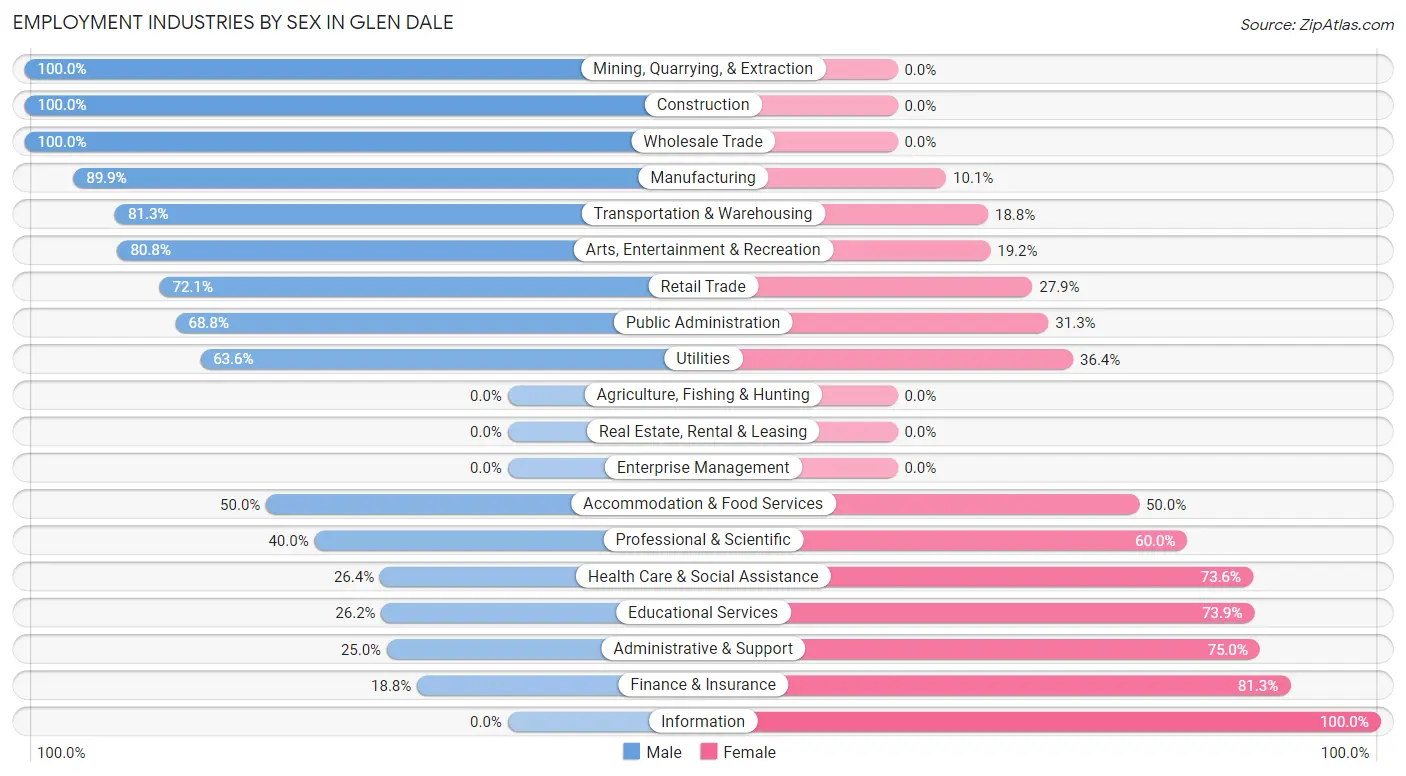
Employment Industries by Sex in Glen Dale
The Glen Dale industries that see more men than women are Mining, Quarrying, & Extraction (100.0%), Construction (100.0%), and Wholesale Trade (100.0%), whereas the industries that tend to have a higher number of women are Information (100.0%), Finance & Insurance (81.2%), and Administrative & Support (75.0%).
| Industry | Male | Female |
| Agriculture, Fishing & Hunting | 0 (0.0%) | 0 (0.0%) |
| Mining, Quarrying, & Extraction | 28 (100.0%) | 0 (0.0%) |
| Construction | 60 (100.0%) | 0 (0.0%) |
| Manufacturing | 98 (89.9%) | 11 (10.1%) |
| Wholesale Trade | 17 (100.0%) | 0 (0.0%) |
| Retail Trade | 80 (72.1%) | 31 (27.9%) |
| Transportation & Warehousing | 26 (81.2%) | 6 (18.8%) |
| Utilities | 7 (63.6%) | 4 (36.4%) |
| Information | 0 (0.0%) | 8 (100.0%) |
| Finance & Insurance | 3 (18.8%) | 13 (81.2%) |
| Real Estate, Rental & Leasing | 0 (0.0%) | 0 (0.0%) |
| Professional & Scientific | 10 (40.0%) | 15 (60.0%) |
| Enterprise Management | 0 (0.0%) | 0 (0.0%) |
| Administrative & Support | 3 (25.0%) | 9 (75.0%) |
| Educational Services | 17 (26.2%) | 48 (73.9%) |
| Health Care & Social Assistance | 23 (26.4%) | 64 (73.6%) |
| Arts, Entertainment & Recreation | 21 (80.8%) | 5 (19.2%) |
| Accommodation & Food Services | 12 (50.0%) | 12 (50.0%) |
| Public Administration | 22 (68.8%) | 10 (31.2%) |
| Total | 446 (63.4%) | 257 (36.6%) |
Education in Glen Dale
School Enrollment in Glen Dale
The most common levels of schooling among the 347 students in Glen Dale are elementary school (98 | 28.2%), middle school (77 | 22.2%), and high school (76 | 21.9%).
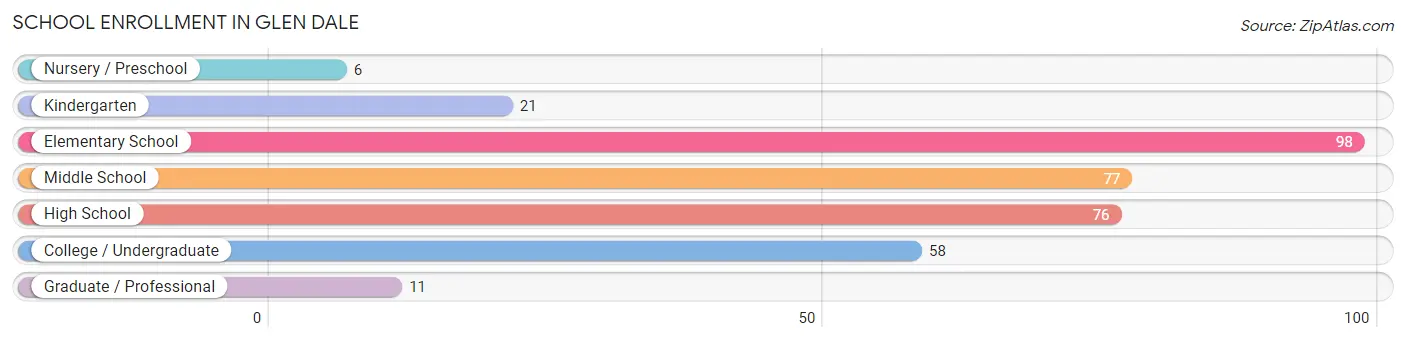
| School Level | # Students | % Students |
| Nursery / Preschool | 6 | 1.7% |
| Kindergarten | 21 | 6.0% |
| Elementary School | 98 | 28.2% |
| Middle School | 77 | 22.2% |
| High School | 76 | 21.9% |
| College / Undergraduate | 58 | 16.7% |
| Graduate / Professional | 11 | 3.2% |
| Total | 347 | 100.0% |
School Enrollment by Age by Funding Source in Glen Dale
Out of a total of 347 students who are enrolled in schools in Glen Dale, 67 (19.3%) attend a private institution, while the remaining 280 (80.7%) are enrolled in public schools. The age group of 15 to 17 year olds has the highest likelihood of being enrolled in private schools, with 15 (33.3% in the age bracket) enrolled. Conversely, the age group of 3 to 4 year olds has the lowest likelihood of being enrolled in a private school, with 3 (100.0% in the age bracket) attending a public institution.
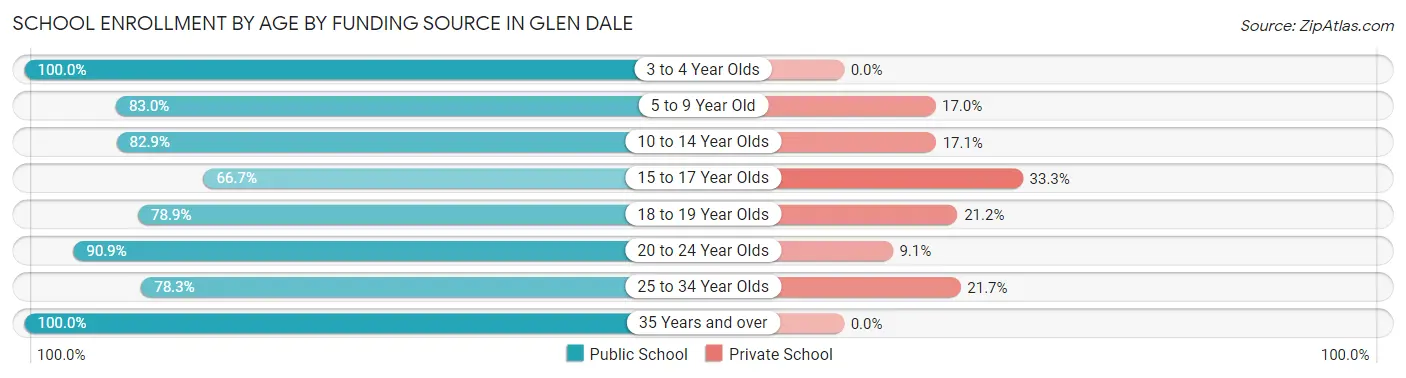
| Age Bracket | Public School | Private School |
| 3 to 4 Year Olds | 3 (100.0%) | 0 (0.0%) |
| 5 to 9 Year Old | 78 (83.0%) | 16 (17.0%) |
| 10 to 14 Year Olds | 87 (82.9%) | 18 (17.1%) |
| 15 to 17 Year Olds | 30 (66.7%) | 15 (33.3%) |
| 18 to 19 Year Olds | 41 (78.8%) | 11 (21.1%) |
| 20 to 24 Year Olds | 20 (90.9%) | 2 (9.1%) |
| 25 to 34 Year Olds | 18 (78.3%) | 5 (21.7%) |
| 35 Years and over | 3 (100.0%) | 0 (0.0%) |
| Total | 280 (80.7%) | 67 (19.3%) |
Educational Attainment by Field of Study in Glen Dale
Education (98 | 21.4%), business (93 | 20.3%), arts & humanities (78 | 17.0%), science & technology (64 | 14.0%), and psychology (30 | 6.6%) are the most common fields of study among 458 individuals in Glen Dale who have obtained a bachelor's degree or higher.
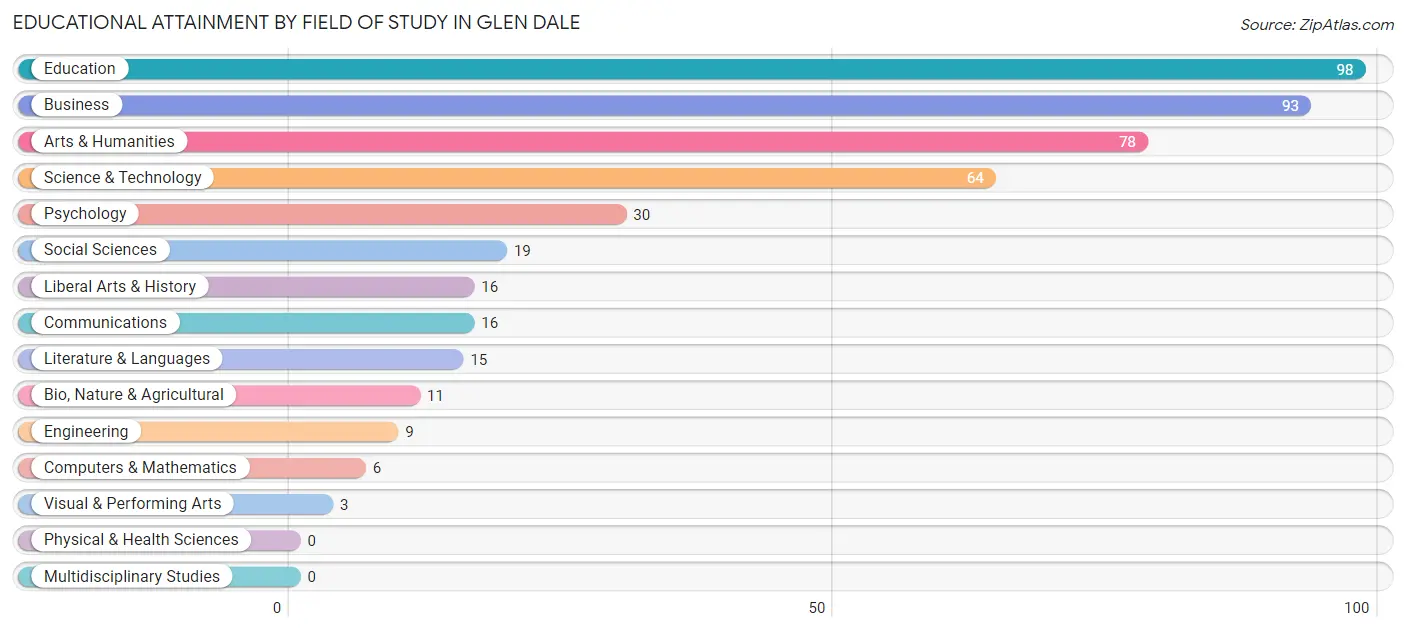
| Field of Study | # Graduates | % Graduates |
| Computers & Mathematics | 6 | 1.3% |
| Bio, Nature & Agricultural | 11 | 2.4% |
| Physical & Health Sciences | 0 | 0.0% |
| Psychology | 30 | 6.6% |
| Social Sciences | 19 | 4.2% |
| Engineering | 9 | 2.0% |
| Multidisciplinary Studies | 0 | 0.0% |
| Science & Technology | 64 | 14.0% |
| Business | 93 | 20.3% |
| Education | 98 | 21.4% |
| Literature & Languages | 15 | 3.3% |
| Liberal Arts & History | 16 | 3.5% |
| Visual & Performing Arts | 3 | 0.7% |
| Communications | 16 | 3.5% |
| Arts & Humanities | 78 | 17.0% |
| Total | 458 | 100.0% |
Transportation & Commute in Glen Dale
Vehicle Availability by Sex in Glen Dale
The most prevalent vehicle ownership categories in Glen Dale are males with 2 vehicles (189, accounting for 48.7%) and females with 2 vehicles (90, making up 73.8%).
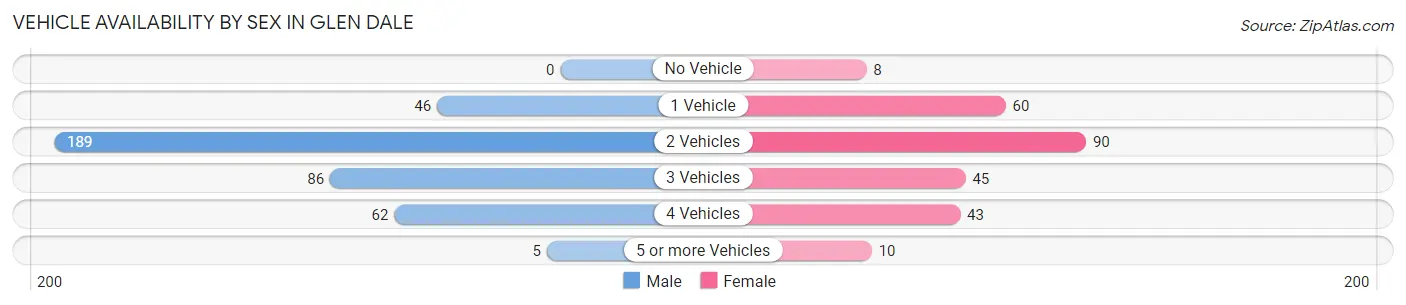
| Vehicles Available | Male | Female |
| No Vehicle | 0 (0.0%) | 8 (3.1%) |
| 1 Vehicle | 46 (11.9%) | 60 (23.4%) |
| 2 Vehicles | 189 (48.7%) | 90 (35.2%) |
| 3 Vehicles | 86 (22.2%) | 45 (17.6%) |
| 4 Vehicles | 62 (16.0%) | 43 (16.8%) |
| 5 or more Vehicles | 5 (1.3%) | 10 (3.9%) |
| Total | 388 (100.0%) | 256 (100.0%) |
Commute Time in Glen Dale
The most frequently occuring commute durations in Glen Dale are 10 to 14 minutes (107 commuters, 17.1%), 30 to 34 minutes (101 commuters, 16.1%), and 15 to 19 minutes (97 commuters, 15.5%).
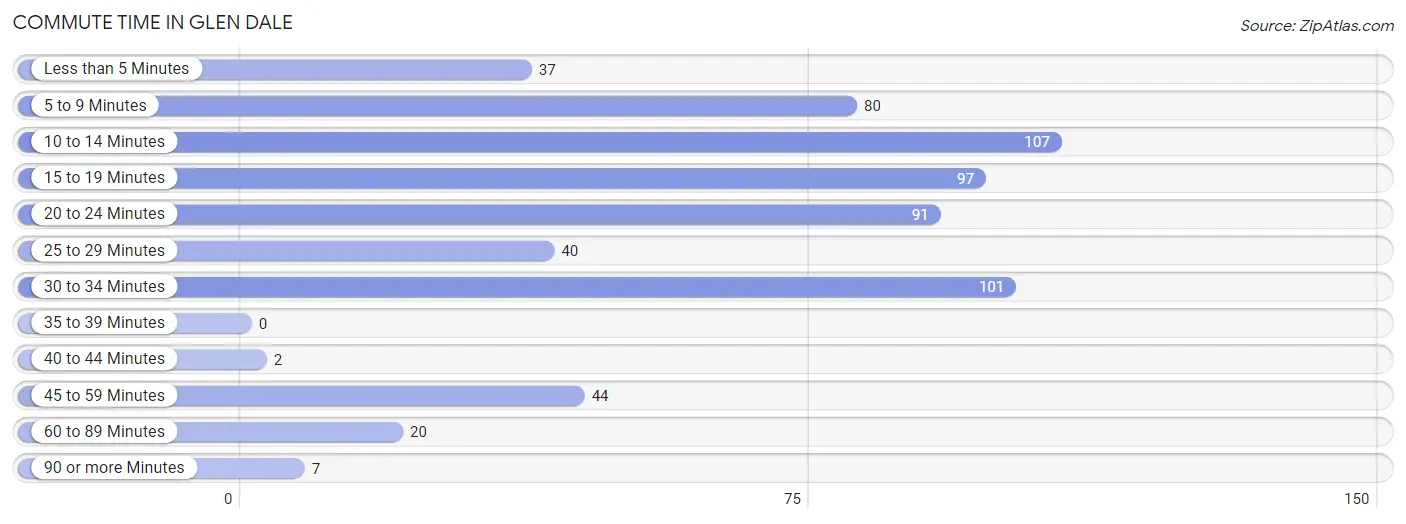
| Commute Time | # Commuters | % Commuters |
| Less than 5 Minutes | 37 | 5.9% |
| 5 to 9 Minutes | 80 | 12.8% |
| 10 to 14 Minutes | 107 | 17.1% |
| 15 to 19 Minutes | 97 | 15.5% |
| 20 to 24 Minutes | 91 | 14.5% |
| 25 to 29 Minutes | 40 | 6.4% |
| 30 to 34 Minutes | 101 | 16.1% |
| 35 to 39 Minutes | 0 | 0.0% |
| 40 to 44 Minutes | 2 | 0.3% |
| 45 to 59 Minutes | 44 | 7.0% |
| 60 to 89 Minutes | 20 | 3.2% |
| 90 or more Minutes | 7 | 1.1% |
Commute Time by Sex in Glen Dale
The most common commute times in Glen Dale are 30 to 34 minutes (76 commuters, 20.4%) for males and 10 to 14 minutes (65 commuters, 25.7%) for females.
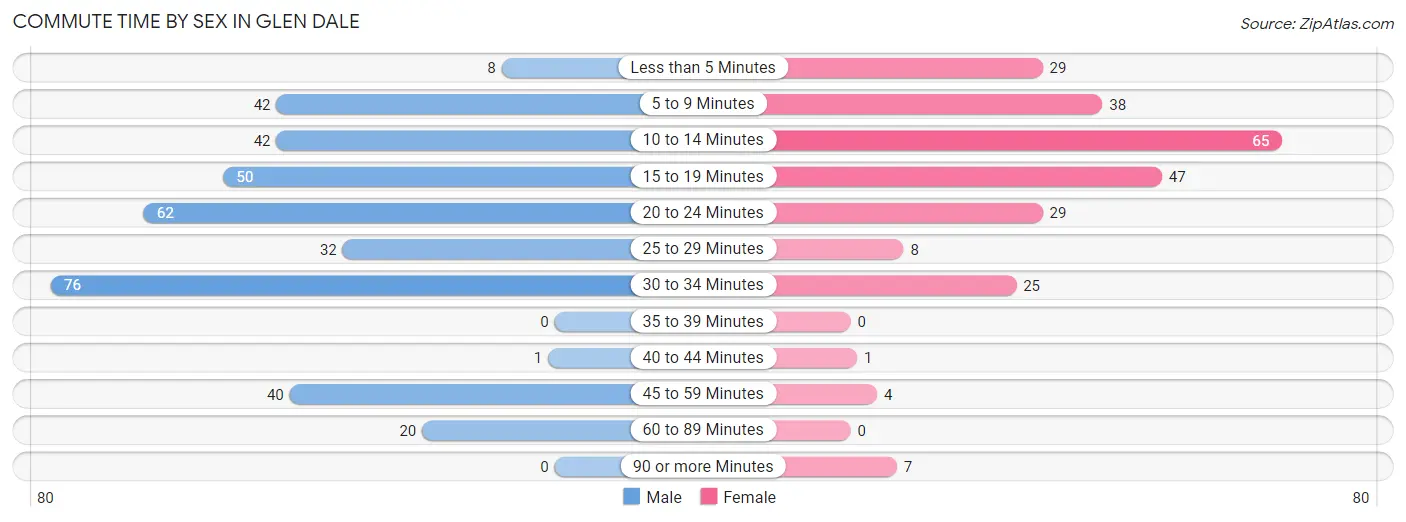
| Commute Time | Male | Female |
| Less than 5 Minutes | 8 (2.1%) | 29 (11.5%) |
| 5 to 9 Minutes | 42 (11.3%) | 38 (15.0%) |
| 10 to 14 Minutes | 42 (11.3%) | 65 (25.7%) |
| 15 to 19 Minutes | 50 (13.4%) | 47 (18.6%) |
| 20 to 24 Minutes | 62 (16.6%) | 29 (11.5%) |
| 25 to 29 Minutes | 32 (8.6%) | 8 (3.2%) |
| 30 to 34 Minutes | 76 (20.4%) | 25 (9.9%) |
| 35 to 39 Minutes | 0 (0.0%) | 0 (0.0%) |
| 40 to 44 Minutes | 1 (0.3%) | 1 (0.4%) |
| 45 to 59 Minutes | 40 (10.7%) | 4 (1.6%) |
| 60 to 89 Minutes | 20 (5.4%) | 0 (0.0%) |
| 90 or more Minutes | 0 (0.0%) | 7 (2.8%) |
Time of Departure to Work by Sex in Glen Dale
The most frequent times of departure to work in Glen Dale are 6:30 AM to 6:59 AM (76, 20.4%) for males and 7:00 AM to 7:29 AM (66, 26.1%) for females.
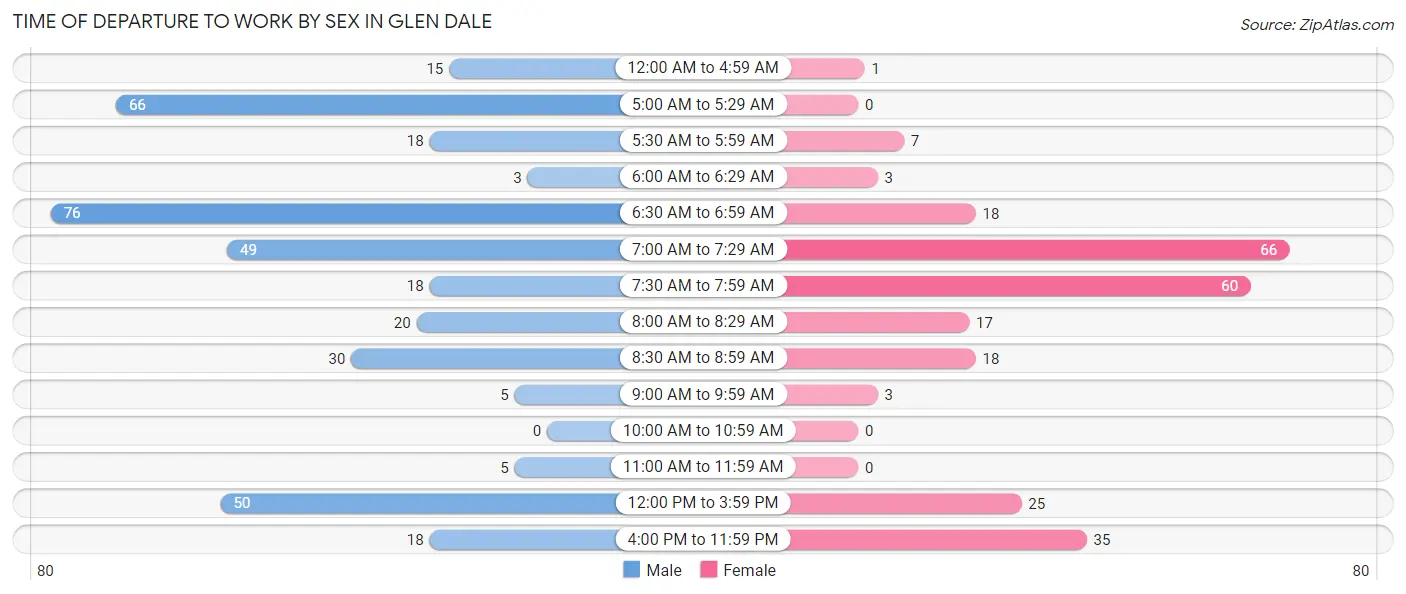
| Time of Departure | Male | Female |
| 12:00 AM to 4:59 AM | 15 (4.0%) | 1 (0.4%) |
| 5:00 AM to 5:29 AM | 66 (17.7%) | 0 (0.0%) |
| 5:30 AM to 5:59 AM | 18 (4.8%) | 7 (2.8%) |
| 6:00 AM to 6:29 AM | 3 (0.8%) | 3 (1.2%) |
| 6:30 AM to 6:59 AM | 76 (20.4%) | 18 (7.1%) |
| 7:00 AM to 7:29 AM | 49 (13.1%) | 66 (26.1%) |
| 7:30 AM to 7:59 AM | 18 (4.8%) | 60 (23.7%) |
| 8:00 AM to 8:29 AM | 20 (5.4%) | 17 (6.7%) |
| 8:30 AM to 8:59 AM | 30 (8.0%) | 18 (7.1%) |
| 9:00 AM to 9:59 AM | 5 (1.3%) | 3 (1.2%) |
| 10:00 AM to 10:59 AM | 0 (0.0%) | 0 (0.0%) |
| 11:00 AM to 11:59 AM | 5 (1.3%) | 0 (0.0%) |
| 12:00 PM to 3:59 PM | 50 (13.4%) | 25 (9.9%) |
| 4:00 PM to 11:59 PM | 18 (4.8%) | 35 (13.8%) |
| Total | 373 (100.0%) | 253 (100.0%) |
Housing Occupancy in Glen Dale
Occupancy by Ownership in Glen Dale
Of the total 685 dwellings in Glen Dale, owner-occupied units account for 574 (83.8%), while renter-occupied units make up 111 (16.2%).
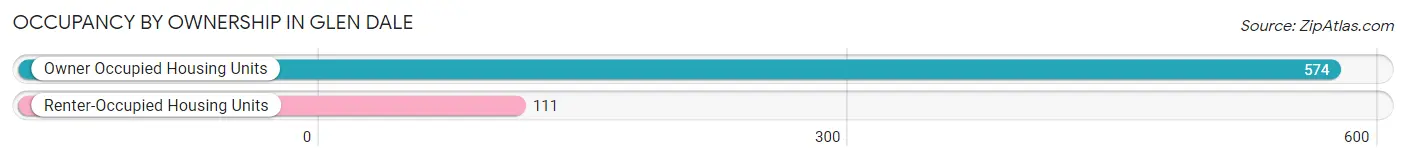
| Occupancy | # Housing Units | % Housing Units |
| Owner Occupied Housing Units | 574 | 83.8% |
| Renter-Occupied Housing Units | 111 | 16.2% |
| Total Occupied Housing Units | 685 | 100.0% |
Occupancy by Household Size in Glen Dale
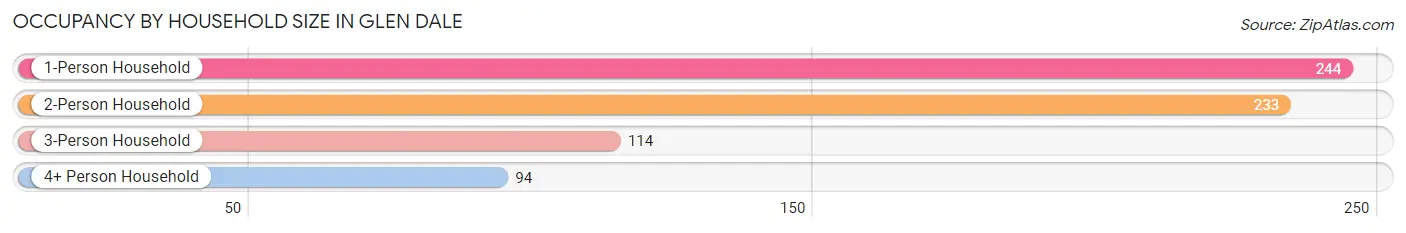
| Household Size | # Housing Units | % Housing Units |
| 1-Person Household | 244 | 35.6% |
| 2-Person Household | 233 | 34.0% |
| 3-Person Household | 114 | 16.6% |
| 4+ Person Household | 94 | 13.7% |
| Total Housing Units | 685 | 100.0% |
Occupancy by Ownership by Household Size in Glen Dale
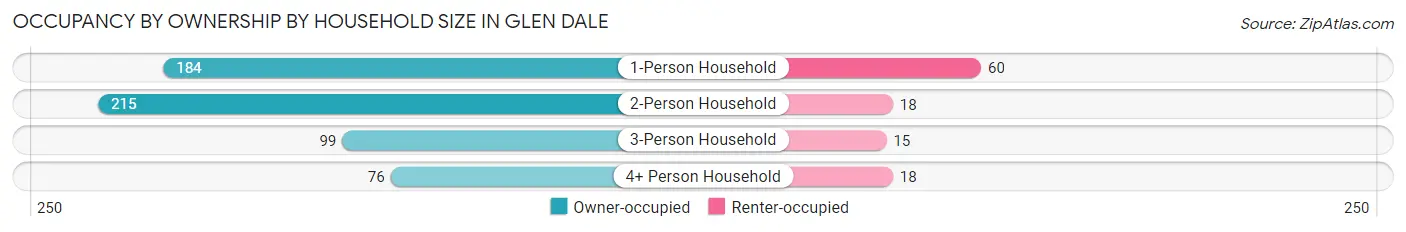
| Household Size | Owner-occupied | Renter-occupied |
| 1-Person Household | 184 (75.4%) | 60 (24.6%) |
| 2-Person Household | 215 (92.3%) | 18 (7.7%) |
| 3-Person Household | 99 (86.8%) | 15 (13.2%) |
| 4+ Person Household | 76 (80.8%) | 18 (19.2%) |
| Total Housing Units | 574 (83.8%) | 111 (16.2%) |
Occupancy by Educational Attainment in Glen Dale
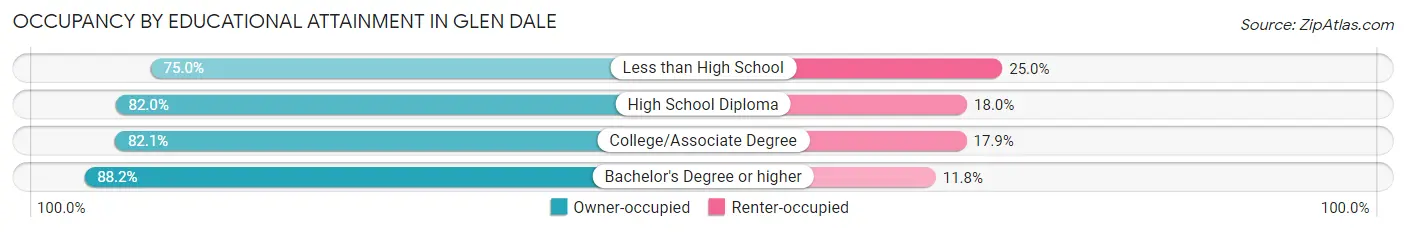
| Household Size | Owner-occupied | Renter-occupied |
| Less than High School | 15 (75.0%) | 5 (25.0%) |
| High School Diploma | 191 (82.0%) | 42 (18.0%) |
| College/Associate Degree | 174 (82.1%) | 38 (17.9%) |
| Bachelor's Degree or higher | 194 (88.2%) | 26 (11.8%) |
Occupancy by Age of Householder in Glen Dale
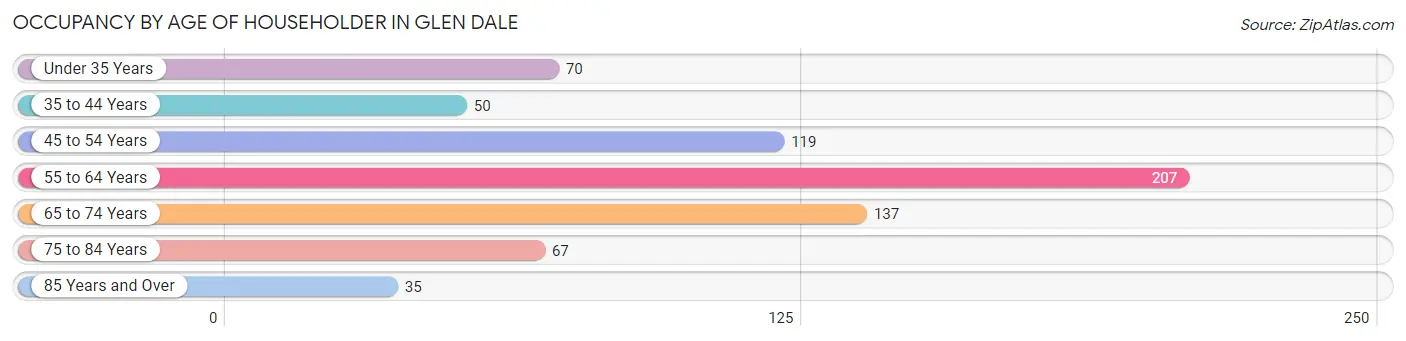
| Age Bracket | # Households | % Households |
| Under 35 Years | 70 | 10.2% |
| 35 to 44 Years | 50 | 7.3% |
| 45 to 54 Years | 119 | 17.4% |
| 55 to 64 Years | 207 | 30.2% |
| 65 to 74 Years | 137 | 20.0% |
| 75 to 84 Years | 67 | 9.8% |
| 85 Years and Over | 35 | 5.1% |
| Total | 685 | 100.0% |
Housing Finances in Glen Dale
Median Income by Occupancy in Glen Dale
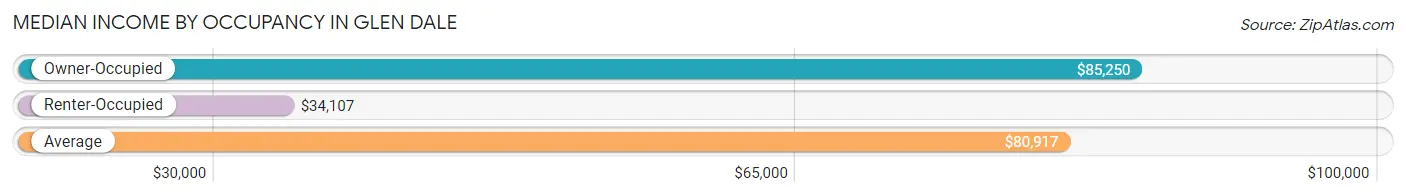
| Occupancy Type | # Households | Median Income |
| Owner-Occupied | 574 (83.8%) | $85,250 |
| Renter-Occupied | 111 (16.2%) | $34,107 |
| Average | 685 (100.0%) | $80,917 |
Occupancy by Householder Income Bracket in Glen Dale
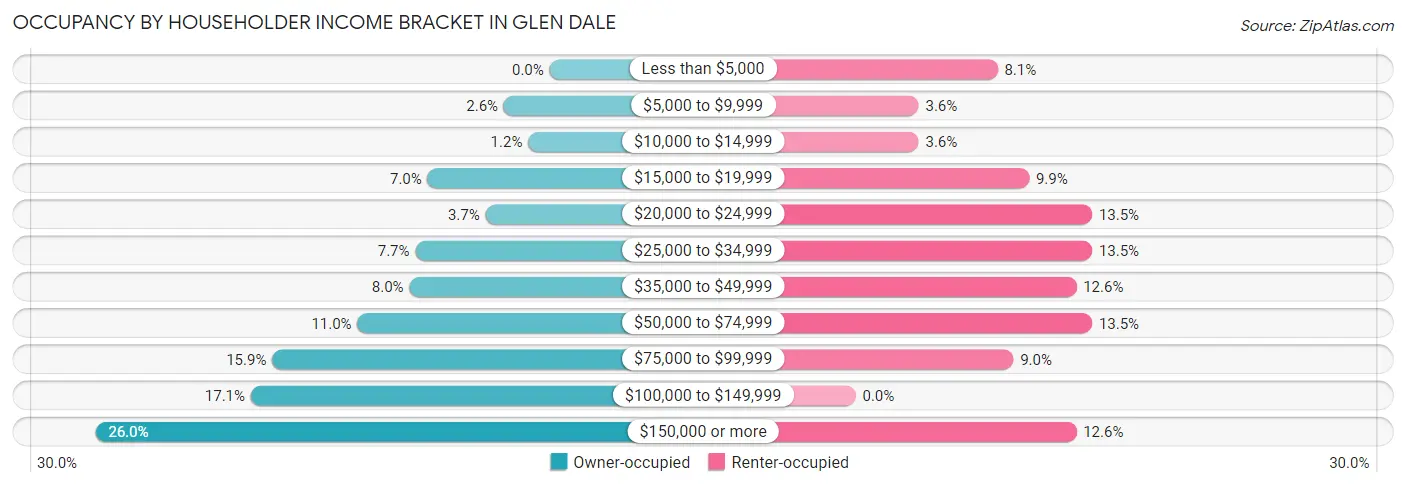
| Income Bracket | Owner-occupied | Renter-occupied |
| Less than $5,000 | 0 (0.0%) | 9 (8.1%) |
| $5,000 to $9,999 | 15 (2.6%) | 4 (3.6%) |
| $10,000 to $14,999 | 7 (1.2%) | 4 (3.6%) |
| $15,000 to $19,999 | 40 (7.0%) | 11 (9.9%) |
| $20,000 to $24,999 | 21 (3.7%) | 15 (13.5%) |
| $25,000 to $34,999 | 44 (7.7%) | 15 (13.5%) |
| $35,000 to $49,999 | 46 (8.0%) | 14 (12.6%) |
| $50,000 to $74,999 | 63 (11.0%) | 15 (13.5%) |
| $75,000 to $99,999 | 91 (15.9%) | 10 (9.0%) |
| $100,000 to $149,999 | 98 (17.1%) | 0 (0.0%) |
| $150,000 or more | 149 (26.0%) | 14 (12.6%) |
| Total | 574 (100.0%) | 111 (100.0%) |
Monthly Housing Cost Tiers in Glen Dale
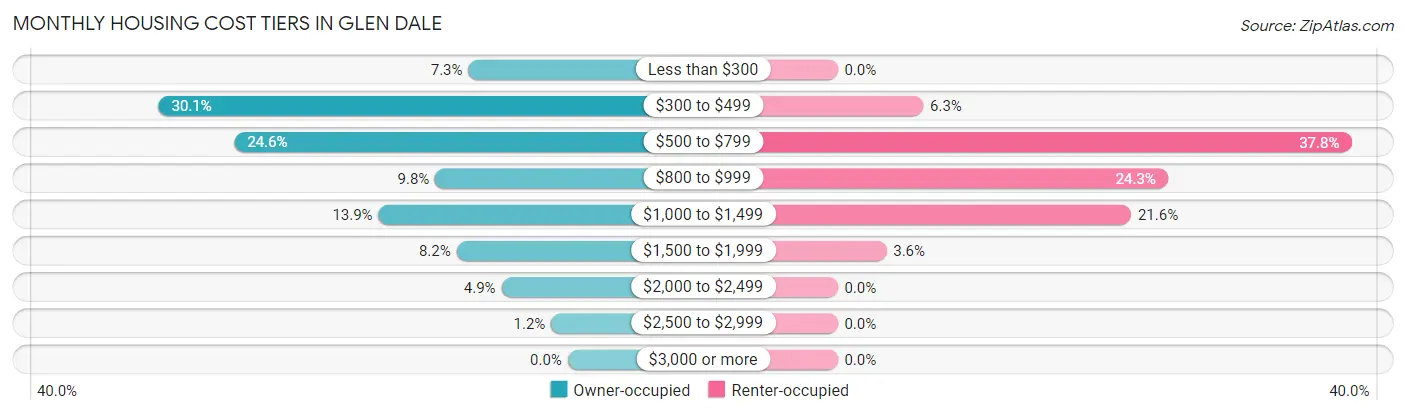
| Monthly Cost | Owner-occupied | Renter-occupied |
| Less than $300 | 42 (7.3%) | 0 (0.0%) |
| $300 to $499 | 173 (30.1%) | 7 (6.3%) |
| $500 to $799 | 141 (24.6%) | 42 (37.8%) |
| $800 to $999 | 56 (9.8%) | 27 (24.3%) |
| $1,000 to $1,499 | 80 (13.9%) | 24 (21.6%) |
| $1,500 to $1,999 | 47 (8.2%) | 4 (3.6%) |
| $2,000 to $2,499 | 28 (4.9%) | 0 (0.0%) |
| $2,500 to $2,999 | 7 (1.2%) | 0 (0.0%) |
| $3,000 or more | 0 (0.0%) | 0 (0.0%) |
| Total | 574 (100.0%) | 111 (100.0%) |
Physical Housing Characteristics in Glen Dale
Housing Structures in Glen Dale
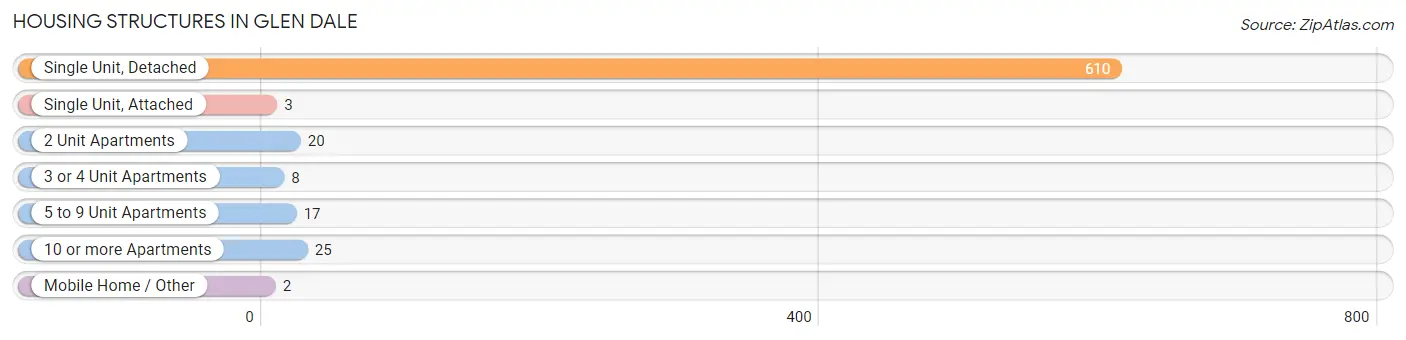
| Structure Type | # Housing Units | % Housing Units |
| Single Unit, Detached | 610 | 89.0% |
| Single Unit, Attached | 3 | 0.4% |
| 2 Unit Apartments | 20 | 2.9% |
| 3 or 4 Unit Apartments | 8 | 1.2% |
| 5 to 9 Unit Apartments | 17 | 2.5% |
| 10 or more Apartments | 25 | 3.6% |
| Mobile Home / Other | 2 | 0.3% |
| Total | 685 | 100.0% |
Housing Structures by Occupancy in Glen Dale
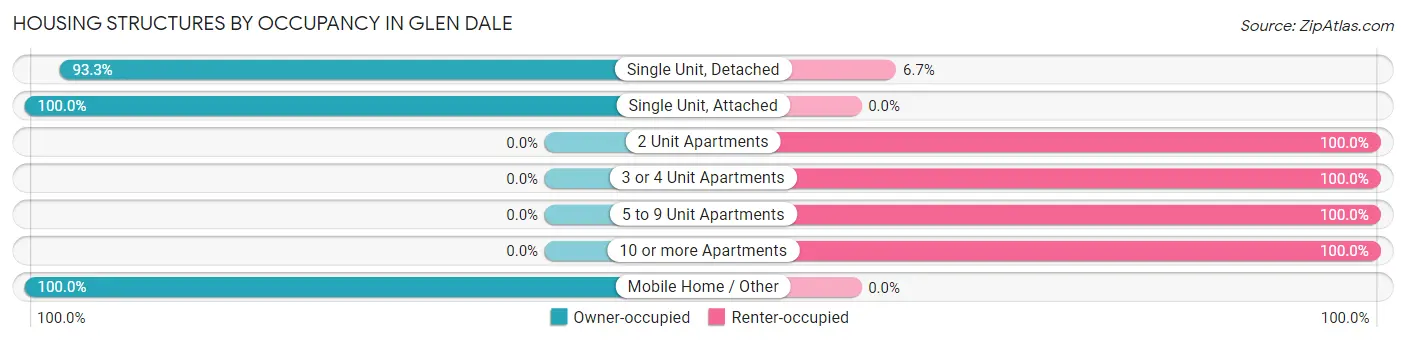
| Structure Type | Owner-occupied | Renter-occupied |
| Single Unit, Detached | 569 (93.3%) | 41 (6.7%) |
| Single Unit, Attached | 3 (100.0%) | 0 (0.0%) |
| 2 Unit Apartments | 0 (0.0%) | 20 (100.0%) |
| 3 or 4 Unit Apartments | 0 (0.0%) | 8 (100.0%) |
| 5 to 9 Unit Apartments | 0 (0.0%) | 17 (100.0%) |
| 10 or more Apartments | 0 (0.0%) | 25 (100.0%) |
| Mobile Home / Other | 2 (100.0%) | 0 (0.0%) |
| Total | 574 (83.8%) | 111 (16.2%) |
Housing Structures by Number of Rooms in Glen Dale
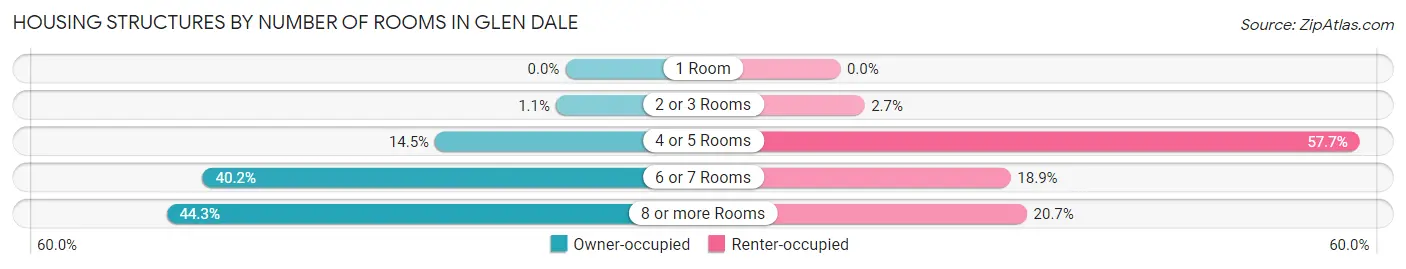
| Number of Rooms | Owner-occupied | Renter-occupied |
| 1 Room | 0 (0.0%) | 0 (0.0%) |
| 2 or 3 Rooms | 6 (1.1%) | 3 (2.7%) |
| 4 or 5 Rooms | 83 (14.5%) | 64 (57.7%) |
| 6 or 7 Rooms | 231 (40.2%) | 21 (18.9%) |
| 8 or more Rooms | 254 (44.3%) | 23 (20.7%) |
| Total | 574 (100.0%) | 111 (100.0%) |
Housing Structure by Heating Type in Glen Dale
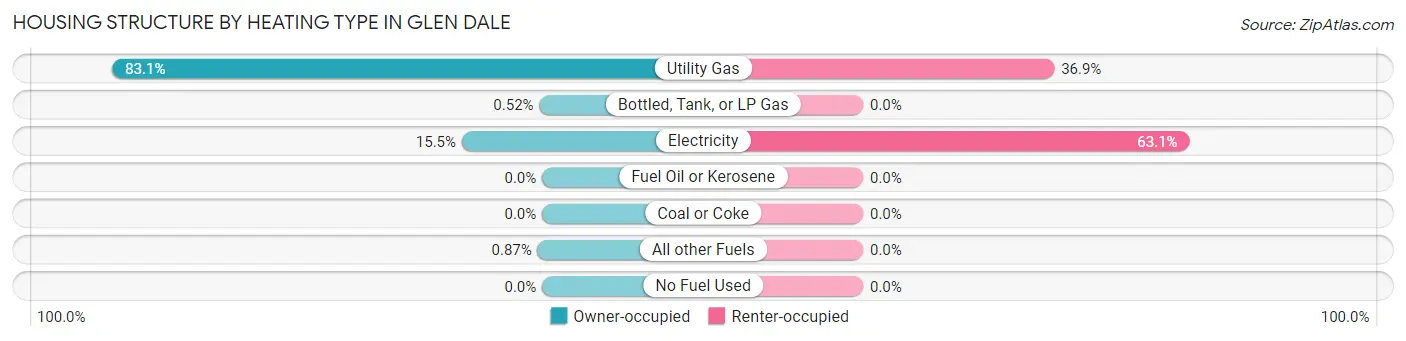
| Heating Type | Owner-occupied | Renter-occupied |
| Utility Gas | 477 (83.1%) | 41 (36.9%) |
| Bottled, Tank, or LP Gas | 3 (0.5%) | 0 (0.0%) |
| Electricity | 89 (15.5%) | 70 (63.1%) |
| Fuel Oil or Kerosene | 0 (0.0%) | 0 (0.0%) |
| Coal or Coke | 0 (0.0%) | 0 (0.0%) |
| All other Fuels | 5 (0.9%) | 0 (0.0%) |
| No Fuel Used | 0 (0.0%) | 0 (0.0%) |
| Total | 574 (100.0%) | 111 (100.0%) |
Household Vehicle Usage in Glen Dale
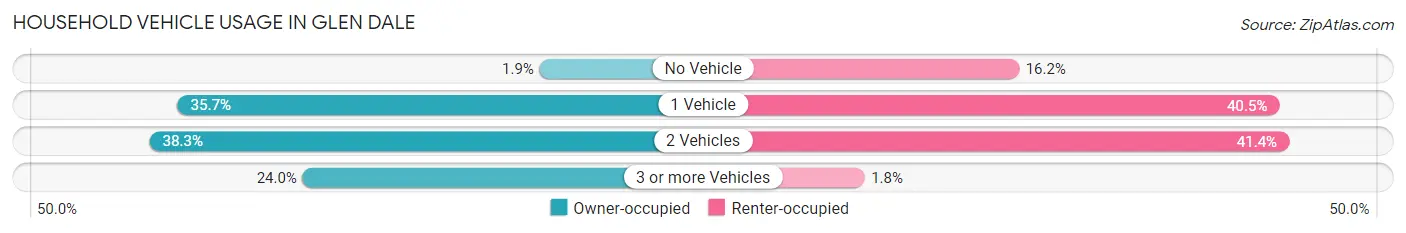
| Vehicles per Household | Owner-occupied | Renter-occupied |
| No Vehicle | 11 (1.9%) | 18 (16.2%) |
| 1 Vehicle | 205 (35.7%) | 45 (40.5%) |
| 2 Vehicles | 220 (38.3%) | 46 (41.4%) |
| 3 or more Vehicles | 138 (24.0%) | 2 (1.8%) |
| Total | 574 (100.0%) | 111 (100.0%) |
Real Estate & Mortgages in Glen Dale
Real Estate and Mortgage Overview in Glen Dale
| Characteristic | Without Mortgage | With Mortgage |
| Housing Units | 362 | 212 |
| Median Property Value | $210,200 | $199,100 |
| Median Household Income | $83,000 | $46 |
| Monthly Housing Costs | $458 | $0 |
| Real Estate Taxes | $1,062 | $8 |
Property Value by Mortgage Status in Glen Dale
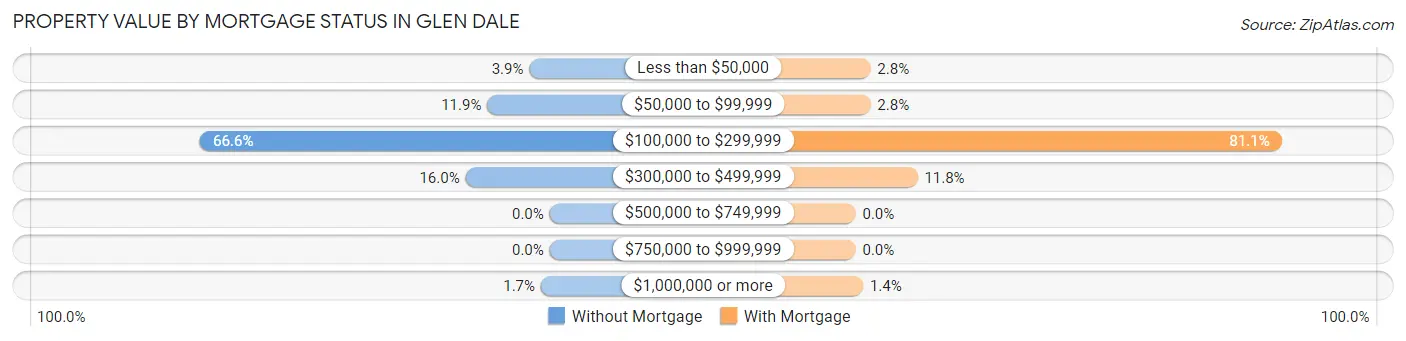
| Property Value | Without Mortgage | With Mortgage |
| Less than $50,000 | 14 (3.9%) | 6 (2.8%) |
| $50,000 to $99,999 | 43 (11.9%) | 6 (2.8%) |
| $100,000 to $299,999 | 241 (66.6%) | 172 (81.1%) |
| $300,000 to $499,999 | 58 (16.0%) | 25 (11.8%) |
| $500,000 to $749,999 | 0 (0.0%) | 0 (0.0%) |
| $750,000 to $999,999 | 0 (0.0%) | 0 (0.0%) |
| $1,000,000 or more | 6 (1.7%) | 3 (1.4%) |
| Total | 362 (100.0%) | 212 (100.0%) |
Household Income by Mortgage Status in Glen Dale
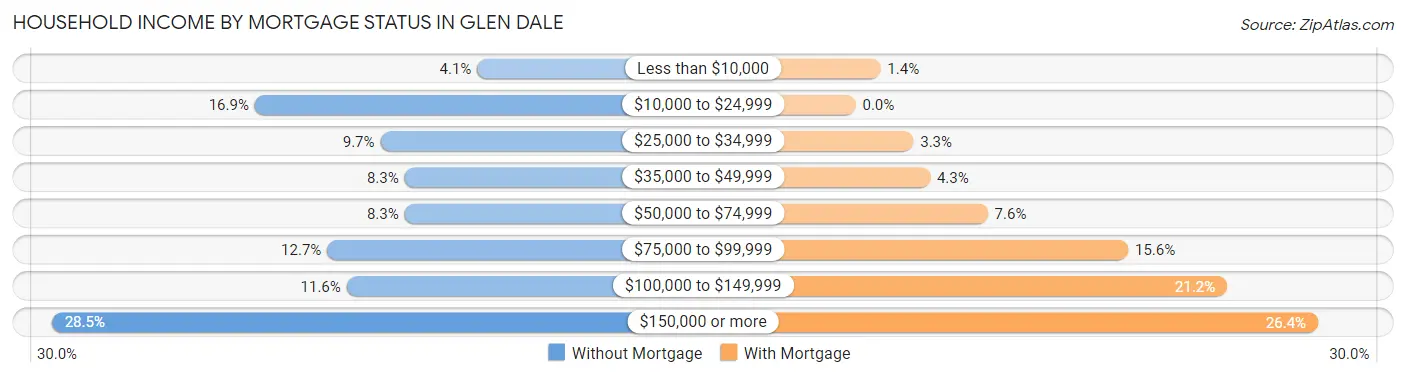
| Household Income | Without Mortgage | With Mortgage |
| Less than $10,000 | 15 (4.1%) | 3 (1.4%) |
| $10,000 to $24,999 | 61 (16.9%) | 0 (0.0%) |
| $25,000 to $34,999 | 35 (9.7%) | 7 (3.3%) |
| $35,000 to $49,999 | 30 (8.3%) | 9 (4.3%) |
| $50,000 to $74,999 | 30 (8.3%) | 16 (7.5%) |
| $75,000 to $99,999 | 46 (12.7%) | 33 (15.6%) |
| $100,000 to $149,999 | 42 (11.6%) | 45 (21.2%) |
| $150,000 or more | 103 (28.4%) | 56 (26.4%) |
| Total | 362 (100.0%) | 212 (100.0%) |
Property Value to Household Income Ratio in Glen Dale
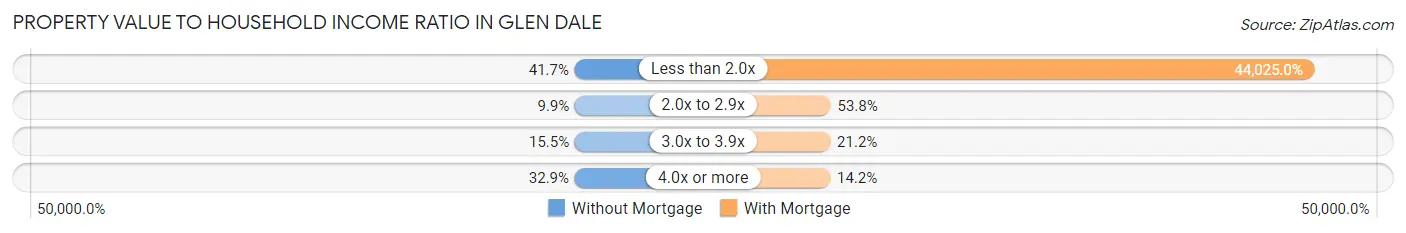
| Value-to-Income Ratio | Without Mortgage | With Mortgage |
| Less than 2.0x | 151 (41.7%) | 93,333 (44,025.0%) |
| 2.0x to 2.9x | 36 (9.9%) | 114 (53.8%) |
| 3.0x to 3.9x | 56 (15.5%) | 45 (21.2%) |
| 4.0x or more | 119 (32.9%) | 30 (14.1%) |
| Total | 362 (100.0%) | 212 (100.0%) |
Real Estate Taxes by Mortgage Status in Glen Dale
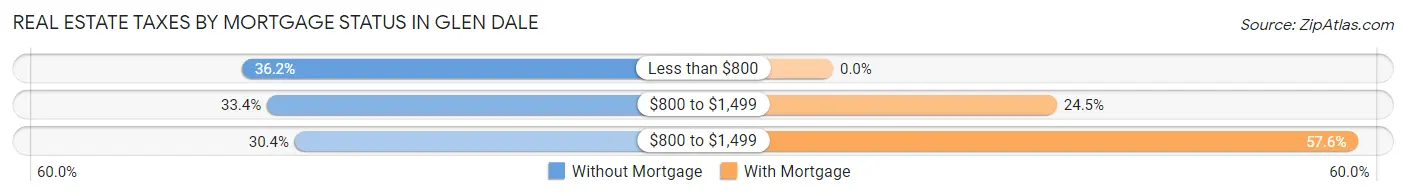
| Property Taxes | Without Mortgage | With Mortgage |
| Less than $800 | 131 (36.2%) | 0 (0.0%) |
| $800 to $1,499 | 121 (33.4%) | 52 (24.5%) |
| $800 to $1,499 | 110 (30.4%) | 122 (57.6%) |
| Total | 362 (100.0%) | 212 (100.0%) |
Health & Disability in Glen Dale
Health Insurance Coverage by Age in Glen Dale
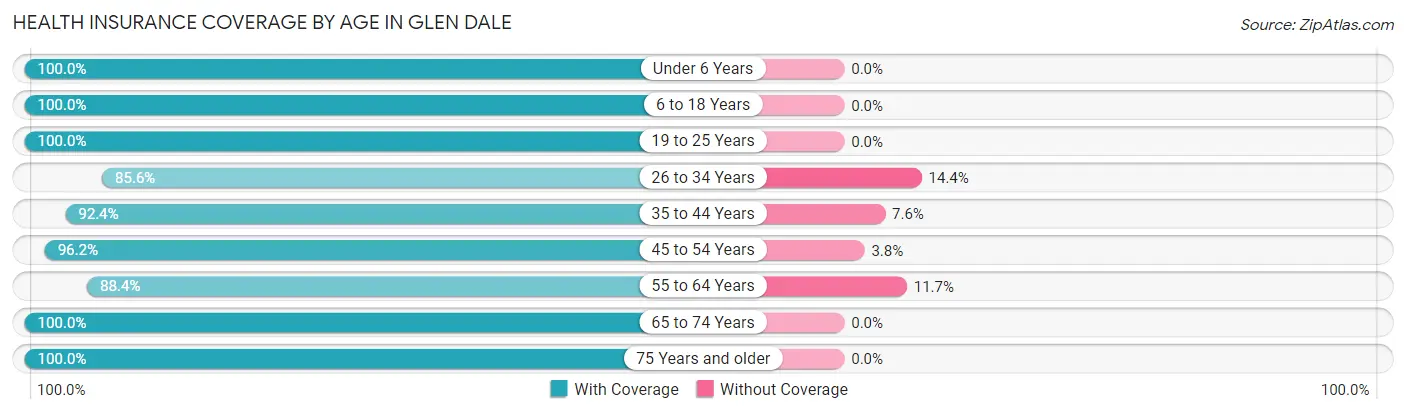
| Age Bracket | With Coverage | Without Coverage |
| Under 6 Years | 76 (100.0%) | 0 (0.0%) |
| 6 to 18 Years | 284 (100.0%) | 0 (0.0%) |
| 19 to 25 Years | 58 (100.0%) | 0 (0.0%) |
| 26 to 34 Years | 184 (85.6%) | 31 (14.4%) |
| 35 to 44 Years | 85 (92.4%) | 7 (7.6%) |
| 45 to 54 Years | 179 (96.2%) | 7 (3.8%) |
| 55 to 64 Years | 273 (88.3%) | 36 (11.7%) |
| 65 to 74 Years | 266 (100.0%) | 0 (0.0%) |
| 75 Years and older | 128 (100.0%) | 0 (0.0%) |
| Total | 1,533 (95.0%) | 81 (5.0%) |
Health Insurance Coverage by Citizenship Status in Glen Dale
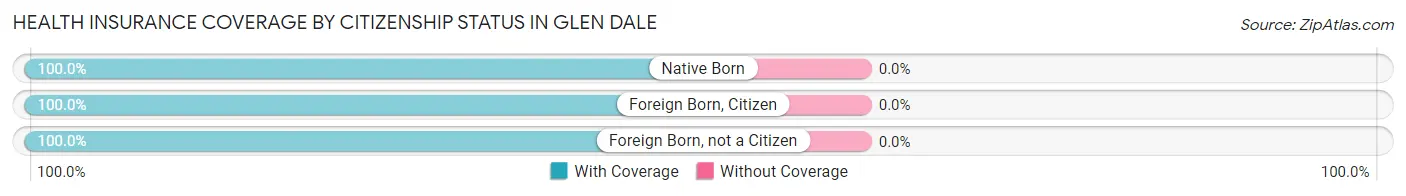
| Citizenship Status | With Coverage | Without Coverage |
| Native Born | 76 (100.0%) | 0 (0.0%) |
| Foreign Born, Citizen | 284 (100.0%) | 0 (0.0%) |
| Foreign Born, not a Citizen | 58 (100.0%) | 0 (0.0%) |
Health Insurance Coverage by Household Income in Glen Dale
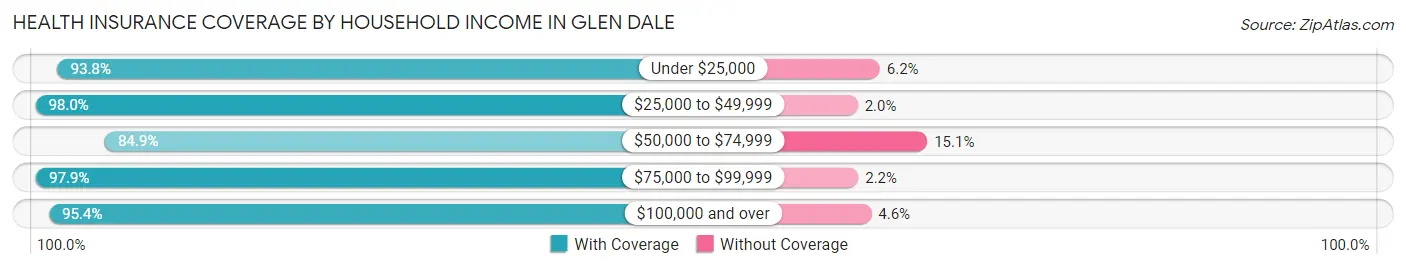
| Household Income | With Coverage | Without Coverage |
| Under $25,000 | 197 (93.8%) | 13 (6.2%) |
| $25,000 to $49,999 | 192 (98.0%) | 4 (2.0%) |
| $50,000 to $74,999 | 124 (84.9%) | 22 (15.1%) |
| $75,000 to $99,999 | 273 (97.9%) | 6 (2.1%) |
| $100,000 and over | 747 (95.4%) | 36 (4.6%) |
Public vs Private Health Insurance Coverage by Age in Glen Dale
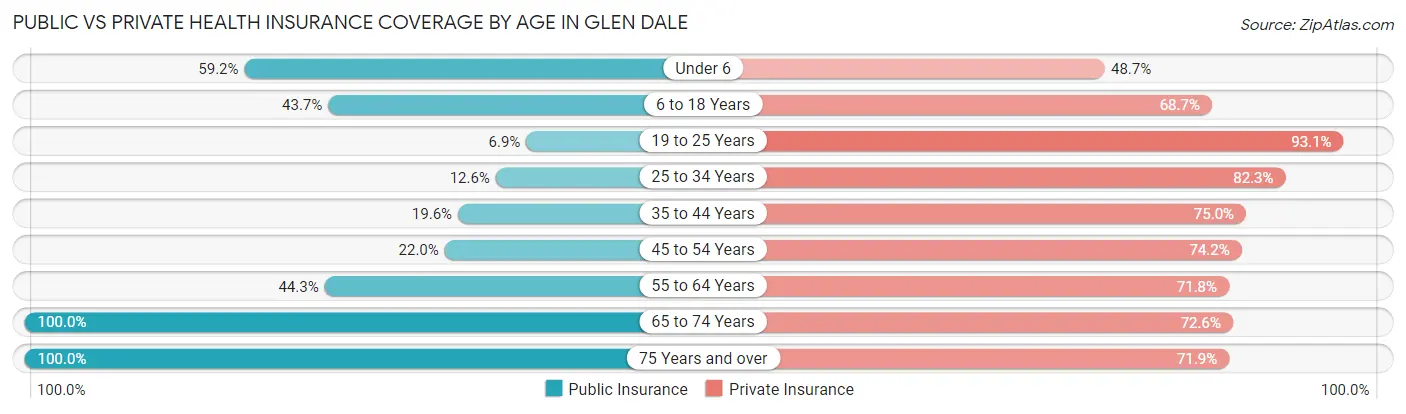
| Age Bracket | Public Insurance | Private Insurance |
| Under 6 | 45 (59.2%) | 37 (48.7%) |
| 6 to 18 Years | 124 (43.7%) | 195 (68.7%) |
| 19 to 25 Years | 4 (6.9%) | 54 (93.1%) |
| 25 to 34 Years | 27 (12.6%) | 177 (82.3%) |
| 35 to 44 Years | 18 (19.6%) | 69 (75.0%) |
| 45 to 54 Years | 41 (22.0%) | 138 (74.2%) |
| 55 to 64 Years | 137 (44.3%) | 222 (71.8%) |
| 65 to 74 Years | 266 (100.0%) | 193 (72.6%) |
| 75 Years and over | 128 (100.0%) | 92 (71.9%) |
| Total | 790 (48.9%) | 1,177 (72.9%) |
Disability Status by Sex by Age in Glen Dale
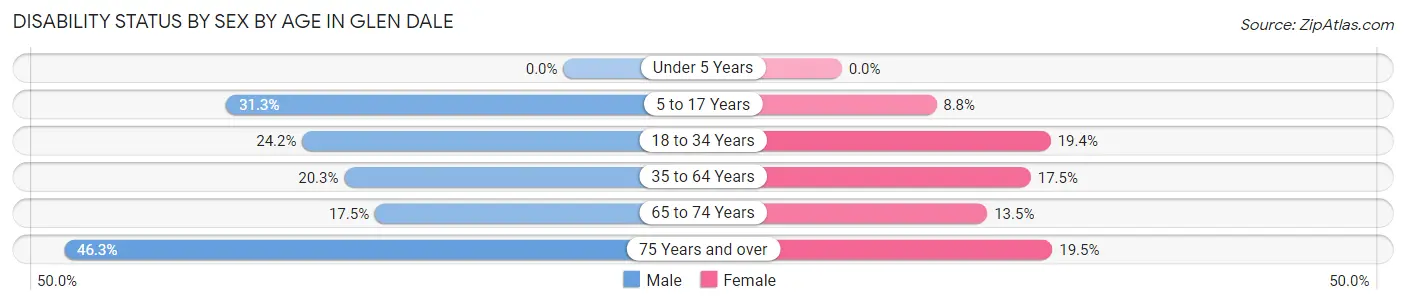
| Age Bracket | Male | Female |
| Under 5 Years | 0 (0.0%) | 0 (0.0%) |
| 5 to 17 Years | 41 (31.3%) | 10 (8.8%) |
| 18 to 34 Years | 55 (24.2%) | 19 (19.4%) |
| 35 to 64 Years | 73 (20.3%) | 40 (17.5%) |
| 65 to 74 Years | 18 (17.5%) | 22 (13.5%) |
| 75 Years and over | 19 (46.3%) | 17 (19.5%) |
Disability Class by Sex by Age in Glen Dale
Disability Class: Hearing Difficulty
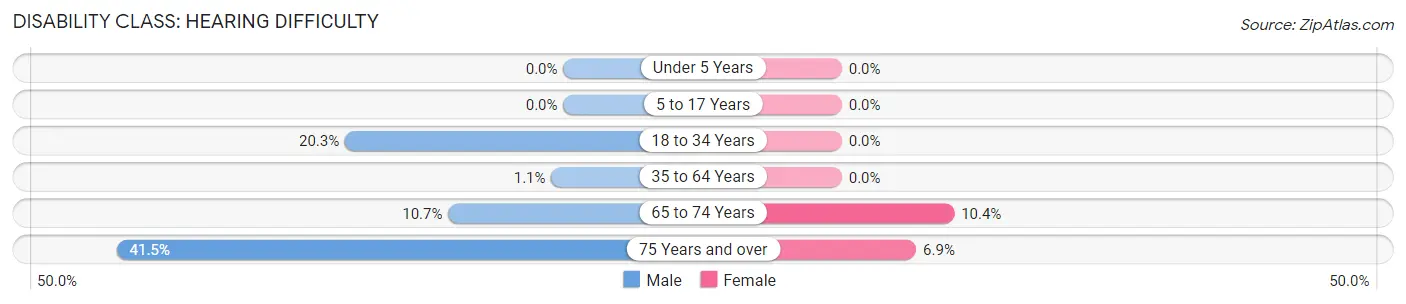
| Age Bracket | Male | Female |
| Under 5 Years | 0 (0.0%) | 0 (0.0%) |
| 5 to 17 Years | 0 (0.0%) | 0 (0.0%) |
| 18 to 34 Years | 46 (20.3%) | 0 (0.0%) |
| 35 to 64 Years | 4 (1.1%) | 0 (0.0%) |
| 65 to 74 Years | 11 (10.7%) | 17 (10.4%) |
| 75 Years and over | 17 (41.5%) | 6 (6.9%) |
Disability Class: Vision Difficulty
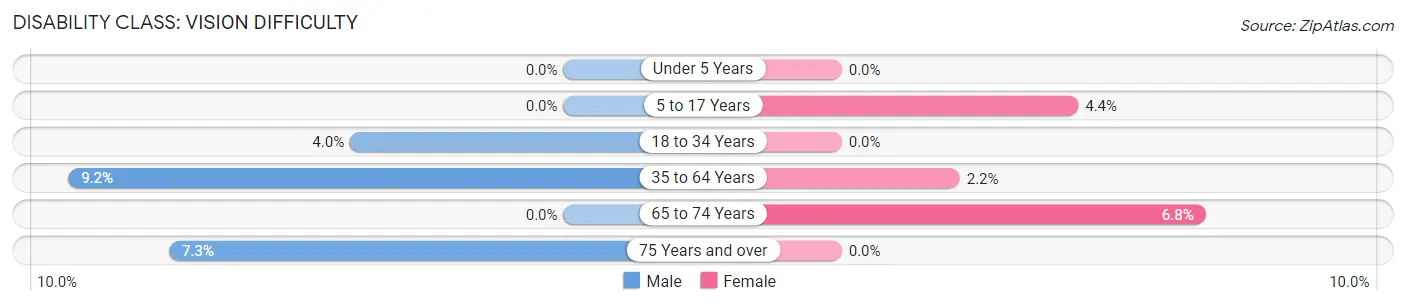
| Age Bracket | Male | Female |
| Under 5 Years | 0 (0.0%) | 0 (0.0%) |
| 5 to 17 Years | 0 (0.0%) | 5 (4.4%) |
| 18 to 34 Years | 9 (4.0%) | 0 (0.0%) |
| 35 to 64 Years | 33 (9.2%) | 5 (2.2%) |
| 65 to 74 Years | 0 (0.0%) | 11 (6.8%) |
| 75 Years and over | 3 (7.3%) | 0 (0.0%) |
Disability Class: Cognitive Difficulty
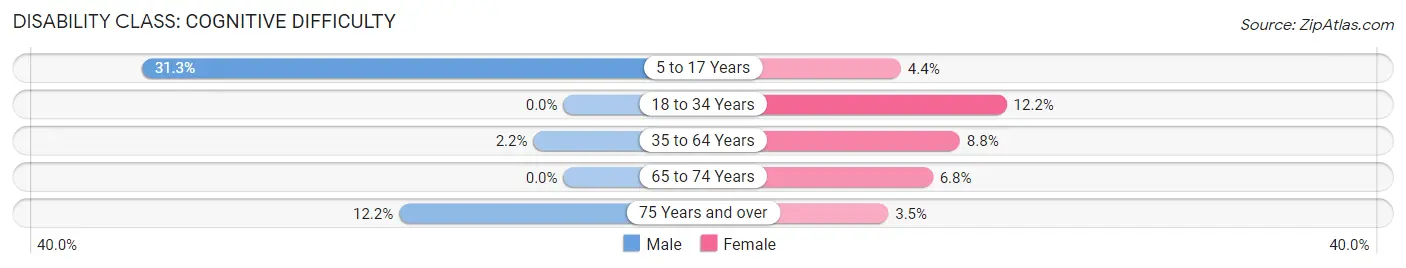
| Age Bracket | Male | Female |
| 5 to 17 Years | 41 (31.3%) | 5 (4.4%) |
| 18 to 34 Years | 0 (0.0%) | 12 (12.2%) |
| 35 to 64 Years | 8 (2.2%) | 20 (8.8%) |
| 65 to 74 Years | 0 (0.0%) | 11 (6.8%) |
| 75 Years and over | 5 (12.2%) | 3 (3.5%) |
Disability Class: Ambulatory Difficulty
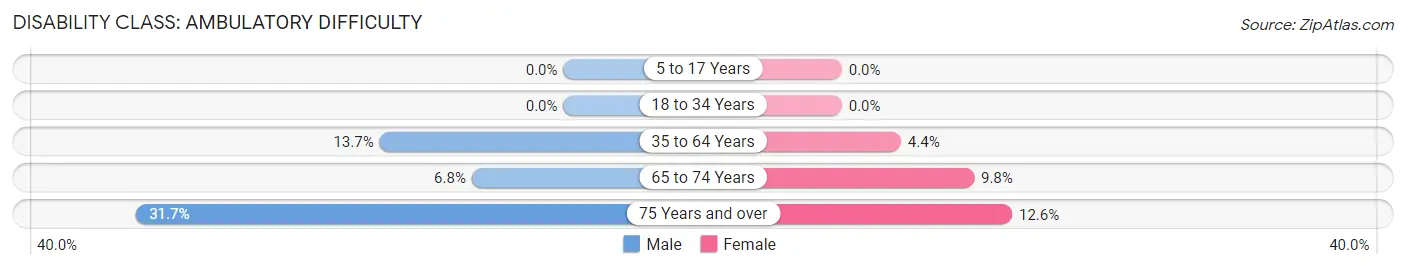
| Age Bracket | Male | Female |
| 5 to 17 Years | 0 (0.0%) | 0 (0.0%) |
| 18 to 34 Years | 0 (0.0%) | 0 (0.0%) |
| 35 to 64 Years | 49 (13.7%) | 10 (4.4%) |
| 65 to 74 Years | 7 (6.8%) | 16 (9.8%) |
| 75 Years and over | 13 (31.7%) | 11 (12.6%) |
Disability Class: Self-Care Difficulty
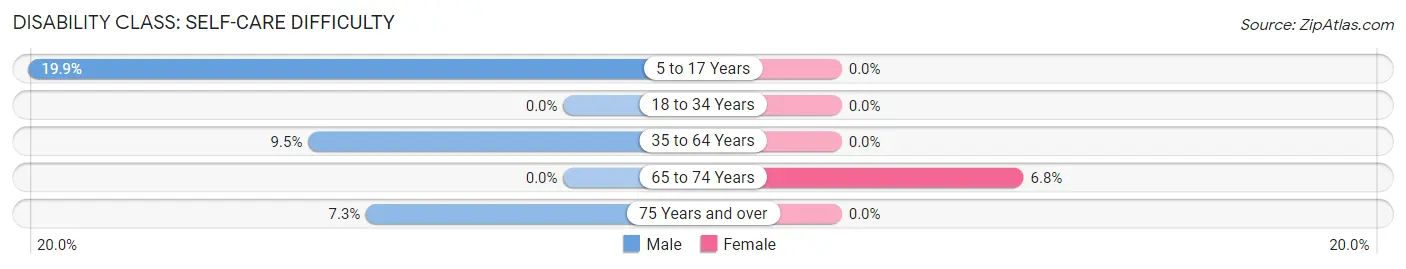
| Age Bracket | Male | Female |
| 5 to 17 Years | 26 (19.9%) | 0 (0.0%) |
| 18 to 34 Years | 0 (0.0%) | 0 (0.0%) |
| 35 to 64 Years | 34 (9.5%) | 0 (0.0%) |
| 65 to 74 Years | 0 (0.0%) | 11 (6.8%) |
| 75 Years and over | 3 (7.3%) | 0 (0.0%) |
Technology Access in Glen Dale
Computing Device Access in Glen Dale
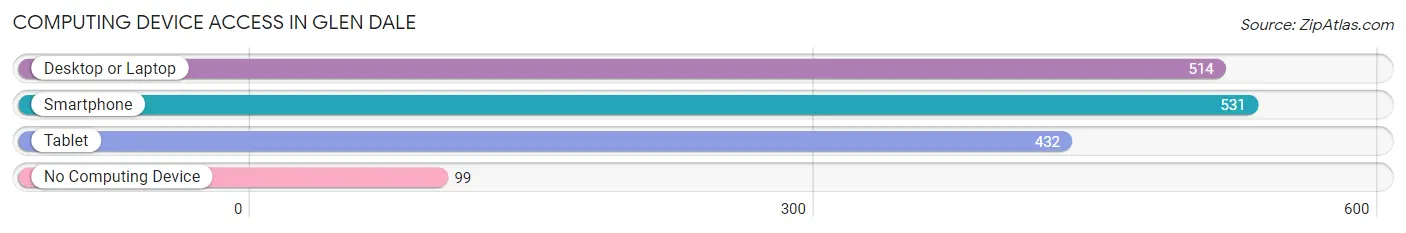
| Device Type | # Households | % Households |
| Desktop or Laptop | 514 | 75.0% |
| Smartphone | 531 | 77.5% |
| Tablet | 432 | 63.1% |
| No Computing Device | 99 | 14.4% |
| Total | 685 | 100.0% |
Internet Access in Glen Dale
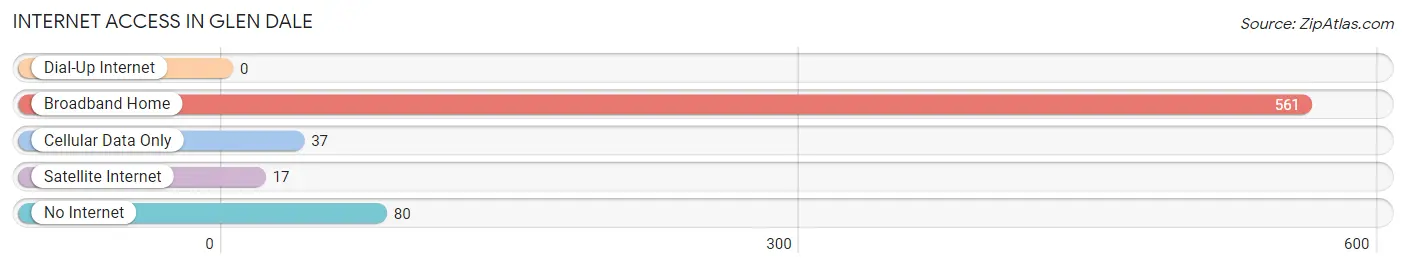
| Internet Type | # Households | % Households |
| Dial-Up Internet | 0 | 0.0% |
| Broadband Home | 561 | 81.9% |
| Cellular Data Only | 37 | 5.4% |
| Satellite Internet | 17 | 2.5% |
| No Internet | 80 | 11.7% |
| Total | 685 | 100.0% |
Glen Dale Summary
Glen Dale is a small town located in Marshall County, West Virginia. It is situated along the Ohio River, just south of Moundsville. The town was founded in 1872 and has a population of approximately 1,500 people.
Geography
Glen Dale is located in the northern panhandle of West Virginia, along the Ohio River. It is situated in the Appalachian Plateau region of the state, and is surrounded by rolling hills and forests. The town is located in the northern part of Marshall County, and is bordered by the towns of Moundsville, Benwood, and McMechen. The town is located approximately 30 miles south of Wheeling, West Virginia, and is accessible by Interstate 70.
Climate
Glen Dale has a humid continental climate, with hot summers and cold winters. The average temperature in the summer is around 75 degrees Fahrenheit, and the average temperature in the winter is around 30 degrees Fahrenheit. The town receives an average of 40 inches of precipitation per year, with most of it falling in the spring and summer months.
Demographics
As of the 2010 census, the population of Glen Dale was 1,521. The racial makeup of the town was 97.2% White, 0.7% African American, 0.2% Native American, 0.3% Asian, 0.1% Pacific Islander, 0.3% from other races, and 1.2% from two or more races. Hispanic or Latino of any race were 1.2% of the population.
Economy
The economy of Glen Dale is largely based on the manufacturing and service industries. The town is home to several factories, including a steel mill, a paper mill, and a plastics plant. The town also has several retail stores, restaurants, and other businesses. The town is also home to a number of small businesses, including a grocery store, a hardware store, and a pharmacy.
History
Glen Dale was founded in 1872 by a group of settlers from Pennsylvania. The town was named after the nearby Glen Dale Creek, which was named after a local Native American chief. The town quickly grew, and by the early 1900s, it had become a thriving industrial center. The town was home to several factories, including a steel mill, a paper mill, and a plastics plant.
In the late 20th century, the town began to decline as the factories closed and the population decreased. However, in recent years, the town has seen a resurgence in population and economic activity. The town is now home to several small businesses, and is a popular destination for tourists and outdoor enthusiasts.
Common Questions
What is Per Capita Income in Glen Dale?
Per Capita income in Glen Dale is $47,430.
What is the Median Family Income in Glen Dale?
Median Family Income in Glen Dale is $118,750.
What is the Median Household income in Glen Dale?
Median Household Income in Glen Dale is $80,917.
What is Income or Wage Gap in Glen Dale?
Income or Wage Gap in Glen Dale is 46.4%.
Women in Glen Dale earn 53.6 cents for every dollar earned by a man.
What is Family Income Deficit in Glen Dale?
Family Income Deficit in Glen Dale is $11,018.
Families that are below poverty line in Glen Dale earn $11,018 less on average than the poverty threshold level.
What is Inequality or Gini Index in Glen Dale?
Inequality or Gini Index in Glen Dale is 0.47.
What is the Total Population of Glen Dale?
Total Population of Glen Dale is 1,614.
What is the Total Male Population of Glen Dale?
Total Male Population of Glen Dale is 902.
What is the Total Female Population of Glen Dale?
Total Female Population of Glen Dale is 712.
What is the Ratio of Males per 100 Females in Glen Dale?
There are 126.69 Males per 100 Females in Glen Dale.
What is the Ratio of Females per 100 Males in Glen Dale?
There are 78.94 Females per 100 Males in Glen Dale.
What is the Median Population Age in Glen Dale?
Median Population Age in Glen Dale is 47.9 Years.
What is the Average Family Size in Glen Dale
Average Family Size in Glen Dale is 3.0 People.
What is the Average Household Size in Glen Dale
Average Household Size in Glen Dale is 2.4 People.
How Large is the Labor Force in Glen Dale?
There are 748 People in the Labor Forcein in Glen Dale.
What is the Percentage of People in the Labor Force in Glen Dale?
56.4% of People are in the Labor Force in Glen Dale.
What is the Unemployment Rate in Glen Dale?
Unemployment Rate in Glen Dale is 6.1%.